5490
7T GRE-MRI frequency shifts obtained from signal compartments can differentiate normal from dysplastic tissue in focal epilepsy1Center for Advance Imaging, University of Queensland, Brisbane, Australia
Synopsis
Quantitative assessment of water fraction, relaxation time, and frequency shift using a multi-compartment model can be useful in understanding diseases and disorders affecting the human brain. We aimed to explore tissue microstructure information contained in voxel signals by analysing voxel compartment water fraction, $$$T_2^*$$$ and frequency shift derived from 7T multi-echo gradient recalled echo MRI data. We recruited four patients with focal cortical dysplasia and compartmentalised normal and dysplastic cortical regions. Parameterisation of tissue characteristics in focal cortical dysplasia can potentially delineate cortical areas which have undergone microstructural changes. This provides a promising framework for studying neurodegenerative processes.
INTRODUCTION:
Focal cortical dysplasia (FCD) is a developmental malformation of the cerebral cortex with different sub-types. FCDs are characterised by abnormal cortical architecture, with disruption of the normal organisation of the cortex into well-defined layers and blurring of the boundary between the cortex and the underlying white matter. The most sensitive non-invasive imaging technique for detecting FCD in vivo is MRI. 1.5T and 3T clinical evaluation typically involves collection of $$$T_1$$$, $$$T_2$$$, and $$$T_2$$$ fluid-attenuated inversion recovery (FLAIR) MRI data. But standard clinical MRI sequences do not reveal an identifiable lesion in 20-30% of patients.1 Gradient recalled echo (GRE)-MRI data provides information on signal phase,2 which has been shown to be influenced by tissue characteristics with biological significance, namely tissue structure, composition and microarchitectural features (i.e. density, uniformity and axon orientation).3,4 The influence of tissue characteristics on the temporal GRE-MRI signal can be explained by compartmentalising the voxel into distinct signal compartments.5,6 Our aim here was to test whether parameters of an existing three compartment model could potentially distinguish the normal cortex from the FCD affected cortex. Such an ability may lead to a clearer diagnosis for patients with suspected FCD, whilst providing more accurate surgical mark-up where ongoing seizures necessitate the need for surgical resection.METHODS
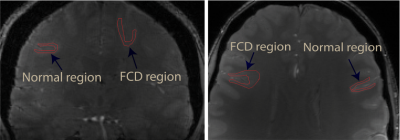
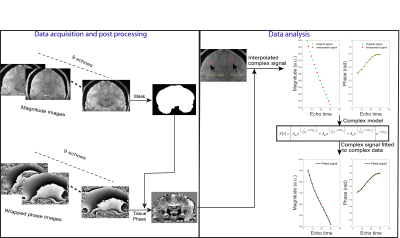
We received ethics approval from the local ethics committee and written informed consent was obtained from four patients (aged 33-54) with clinically diagnosed FCD. The data were acquired using a 3D GRE-MRI sequence on a 7T whole-body MRI research scanner (Siemens Healthcare, Erlangen, Germany) with a 32 channel head coil (Nova Medical, Wilmington, USA) using the following parameters: TE1=4.98ms with echo spacing of 3.13ms and 9 echoes, TR=60ms, flip-angle=15o, voxel-size=1mm$$$\times$$$1mm$$$\times$$$1mm and matrix size=280$$$\times$$$242$$$\times$$$160. A brain mask for each participant was created using MIPAV (Medical Imaging Processing and Visualisation, https://mipav.cit.nih.gov).7 iHARPERELLA (http://people.duke.edu/~cl160, STI Suite)8 was used to compute tissue phase at each echo time point. These 9 echo points were interpolated to 17 echo points. The normal and FCD regions were segmented manually using MIPAV, and an example is shown in Fig 1. Signal fitting was performed in a region of interest (ROI) from each slice using the three compartment model:9
$$s\left(t\right)=\left[A_{my}e^{-\left(\frac{1}{T_{2,my}^*}+2\pi i\Delta f_{my}\right)t}+A_{ax} e^{-\left(\frac{1}{T_{2,ax}^*}+2\pi i\Delta f_{ax}\right)t}+A_{ex}e^{-\left(\frac{1}{T_{2,ex}^*}+2\pi i\Delta f_{ex}\right)t}\right]e^{-2\pi i\Delta f_{bg}t} $$
where $$$A_{my}$$$, $$$A_{ax}$$$ and $$$A_{ex}$$$ are volume fractions for the myelin, axonal, and extracellular compartments, respectively, and corresponding $$$T_{2,my}^*$$$, $$$T_{2,ax}^*$$$ and $$$T_{2,ex}^*$$$ and $$$\Delta f_{my}$$$, $$$\Delta f_{ax}$$$ and $$$\Delta f_{ex}$$$ are the compartment relaxation times and frequency shifts. Fitting was performed in MATLAB (MathWorks, Natick, MA) using a non-linear curve fitting method (lsqnonlin). We used a term to cater for background offset,9 expressed in terms of a background frequency shift ($$$\Delta f_{bg}$$$). The steps involved in computing tissue parameters has been summarised in Fig 2. We performed a one-way ANOVA to test whether compartment parameters had significant differences between normal and FCD cortical regions.
RESULTS
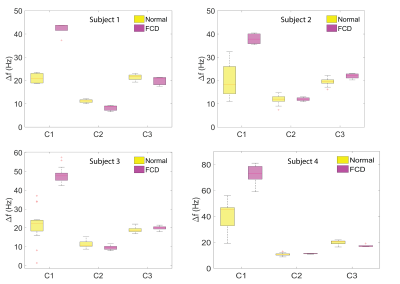
Fig 3 shows the frequency shift values within the normal and FCD regions computed using three compartment models in four patients. We defined signal compartments by the size of the $$$T_2^*$$$ parameter (i.e. compartment 1 was defined having the shortest $$$T_2^*$$$ value). In each of the four patients, we found a significant difference in the frequency shift parameter for the first signal compartment between normal and FCD affected regions (p<0.0001 for all patients). The mean and standard deviation of frequency shifts, and the standard error calculated for each subject across different slices is provided in Table 1.DISCUSSION
Paramagnetic iron in damaged tissue has been proposed as a cause for GRE-MRI frequency shifts.10 It has also been shown that anisotropic healthy white matter increases the resonance frequency11 and subtle changes in tissue may lead to substantially increased frequency shifts in multiple sclerosis lesions.12,13 We found significantly increased frequency shifts in the FCD affected cortex, which may be due to the disruption of tissue microstructure. The next step should be to investigate how compartment model frequency shifts can be used to delineate the extent of FCD, and whether frequency shifts can provide additional information in patients with unclear imaging findings.CONCLUSION
Our findings suggest that signal compartments derived from 7T multiple-echo GRE-MRI data are sensitive to cortical malformations associated with focal cortical dysplasia. Thereby, signal compartmentalisation may play a key role in neuroimaging studies to help differentiate the healthy cortex from cortical malformations.Acknowledgements
MB acknowledges funding from Australian Research Council Future Fellowship grant FT140100865. SB acknowledges funding from UQ Postdoctoral Research Fellowship grant and an NVIDIA Hardware Seed Grant. The authors acknowledge the facilities of the National Imaging Facility (NIF) at the Centre for Advanced Imaging, University of Queensland. VV would also like to thank the National Health and Medical Research Council for discovery grant funding (AP1104933).References
1. Duncan, J. S. Imaging in the surgical treatment of epilepsy. Nat. Rev. Neurol. 6, 537–550 (2010).
2. Reichenbach, J. R. The future of susceptibility contrast for assessment of anatomy and function. NeuroImage 62, 1311–1315 (2012).
3. Wharton, S. & Bowtell, R. Gradient echo based fiber orientation mapping using R2* and frequency difference measurements. NeuroImage 83, 1011–1023 (2013).
4. Lodygensky, G. A. et al. In vivo assessment of myelination by phase imaging at high magnetic field. NeuroImage 59, 1979–1987 (2012).
5. Hwang, D., Kim, D.-H. & Du, Y. P. In vivo multi-slice mapping of myelin water content using T2* decay. NeuroImage 52, 198–204 (2010).
6. Wu, Z., He, H., Sun, Y., Du, Y. & Zhong, J. High resolution myelin water imaging incorporating local tissue susceptibility analysis. Magn. Reson. Imaging 42, 107–113 (2017).
7. McAuliffe, M. J. et al. Medical Image Processing, Analysis and Visualization in clinical research. in 14th IEEE Symposium on Computer-Based Medical Systems, 2001. CBMS 2001. Proceedings 381–386 (2001).
8. Li, W., Avram, A. V., Wu, B., Xiao, X. & Liu, C. Integrated Laplacian-based phase unwrapping and background phase removal for quantitative susceptibility mapping. NMR Biomed. 27, 219–227 (2014).
9. Nam, Y., Lee, J., Hwang, D. & Kim, D.-H. Improved estimation of myelin water fraction using complex model fitting. NeuroImage 116, 214–221 (2015).
10. Hammond, K. E. et al. Quantitative in vivo magnetic resonance imaging of multiple sclerosis at 7Tesla with sensitivity to iron. Ann. Neurol. 64, 707–713 (2008).
11. He, X. & Yablonskiy, D. A. Biophysical mechanisms of phase contrast in gradient echo MRI. Proc. Natl. Acad. Sci. 106, 13558–13563 (2009).
12. Yablonskiy, D. A., Luo, J., Sukstanskii, A. L., Iyer, A. & Cross, A. H. Biophysical mechanisms of MRI signal frequency contrast in multiple sclerosis.Proc. Natl. Acad. Sci.109, 14212–14217 (2012).
13. Wiggermann, V. et al. Magnetic resonance frequency shifts during acute MS lesion formation. Neurology 81, 211–218 (2013).
Figures


