5489
Accurate measurement of susceptibility and orientation using non-linear signal phase evolution; validation in a phantom experiment1Sir Peter Mansfield Imaging Centre, School of Physics and Astronomy, University of Nottingham, Nottingham, United Kingdom, 2Division of Clinical Neuroscience, School of Medicine, University of Nottingham, Nottingham, United Kingdom
Synopsis
We validate the use of non-linear signal phase evolution to estimate the susceptibility and orientation of sub-voxel structures. Capillary tubes filled with ferritin solutions of varying susceptibility were positioned in a water phantom. Multi-echo gradient-echo scans (100 echoes, echo-spacing=0.6ms) were acquired for multiple orientations of the capillaries with respect to the magnetic field. Fitting a 2-compartment model to the complex signal, processed using frequency difference mapping (FDM), resulted in susceptibility and signal fraction estimates in good agreement with theoretical predictions. Non-linear phase evolution, processed using FDM, may provide new insight into microvascular structure and physiology.
Introduction
Recently we reported that non-linear signal phase evolution can be used to characterise the physiology and structure of the cerebrovasculature1. In this work we introduce a phantom model to better understand the complex multi-echo gradient-echo (MEGE) signal in the presence of multiple signal compartments at the sub-voxel level. We compare the results of fitting a two-compartment model to magnitude and phase data preprocessed to remove background field effects. Estimating susceptibility values and compartment volume fractions, we ascertain the feasibility and limitations of the technique for quantification of blood oxygenation and volume in-vivo.
Phantom design
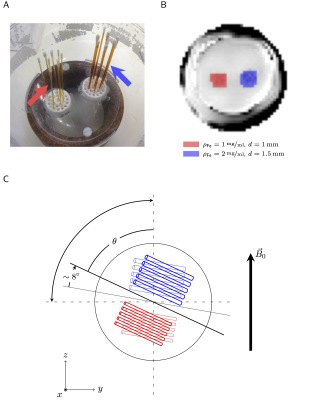
Borosilicate glass capillary tubes ($$$\chi=-11\,\mathrm{ppm}$$$) with diameter d=1mm or 1.5mm, and wall thickness: 0.01-0.02mm, were filled with aqueous ferritin solution (iron concentrations 1mg/ml and 2mg/ml, respectively). The tubes were glued vertically onto a platform (6-8mm separation), and placed in a spherical shell filled with water (Fig.1A).
Signal acquisition and processing
Low-resolution ($$$4\times4\times4\,\mathrm{mm}^3$$$) single-slice bipolar MEGE data were acquired using a 7T Philips Achieva scanner (100 echoes; TE1=1.1ms; ΔTE=0.6ms; TR=100ms; flip-angle $$$10^\circ$$$; 5 averages).
By rotating the phantom in the coronal plane we achieved 14 different orientations of the capillary tubes ranging from $$$0^\circ-90^\circ$$$ with respect to the magnetic field $$$\vec{B}_0$$$, (Fig.1C). The MEGE image slice was re-positioned to orthogonally transect the capillaries. Capillary orientations were estimated from a high-resolution ($$$0.75\times0.75\times0.75\,\mathrm{mm}^3$$$) gradient-echo scan (TE=30ms).
Complex signals acquired with opposite read-gradient polarities were multiplied together to remove phase inconsistencies between adjacent echoes2. Frequency difference mapping (FDM) was applied to remove the non-local phase effects without corrupting the local phase evolution:
$$\mathrm{FDM}_n=\arg\left(\frac{S^+_n\cdot{S^-_n}\cdot\left[S^+_1\cdot{S^-_1}\right]^{n-2}}{\left[S^+_2\cdot{S^-_2}\right]^{n-1}}\right)\frac{1}{4\pi(n-2)\Delta\mathrm{TE}},\qquad[1]$$
where $$$S_n$$$ is the complex signal acquired at the nth echo-time $$$\mathrm{TE}_n=\mathrm{TE}_1+(n-1)\Delta\mathrm{TE}$$$, and $$$\pm$$$ denotes the read-gradient polarity. FDM was previously applied on unipolar MEGE data3; this is the first application to bipolar MEGE data, which enables closer echo spacing.
Finally, FDM and magnitude data were averaged over two ROIs containing the capillary tubes (Fig.1B), and magnitude data were normalised to the signal measured at TE1.
Signal Modelling
We fitted a 2-compartment model of the local signal evolution, $$$F(\mathrm{TE}_n)$$$:
$$F(\mathrm{TE}_n)=(1-A)\cdot{e^{-R^*_{2,\text{water}}\mathrm{TE}_n}}+A\cdot{e^{i\omega\mathrm{TE}_n}}e^{-R^*_{2,\text{ferritin}}\mathrm{TE}_n},\qquad[2]$$
where $$$A$$$ is the ferritin solution signal fraction, $$$\omega$$$ is the orientation-dependent frequency offset between the water and ferritin compartments, and $$$R^*_{2,\text{water/ferritin}}$$$ represents the corresponding relaxation rates.
Results
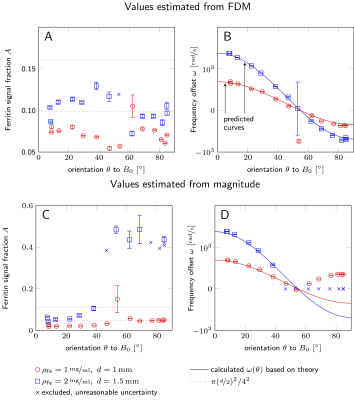
Fig.2 shows values of $$$A$$$ and $$$\omega$$$ obtained by fitting Eq.[2] to FDM (Fig.2A.-B.) and magnitude data (Fig.2C.-D.). Dotted lines indicate the maximum volume fraction of a capillary within a voxel ($$$\pi(d/2)^2/4^2$$$). Solid lines show the predicted frequency offset $$$\omega(\theta)$$$ calculated using the susceptibility, $$$\Delta\chi$$$, (determined by the iron concentration4) of the ferritin solution:
$$\omega(\theta)=\gamma{B_0}\frac{\Delta\chi}{2}\cdot\left(\cos^2\theta-\frac{1}{3}\right),\qquad[3]$$
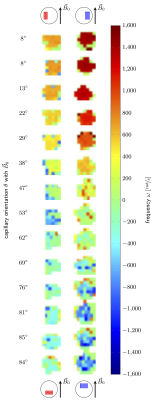
where $$$\theta$$$ denotes the orientation of the capillaries with respect to $$$\vec{B}_0$$$. Fig.3 maps the variation of $$$\omega$$$ as a function of orientation $$$\theta$$$ for the two groups of capillaries, obtained from voxelwise fitting of FDM data.
Discussions
The frequency offset of the capillary tubes, $$$\omega(\theta)$$$, obtained from FDM data (Fig.2B) shows extremely good agreement with the predicted evolution. This demonstrates that FDM data are very sensitive to the susceptibility difference between the two compartments and the orientation of the capillaries at the sub-voxel level.
In contrast, the magnitude data show insensitivity to the sign of $$$\omega(\theta)$$$ (red circles, $$$\theta>54.7^\circ$$$, Fig.2D), and the fitting procedure failed for the capillaries with higher iron concentration at $$$\theta>40^\circ$$$ (blue crosses, Fig.2D). We interpret these results to mean that the signal decay of the surrounding water can no longer be described as a single exponential for high iron concentrations and orientations closer to perpendicular. In these instances, our two-compartment model fails in the magnitude data. However, FDM data are less sensitive to relaxation times, and characterisation of $$$\omega$$$ is still achievable.
At low flip-angles, $$$A$$$ can be interpreted as the partial volume fraction of the capillaries. We observe larger signal fraction $$$A$$$ in larger capillaries. Small variations of $$$A$$$ with $$$\theta$$$ likely originate from variations in image slice positioning. We expect the maximum possible volume fractions (dotted lines, Fig2A-C) to overestimate the true signal fraction within our ROIs, which likely include edge voxels with small or no contribution from capillaries. However, the ratio of the signal fraction estimated in the two ROIs using the FDM data agrees well with prediction: $$$A_\text{small}/A_\text{large}=0.4545$$$, $$$(d_\text{small}/d_\text{large})^2=0.4444$$$.
Conclusion
Analysis of the evolution of phase and provides better estimation of sub-voxel frequency offsets than magnitude data. By applying FDM to bipolar MEGE data, we achieved shorter echo spacing, better sampling of any fast-decaying signal compartments. The phantom’s lower-concentration ferritin solution has comparable susceptibility to venous blood ($$$\Delta\chi\approx1\,\mathrm{ppm}$$$); changes in $$$\Delta\chi_\text{venous}$$$ reflect oxygenation status, an important neurophysiological biomarker. The biggest advantage of our method is that we can access the oxygenation and volume of vessels with known orientation, or investigate coherent venous orientation at the microscopic level, without requiring high-resolution scans that resolve individual microvessels.
Acknowledgements
Molly Bright is supported by the Anne McLaren Fellowship programme.References
- Elena Kleban, Richard Bowtell, Penny Gowland, Molly Bright (2017). Quantification of cerebral venous oxygenation using a two-compartment model of local phase evolution; ISMRM, 3800
- Huanzhou Yu, Ann Shimakawa, Charles A. McKenzie, Wenmiao Lu, Scott B. Reeder, R. Scott Hinks, Jean H. Brittain (2010). Phase and Amplitude Correction for Multi-Echo Water–Fat Separation With Bipolar Acquisitions; JMRI 31:1264–1271
- Samuel Wharton, Richard Bowtell (2012). Fiber orientation-dependent white matter contrast in gradient echo MRI; PNAS 109,45,18559-18564
- Zheng, W., Nichol, H., Liu, S., Cheng, Y.-C. N., & Haacke, E. M. (2013). Measuring iron in the brain using quantitative susceptibility mapping and X-ray fluorescence imaging. NeuroImage, 78, 68–74.
Figures

Figure 1
A. Capillary tubes filled with an aqueous ferritin sollution, are placed vertically on a platform; B. ROIs containing two separate groups of capillaries with diameter 1mm (red) and 1.5mm (blue) with iron concentrations of 1mg/ml and 2mg/ml, respectively; C. Experimental setup: the phantom was rotated in the coronal plane to achieve multiple capillary orientations with respect to $$$\vec{B}_0$$$, ranging from $$$0^\circ-90^\circ$$$.

Figure 2
The plotted values in A. and C. show the fitted values for ferritin solution signal fraction, while the dotted lines indicate the maximum possible capillary volume fraction per voxel ($$$\pi(\mathrm{d}/2)^2/4^2$$$). The plots in B. and D. show the fitted values for the frequency offset between water and ferritin compartments, while the solid lines indicate the predicted curves calculated from theory for each iron concentration. The values were estimated by fitting a 2-compartment model to FDM (A.-B.) and magnitude (C.-D.) data evolution with echo-time.
The area around the magic angle is ill-conditioned ($$$\omega(\theta\to54.7^\circ)\sim(\cos^2\theta-1/3)\to0$$$), this leads to large uncertainties and inaccurate estimation of $$$\omega$$$.

Figure 3
Values for the frequency offsets between the compartments obtained from FDM data are illustrated for both capillary groups: the capillaries marked in red (left column) had d=1mm and iron concentration 1mg/ml, the capillaries marked in blue (right column) had d=1.5mm and iron concentration 2mg/ml.
The larger frequency offsets at the extreme orientations are consistent with the higher iron concentration and thus higher susceptibility of the ferritin solution. Frequency offsets for both capillary groups approach 0 at the orientations close to $$$54.7^\circ$$$, the so-called 'magic angle'.