5488
Acceleration strategies for whole brain quantitative Magnetization Transfer Imaging1Queen Square MS Centre, UCL Institute of Neurology, Faculty of Brain Sciences, University College London, London, United Kingdom, 2Centre for Medical Image Computing, Department of Computer Science, University College London, London, United Kingdom, 3Philips UK, Surrey, United Kingdom, 4Translational Imaging Group, Centre for Medical Image Computing (CMIC), Department of Medical Physics and Bioengineering, University College London, London, United Kingdom, 5Department of Brain and Behavioural Sciences, University of Pavia, Pavia, Italy, 6Brain MRI 3T Research Centre, C. Mondino National Neurological Institute, Pavia, Italy
Synopsis
Methods for quantitative measurement of myelin are of great interest for understanding brain tissue microstructure, and have potentially important implications in clinical settings for improved diagnosis and prognosis in demyelinating diseases. Quantitative Magnetization Transfer (qMT) has been proposed as a sensitive MRI technique for myelin mapping in the central nervous system. However, after an initial wave of interest, it has never found a successful translation into a clinical scenario, mostly due to its prohibitive scan time. Here we investigate solutions to promote the development of fast qMT protocols including simultaneous multi-slice EPI, and provide preliminary results in vivo.
Introduction
Quantitative Magnetization Transfer (qMT) provides a measure of macromolecular tissue content through the bound pool fraction (BPF), suggested as a sensitive myelin biomarker in the brain and spinal cord1.
Implementation of qMT within clinically accepted times remains challenging. Rapid qMT approaches recently proposed2,3 necessarily introduce approximations in the signal modelling and involve constraints on unknown tissue parameters, whose validity needs to be demonstrated on a case-specific basis4.
Here, we investigate alternative methodologies to perform and speed up qMT acquisition in vivo. In particular, (i) qMT is implemented by means of an EPI readout to allow a high number of data points to be acquired, (ii) a more general model fitting approach is considered, removing the necessity for separate measurement of the longitudinal relaxation time (T1obs), and (iii) Simultaneous-multi-slice (SMS) excitation is used to accelerate acquisition.
Methods
MT-weighted (MT-w) volumes are acquired using off-resonance pulse trains followed by spin-echo single-shot EPI readouts of slice packages (each including 12 slices), with the following sequence parameters: 48 2.5mm thick slices, resolution 2.25x2.25mm2, in-plane SENSE factor=2, TE=34ms, 30 MT pulses per train with 15ms duration and 5ms gap, TR=7700ms; acquisition time 35s for each MT-w volume.
24 MT-w volumes (with varying pulse amplitude and offset frequency, selected following protocol optimization as in5) and 12 M0 (unsaturated) volumes (for signal normalization) are acquired in 19:30minutes.
We fit the two-pool model6 to the data to estimate BPF, free and bound water T2 (T2F and T2B) and free-to-bound water exchange (kFB), following T1obs quantification from an Inversion Recovery (IR) protocol with the same EPI readout, with 12 inversion times (total acquisition time 8:30min).
MT-w and IR data are also acquired with SMS excitation (acceleration factor=2), halving the scan-time for each protocol (9:45min for SMS-MT; 4:30min for SMS-IR).
MT-w data (with and without SMS) are inherently T1-weighted. This fact is exploited to directly measure T1obs without using additional IR data. To enhance T1-weighting, slice order is shuffled across sequence repetitions. This mechanism is replicated for M0 volumes to produce the same inter-slice MT-weighting (due to 2D spin-echo), which has been shown to provide robust correction for such unwanted effects via simple image normalization5,7.
We fit numerical solutions of the two-pool equations8 to MT-w datasets, both with and without external T1obs measurement (4- and 5-parameter fits respectively).
Data from a single subject (male, 29) acquired and analysed with the above pipeline are presented here.
Results
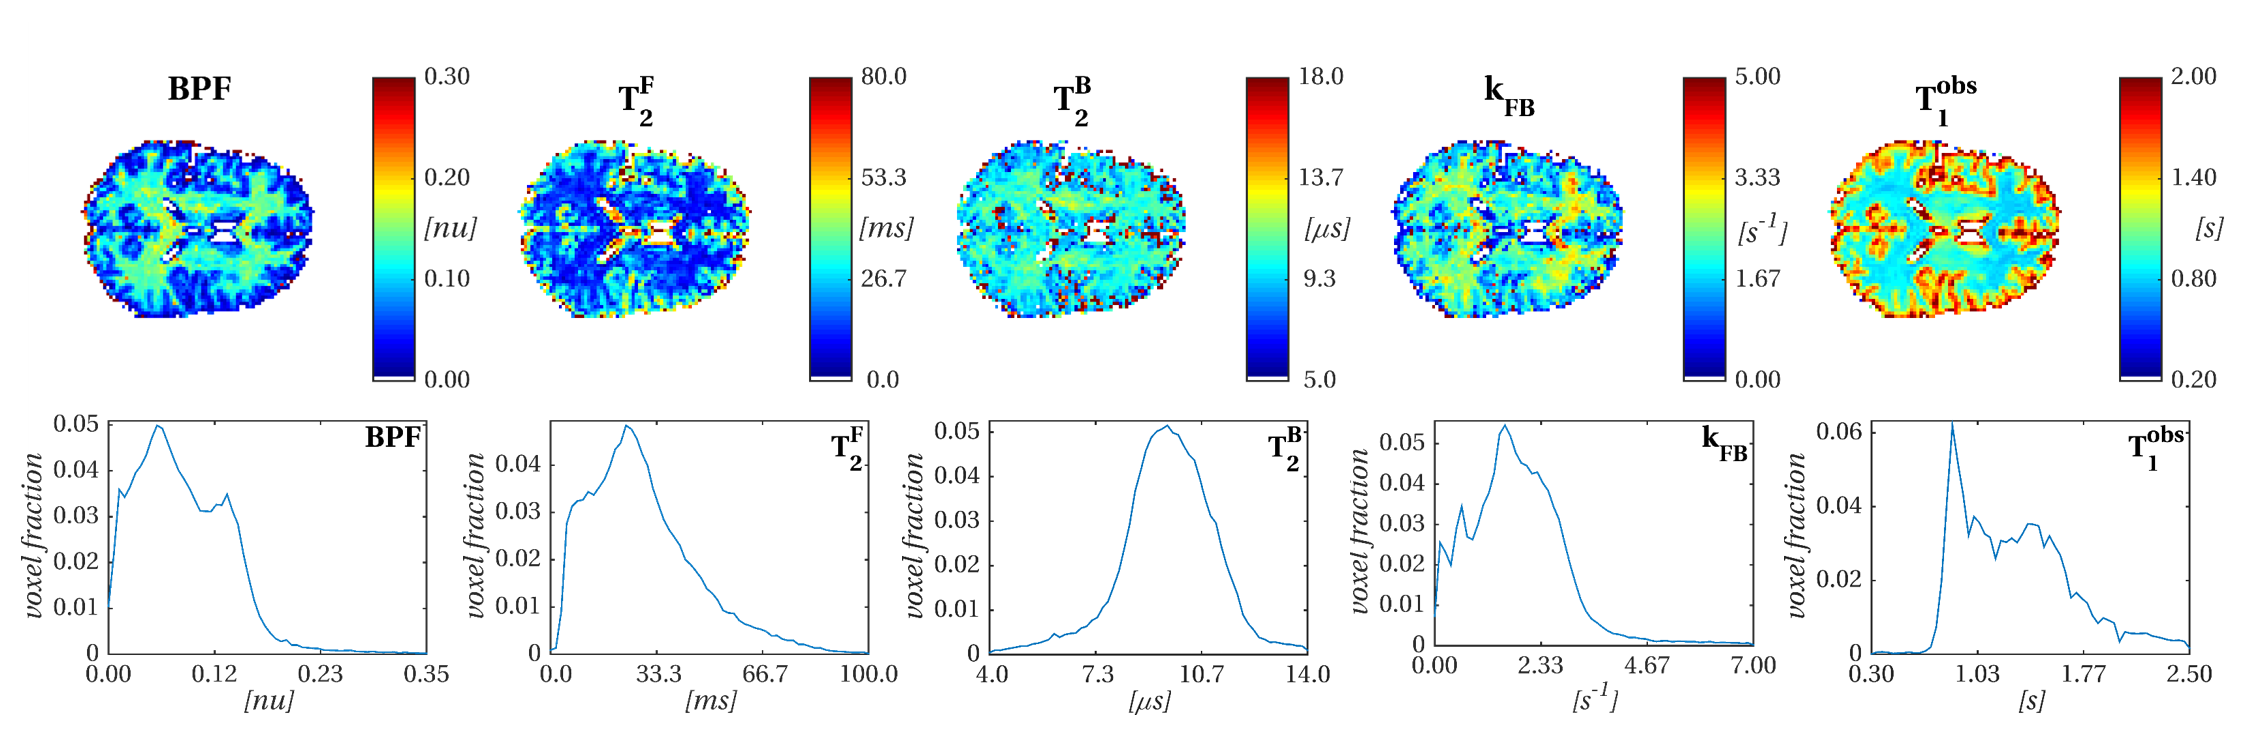
Figure 1 shows qMT model parameters and T1obs estimated with the EPI-based protocol. Parameters are in the expected range for brain tissue9,10, with BPF and kFB depicting well defined contrast between different tissues, as shown by relative parameter distributions.
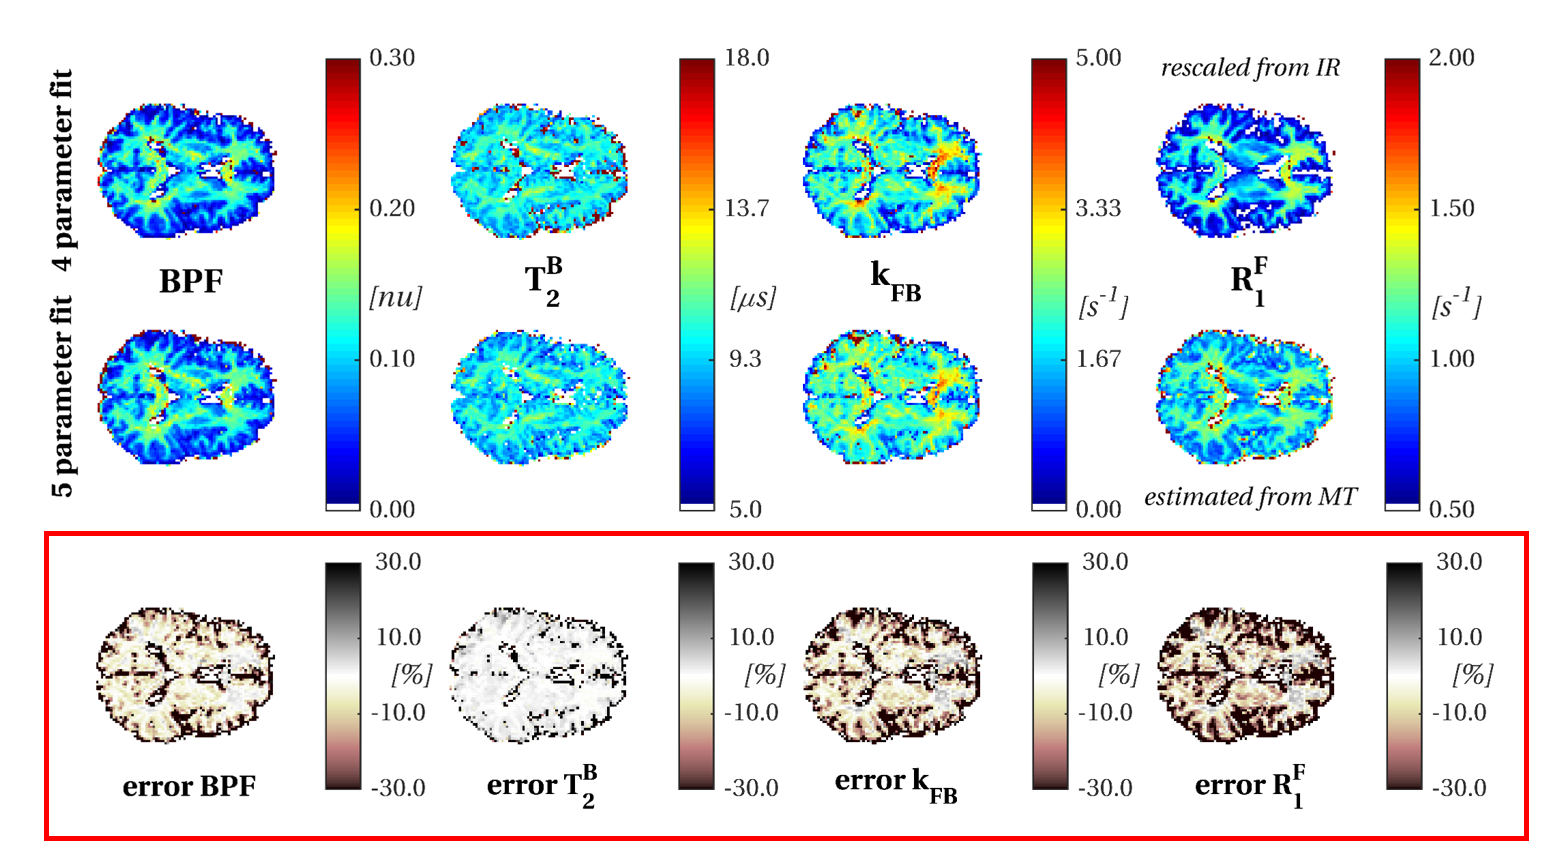
T1obs is estimated using MT-w data in a 5-parameter fit, via the relaxation rate R1F. Results are shown in figure 2 and compared with the more standard 4-parameter fit. Negligible parameter measurement bias is noticed for T2B and BPF (inter-quartiles ranges of error distributions are [-10.1%;-0.7%] and [0.3%;2.5%] respectively), however more pronounced differences are visible for kFB and R1F (inter-quartiles ranges are [-16.4%;-1%] and [-25.2%;-2.3%]).
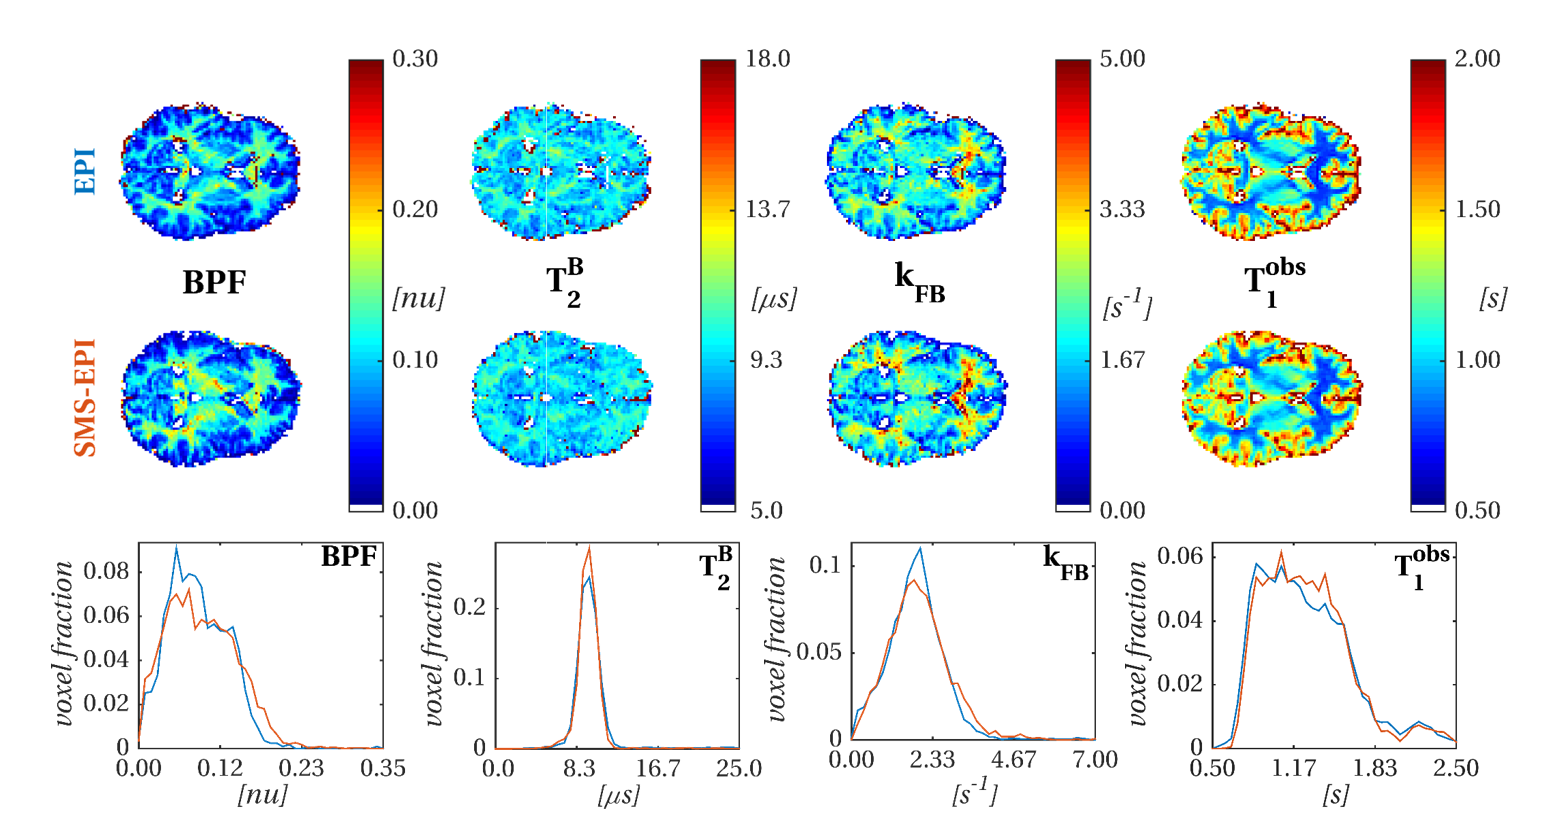
Figure 3 compares maps obtained with and without SMS acceleration. T1obs and T2B estimates are similar between the two protocols. BPF and kFB show patterns of overestimation and underestimation for short and long BPF and kFB respectively, captured also by distribution comparison. Overall contrast between tissue types appears preserved.
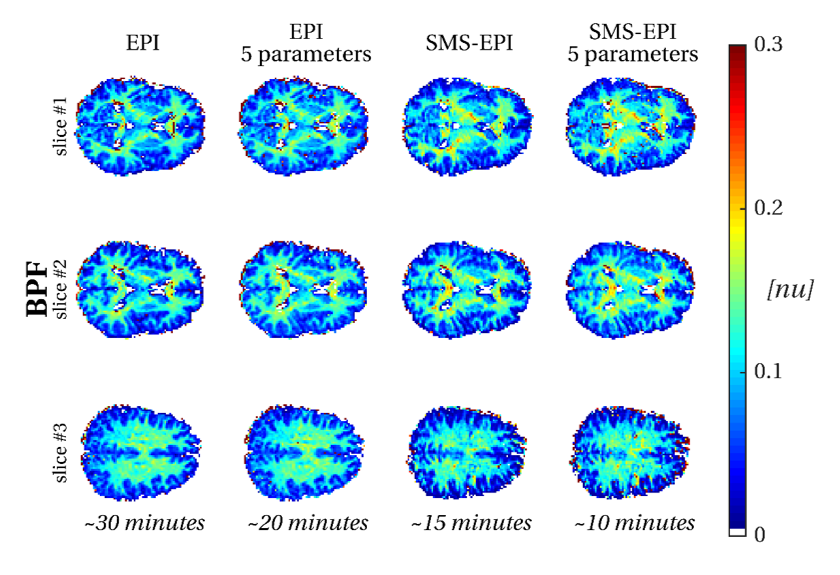
Figure 4 shows the effect of acceleration strategies on BPF estimates. Acquisition time for BPF estimation can be reduced to 10 minutes at a cost of more noisy estimates, in particular in the presence of partial volume effects with CSF.
Conclusions
We have provided preliminary results in the development of a whole-brain qMT protocol using EPI readout, a solution that remains unexplored as yet10, despite its potential for multi-contrast brain microstructure examinations11.
Acceleration strategies can be readily incorporated in the proposed protocol: (i) the non-steady-state nature of the acquisition allows the estimation of saturation and relaxation parameters simultaneously; (ii) the incorporation of SMS imaging allows for additional acceleration. Qualitatively, such strategies appear to have limited impact on BPF estimation, which is often the main qMT parameter of interest as it is thought to be sensitive to myelin content.
Further validation and investigation of these initial findings is warranted in order to elucidate the origin of the discrepancies on R1F between the 4- and 5-parameter fit and to better characterise the MT effect associated with SMS excitation. A correct formulation of such an effect would potentially enable the use of acceleration factors higher than 2, leading to even more effective scan time reductions.
Acknowledgements
UK MS Society. International Spinal Research Trust, Wings for Life and Craig H. Neilsen Foundation (INSPIRED). EPSRC (M020533; through CMIC Pump-Priming Awards). Horizon2020-EU.3.1 (ref: 634541). FP is a Guarantors of Brain non-clinical Fellow.References
[1] Odrobina E, et al. NMR Biomed 2005, 18:277-284; [2] Yarnykh V L. MRM 2012, 68:166-178; [3] Smith A K, et al. Neuroimage 2014, 95:106-116; [4] Smith A K, et al. Neuroimage clinical 2017, 16:58-65; [5] Battiston M, et al. MRM 2017, doi:10.1002/mrm.26909; [6] Henkelmann R M, et al. MRM 1993, 29:759-766; [7] Gelderen P, et al. MRM 2017, 77:2174-2185; [8] Portnoy S, et al. MRM 2007, 58:144-155; [9] Underhill H R, et al. Neuroimage 2009, 47:1568-1578; [10] Yarnykh V L, et al. Neuroimage 2004, 23:409-424; [11] Tyler D J, et al. MRM 2005, 53:103-109; [12] Campbell J SW, et al. Neuroimage 2017, doi:10.1016/j.neuroimage.2017.08.038Figures