5487
Comparison of Inhomogeneous Magnetization Transfer (ihMT) and Myelin Water Fraction (MWF) In-Vivo at 3T1Radiology, University of British Columbia, Vancouver, BC, Canada, 2UBC MRI Research Centre, University of British Columbia, Vancouver, BC, Canada, 3Physics and Astronomy, McMaster University, Hamilton, ON, Canada, 4MR Clinical Science, Philips Healthcare Canada, Markam, ON, Canada, 5ImageTech Lab, Simon Fraser University, Burnaby, BC, Canada, 6Physics and Astronomy, University of British Columbia, Vancouver, BC, Canada, 74International Collaboration on Repair Discoveries (ICORD), Vancouver, BC, Canada, 8Pathology & Laboratory Medicine, University of British Columbia, Vancouver, BC, Canada, 9International Collaboration on Repair Discoveries, University of British Columbia, Vancouver, BC, Canada
Synopsis
Inhomogeneous Magnetization Transfer (ihMT) shows promise as a myelin-specific MRI technique. Recent publications demonstrate that ihMT contrast is generated by long-lived dipolar couplings between protons on lipid molecules. We tested ihMT’s myelin specificity by comparing it to a more validated myelin measure, myelin water fraction (MWF), in 10 healthy volunteers. The ihMT ratio (ihMTR) correlated with MWF in white matter but MWF had a larger dynamic range. When MWF was zero, ihMTR was non-zero, supporting that ihMTR arises from all lipid molecules, not just those in myelin. ihMTR and MWF measure different, and complementary, aspects of tissue structure.
Introduction
Inhomogeneous Magnetization Transfer (ihMT) is a novel MR technique that has promise for myelin specificity1,2,3. ihMT employs off-resonance RF prepulses to excite the macromolecular pool1. Within the macromolecular pool, the Zeeman magnetization is attenuated by an amount that depends on the prepulse details and the presence of a long-lived dipolar reservoir4,5. This Zeeman magnetization is then transferred to the aqueous pool via proton cross-relaxation or chemical exchange, which attenuates the MRI signal and increases the image contrast6. Dipolar couplings between protons in lipid hydrocarbon chains, such as those found in myelin, should be sensitive to the ihMT effect. However, there are other sources of lipids in brain tissue besides myelin, for example glial cells and unmyelinated axons, which therefore also contribute to ihMT.
To quantify the ihMT effect, five MR images are required: a reference image (R) with no saturation, two images one with positive (M+) and one with negative (M-) prepulse saturation, two images with dual prepulse saturation using alternating off-resonance pulses. The two alternating pulse scans changed the sign of the leading pulse (M+- , M-+). The ihMT ratio (ihMTR)1 = (M+ + M- - M+- - M-+)/2R has been proposed as a myelin measure.
An alternative, more widely applied and histopathologically validated marker for myelin7, myelin water fraction (MWF8), arises from the water trapped within the myelin bilayers.
The goal of this study was to compare MWF and ihMTR in regions of white matter (WM) and grey matter (GM) in healthy controls.
Methods
Subjects: 10 healthy controls (3 males, 7 females, mean age=23.5y (range: 20-38y)).
MR Experiments: Imaging was performed on a 3T Philips Achieva MR (Philips Healthcare, Best, The Netherlands) using an 8 channel head coil. The following sequences were acquired: (1) ihMT (gradient echo, TR/TE=130/3.5ms, flip angle = 20°, resolution = 1x2x2.5mm3, 40 slices, FOV=230x190mm2, prepulse: twelve 0.9ms Hanning pulses with interpulse intervals of 0.6ms, frequency offset 7kHz)2; (2) MWF (48 echo GRASE, TR/TE=1073/8ms, ΔTE=8ms, resolution identical to ihMT)9; (3) 3DT1 (MPRAGE, TR/TE/TI=3000/3.6/984ms, resolution = 1x1x1mm3, FOV = 256x256mm2).
Analysis:
ihMT: Gaussian filtering was applied to the raw ihMT data to minimize truncation artifact. Scans were registered to each other using Statistical Parametric Mapping software10, and light bias regularization was applied (0.1%). A voxel-wise ihMTR map was calculated, as was a traditional MTR map = (R - M+) / R.
MWF: Voxel-wise T2 decay curves were analyzed using non-negative least squares, with stimulated echo correction and flip angle optimization11,12. MWF maps were calculated from the T2 distributions as the signal <40ms divided by the total signal8.
Registration: The first GRASE echo and 3DT1 were registered to one of the ihMT dual images for each volunteer using FMRIB’s Linear Registration Tool (FLIRT)13,14. The transformation matrix was then applied to the MWF map.
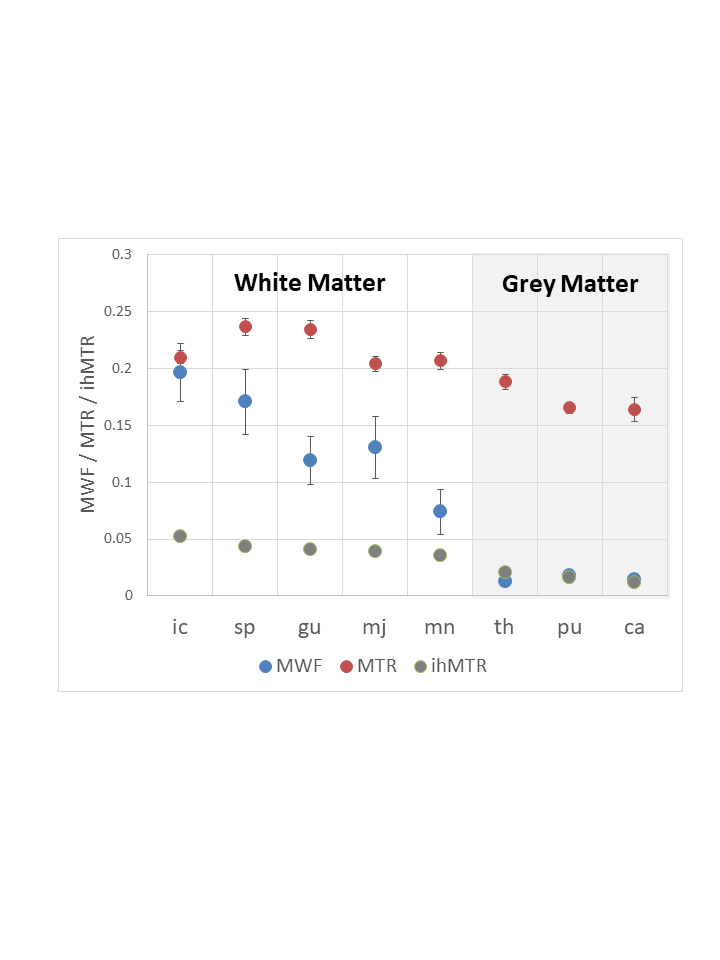
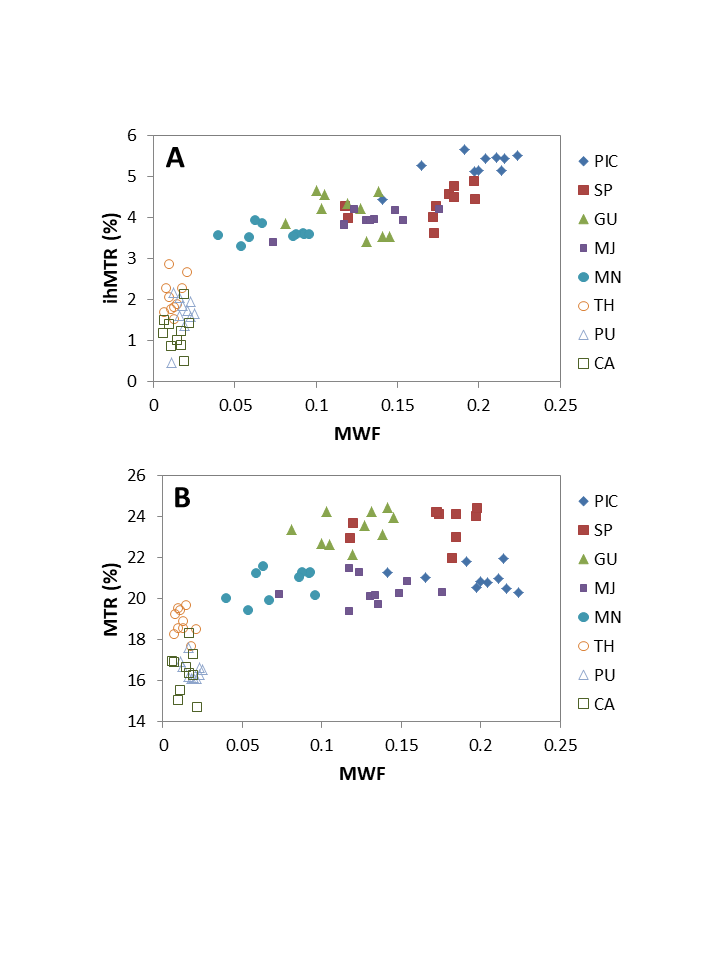
Regions of interest (ROIs): WM and GM masks were generated from each volunteer’s 3DT1 using FAST (FMRIB Automated Segmentation Tool)15, and then thresholded at 99.0%. ROIs were manually drawn in WM structures (posterior internal capsule (PIC), splenium of the corpus callosum (SP), genu of the corpus callosum (GU), major forceps (MJ), minor forceps (MN)) and GM structures (thalamus (TH), putamen (PU), caudate (CA)). Masks and ROIs were mapped to registered MWF, ihMTR and MTR maps to determine means and histograms.
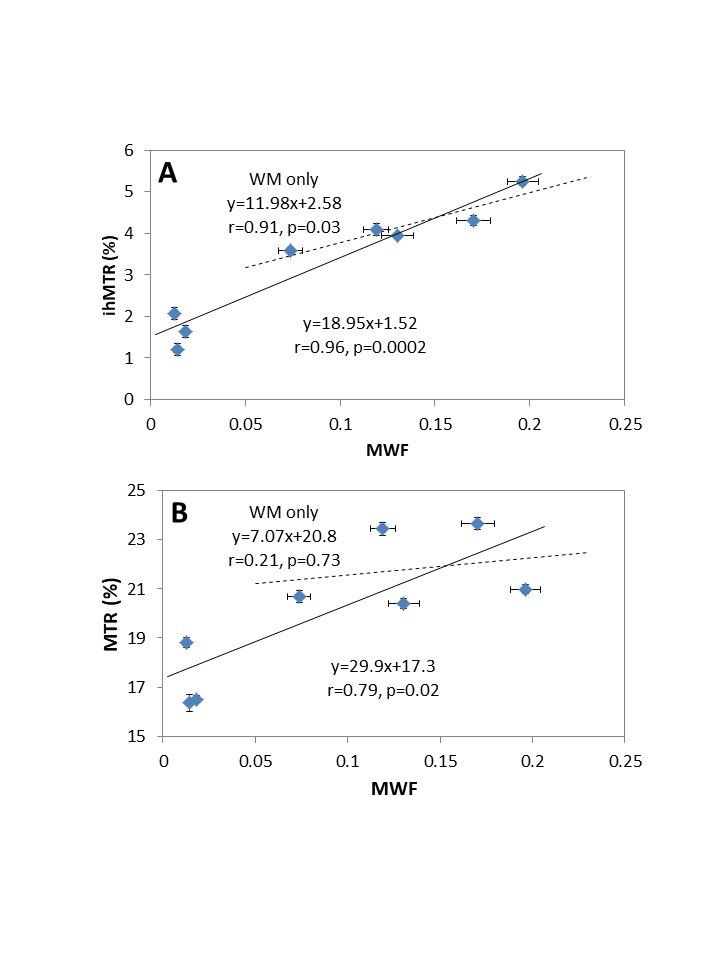
Statistics: Pearson correlations examined relationships between MWF/ihMTR and MWF/MTR.
Results and Discussion
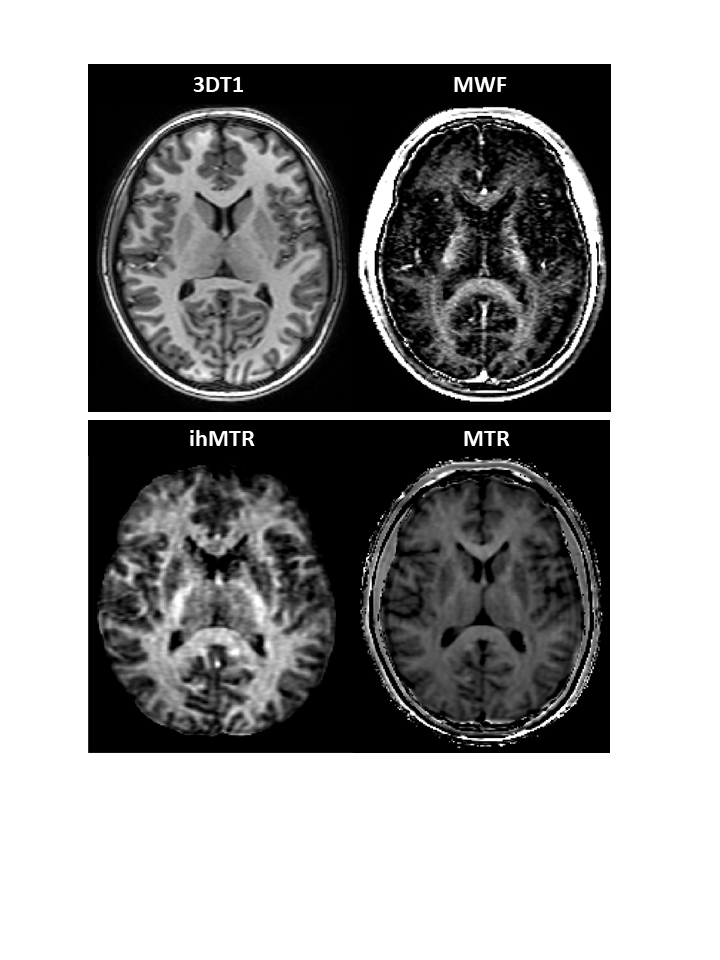
Representative MWF, ihMTR and MTR images from one volunteer demonstrate WM intensity variations for MWF and ihMTR while MTR appears uniform (Figure 1). MWF had large variations between different structures, while ihMTR and MTR varied less (Figure 2). ihMTR and MWF from WM and GM agreed with existing literature3,16.
The relationship between MWF and ihMTR or MTR is shown in Figure 3 for each ROI. The linear correlation between the techniques is shown in Figure 4. When MWF is zero, there is a non-zero ihMTR, supporting the concept that ihMTR arises from all lipid molecules in the brain, not just those in myelin. MTR has an even larger intercept indicating that the total MT signal arises from all macromolecular protons.
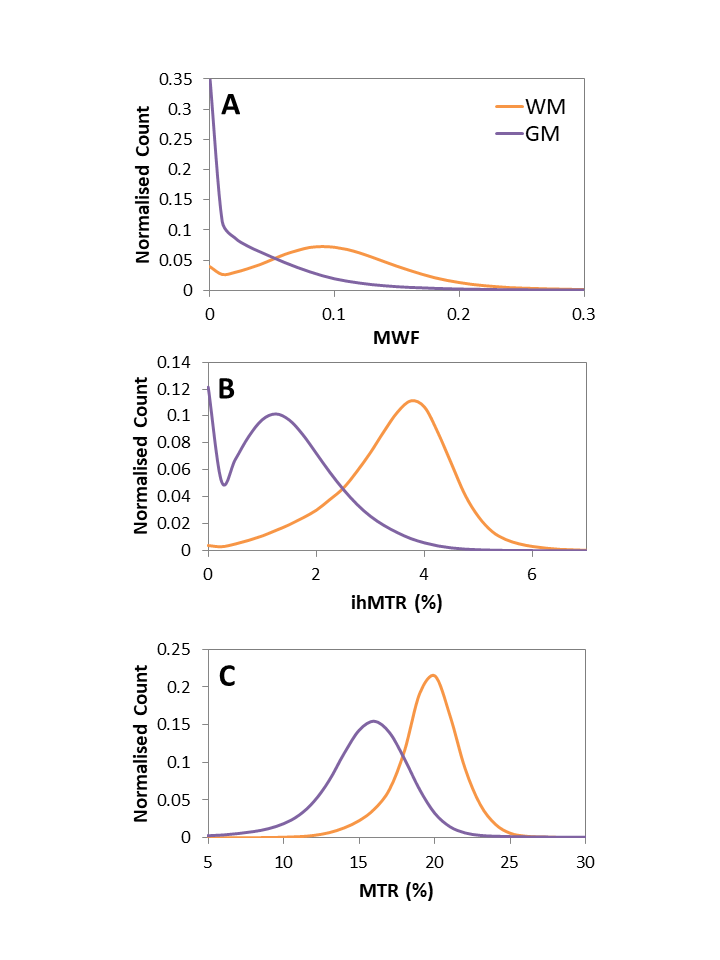
WM and GM histograms for each technique show shape differences, indicating that each technique offers complimentary information (Figure 5).
Conclusion
The preliminary results from this study suggest that inhomogeneous magnetization transfer contrast is caused by all molecules with long-lived dipolar order rather than exclusively signal from myelin lipids. ihMTR and MWF measure different, but complementary, aspects of tissue structure.Acknowledgements
Thank you to the volunteers and the technologists. This study was supported by NSERC (ALM). AS and ML were supported by NSERC Undergraduate Student Research Awards. CL holds operating grants from the MS Society of Canada and NSERC.References
1. Varma G., Alsop D.C., Duhamel G., et al. Magnetization Transfer from Inhomogeneously Broadened Lines: A Potential Marker for Myelin. Magn. Reson. Med. 2015; 73: 614–622.
2. Varma G., Grant A. K., Alsop D.C., et al. In Vivo Measurement of a New Source of Contrast, the Dipolar Relaxation Time, T1D, Using a Modified Inhomogeneous Magnetization Transfer (ihMT) Sequence. Magn. Reson. Med. 2016; 78: 1362–1372.
3. Girard O.M., Prevost V.H., Varma G., et al. Magnetization transfer from inhomogeneously broadened lines (ihMT): Experimental optimization of saturation parameters for human brain imaging at 1.5 Tesla. Magn. Reson. Med. 2015; 73: 2111–2121. 4. Manning A.P., Chang K.L., Michal C.A., et al. The physical mechanism of ‘‘inhomogeneous” magnetization transfer MRI. J. Magn. Reson. 2017; 274: 125-136.
5. G. Varma, O. Girard, V. Prevost, A. Grant, G. Duhamel, D. Alsop, Interpretation of magnetization transfer from inhomogeneously broadened lines (ihMT) in tissues as a dipolar order effect within motion restricted molecules, J. Magn. Reson. 260 (2015) 67–76.
6. Prevost V. H., Girard O. M., Mchinda S., et al. Optimization of inhomogeneous magnetization transfer (ihMT) MRI contrast for preclinical studies using dipolar relaxation time (T1D) filtering. NMR Biomed. 2017; 30(6): e3706.
7. Laule C., Kozlowski P., Li D. K. B., et al. Myelin water imaging of multiple sclerosis at 7 T: Correlations with histopathology. NeuroImage. 2008; 40(4): 1575-1580.
8. Mackay A. and Laule C. Magnetic Resonance of Myelin Water: An in vivo Marker for Myelin. 2016; Brain Plasticity. 2016; 2(1): 71-91.
9. Zhang J, Vavasour I, Kolind S, et al. Advanced Myelin Water Imaging Techniques for Rapid Data Acquisition and Long T2 Component Measurements. ISMRM 2015; p824.
10. Friston, K. Statistical Parametric Mapping. Wellcome Trust Centre for Neuroimaging, University College London. 2016.
11. Prasloski T, Mädler B, Xiang Q-S, et al. Applications of stimulated echo correction to multicomponent T2 analysis. Magn Reson Med 2012; 67: 1803–1814.
12. Whittall KP and MacKay AL. Quantitative interpretation of NMR relaxation data. J Magn Reson 1989; 84: 134–152.
13. M. Jenkinson, P.R. Bannister, J.M. Brady, and S.M. Smith. Improved optimisation for the robust and accurate linear registration and motion correction of brain images. NeuroImage, 17(2):825-841, 2002.
14. Greve, D.N. and Fischl, B. Accurate and robust brain image alignment using boundary-based registration. NeuroImage, 48(1):63-72, 2009.
15. Zhang Y., Brady M. and Smith S. Segmentation of brain MR images through a hidden Markov random field model and the expectation-maximization algorithm. IEEE Trans Med Imag, 20(1):45-57, 2001.
16. Laule, C., Vavasour, I.M., Moore, G.R.W., Oger, J., Li, D.K.B., Paty, D.W., MacKay, A.L., 2004. Water content and myelin water fraction in multiple sclerosis: A T 2 relaxation study. J. Neurol. 251, 284–293.
Figures