5486
On the sensitivity of T1 mapping methods to myelin1Radiological Physics, University Hospital Basel, Basel, Switzerland, 2Department of Biomedical Engineering, University of Basel, Basel, Switzerland, 3Advanced Clinical Imaging Technology (HC CMEA SUI DI BM PI), Siemens Healthineers, Lausanne, Switzerland, 4Department of Radiology, University Hospital (CHUV), Lausanne, Switzerland, 5LTS5, École Polytechnique Fédérale de Lausanne, Lausanne, Switzerland
Synopsis
For homogeneous and isotropic probes, different MR relaxometry methods are expected to yield consistent results. For tissues, however, wide-spread T1 and T2 relaxation times are reported in the literature. Especially in the brain, we hypothesize that the microstructure, e.g. the presence of myelin, affects the apparent observed T1, as assessed by different imaging sequences. As a result, apparent differences in T1 might reflect valuable information on the underlying tissue microstructure, such as myelination.
Purpose
Evaluate the sensitivity of current T1 mapping methods to tissue microstructure, such as myelin content, in the human brain.Introduction
For homogeneous and isotropic probes, such as doped aqueous phantoms, different MR relaxometry methods are expected to yield consistent results. For tissues, however, this assumption is more than questionable due to the underlying microstructure; corroborated by the wide-spread T1 and T2 relaxation times found in the literature 1. Especially in the brain, we hypothesize that the presence of myelin, which supposedly leads to an asymmetric intra-voxel frequency distribution, affects the apparent observed T1, as assessed by different imaging sequences. Whereas spin-echo (SE) and spoiled gradient-echo (SPGR) methods should be rather frequency inert, balanced steady state free precession (bSSFP) revealed tissue-dependent asymmetries in its frequency response profile 2,3, leading to apparent low T1 times for MIRACLE 4.Materials & Methods
A healthy volunteer and a manganese-doped spherical water probe were scanned at 3T (MAGNETOM Prisma, Siemens Healthcare, Erlangen, Germany) using multiple T1 mapping protocols: multi-slice Inversion-Recovery Turbo-Spin Echo (IR-TSE), a variable flip angle (VFA) SPGR approach 5, and a configuration-based approach, termed MIRACLE 4. MIRACLE and VFA acquisitions were performed in 3D in sagittal orientation with a resolution of 1.3x1.3x1.3mm3 (192x192x160 matrix). For SPGR, a TR/TE of 7.00ms/2.86ms, and three FA of 4°, 9°, 15° were used, whereas for MIRACLE twelve phase-cycled bSSFP scans with a TR/TE of 4.88ms /2.44ms and a FA of 15° were performed. IR-TSE acquisitions were conducted with 1.3x1.3mm2 (192x160 matrix, 30 slices, 2.6mm slice thickness, 100% slice distance) with inversion times TI of [200, 600, 800, 1500, 3000] ms and a TR/TE of 5000ms+TI/13ms. B1 mapping was performed with B1-TRAP 6. Overall, IR-TSE took about 30min, VFA was completed within 6min and the MIRACLE scan lasted 13min.
Mono-exponential T1 was estimated from IR-TSE using non-linear least-squares fitting, whereas apparent T1 from VFA SPGR was derived using a linear regression of the linearized signal model 5 and from bSSFP using an iterative golden section search based on SSFP configuration ratios 4. MIRACLE and VFA T1 values were corrected for B1 inhomogeneity.
Results & Discussion
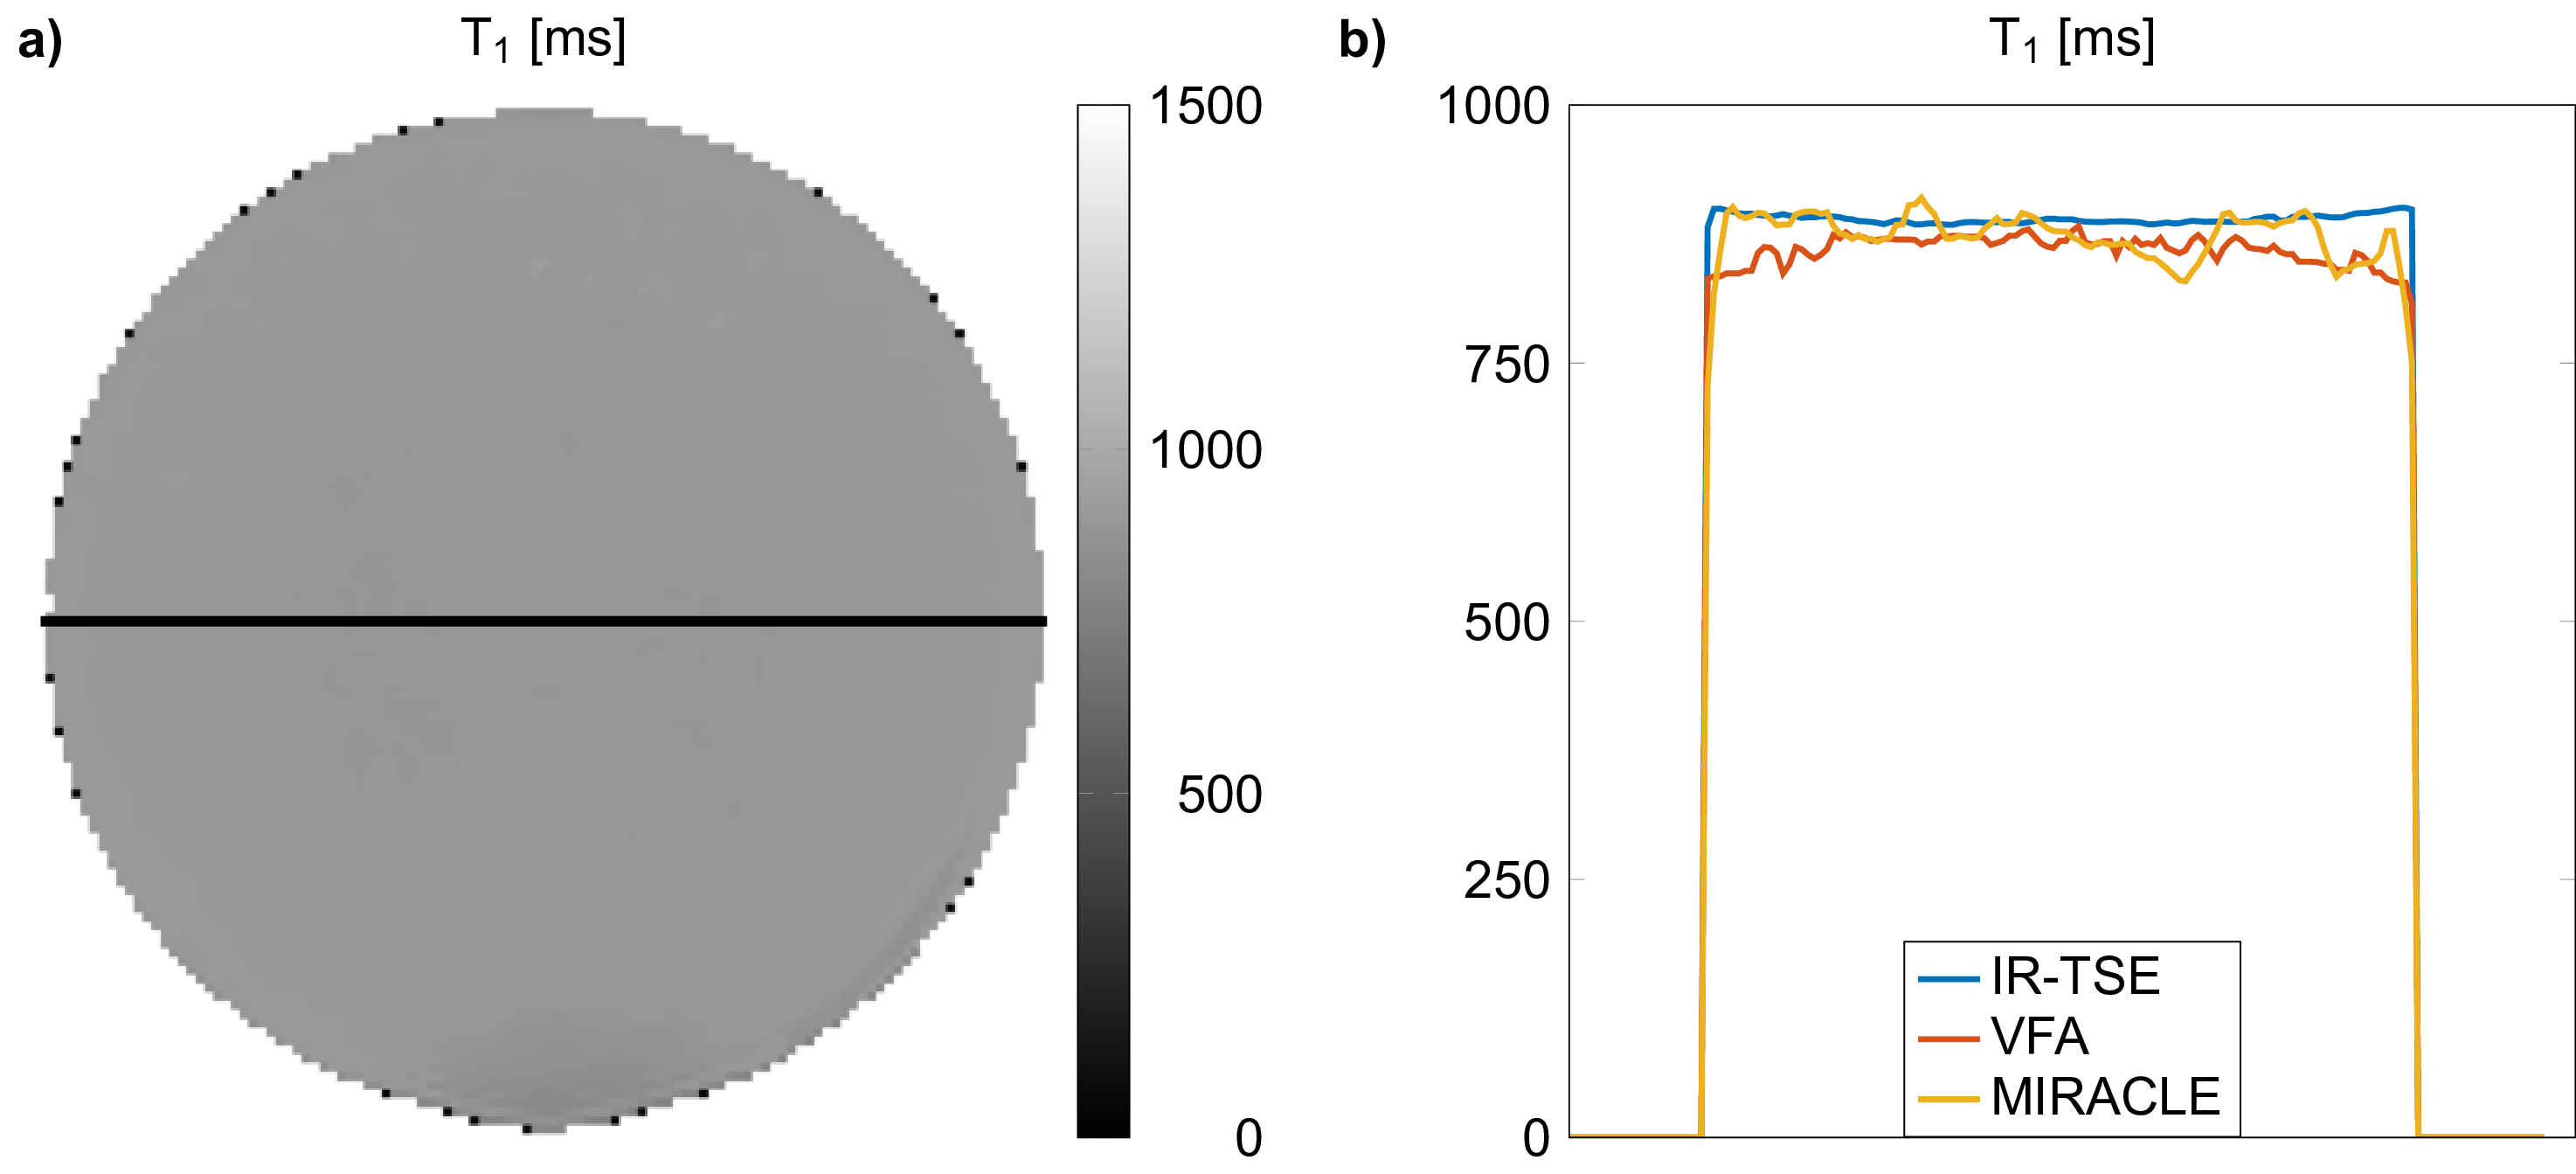
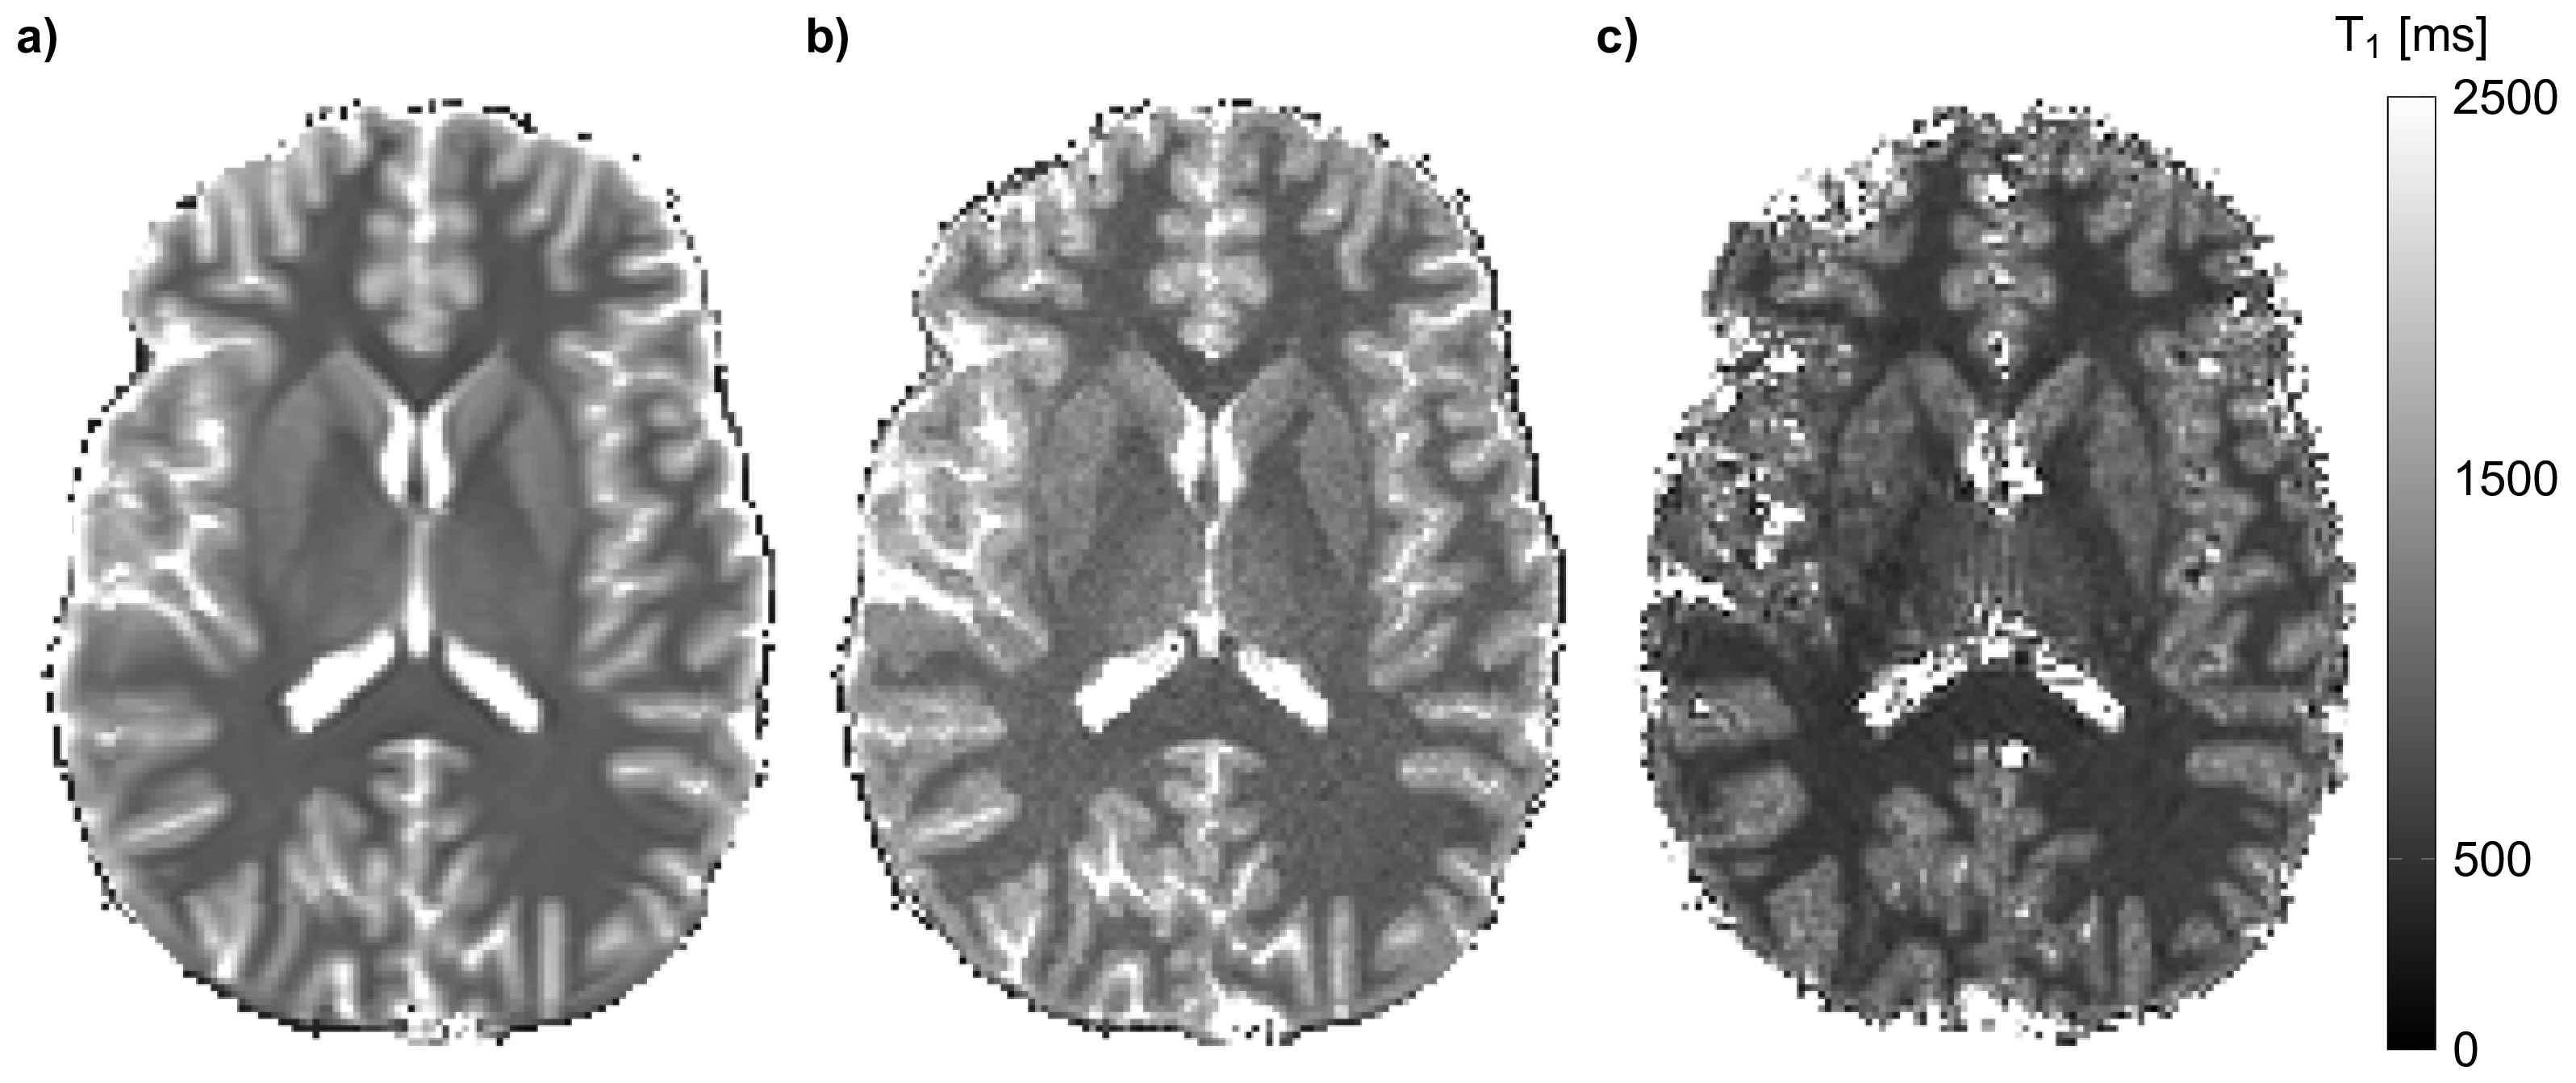
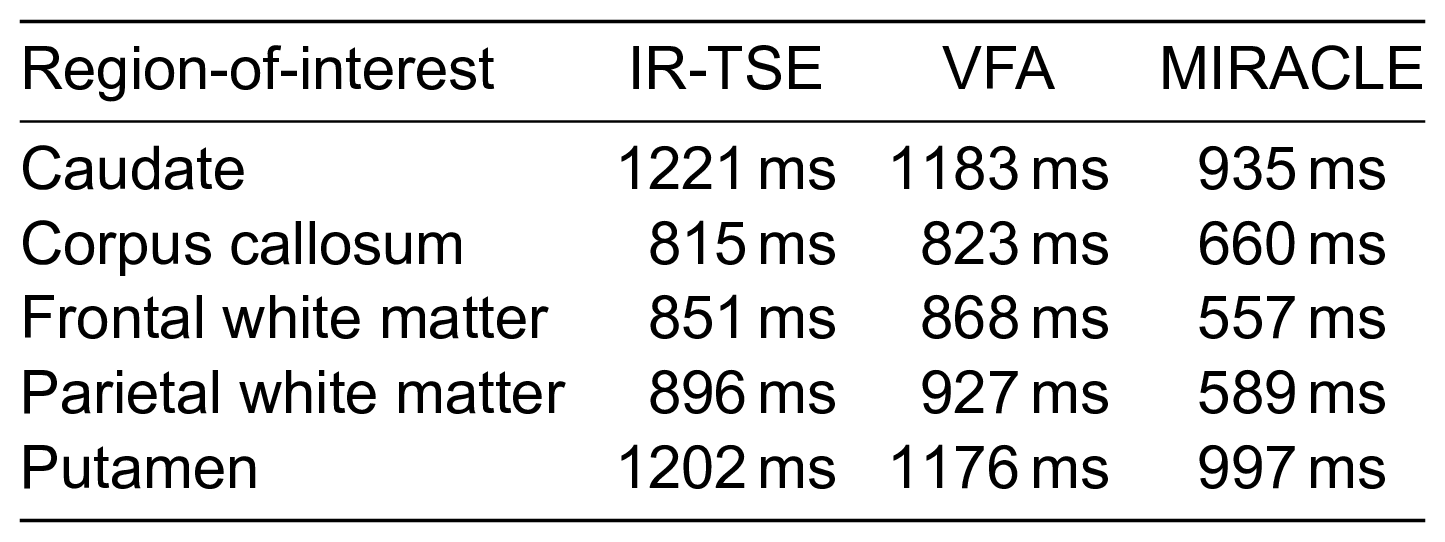
As expected, T1 values matched for all investigated relaxometry methods in the phantom experiment (cf. Fig. 1). In the brain, B1-corrected T1 values of the VFA method were in very good agreement with the mono-exponential T1 analysis using reference 2D IR-TSE imaging (cf. Table 1, cf. Fig. 2). This is in contrast to the T1 values retrieved by MIRACLE: apparent MIRACLE-T1 values were considerably lower (cf. Table 1, cf. Fig. 2).
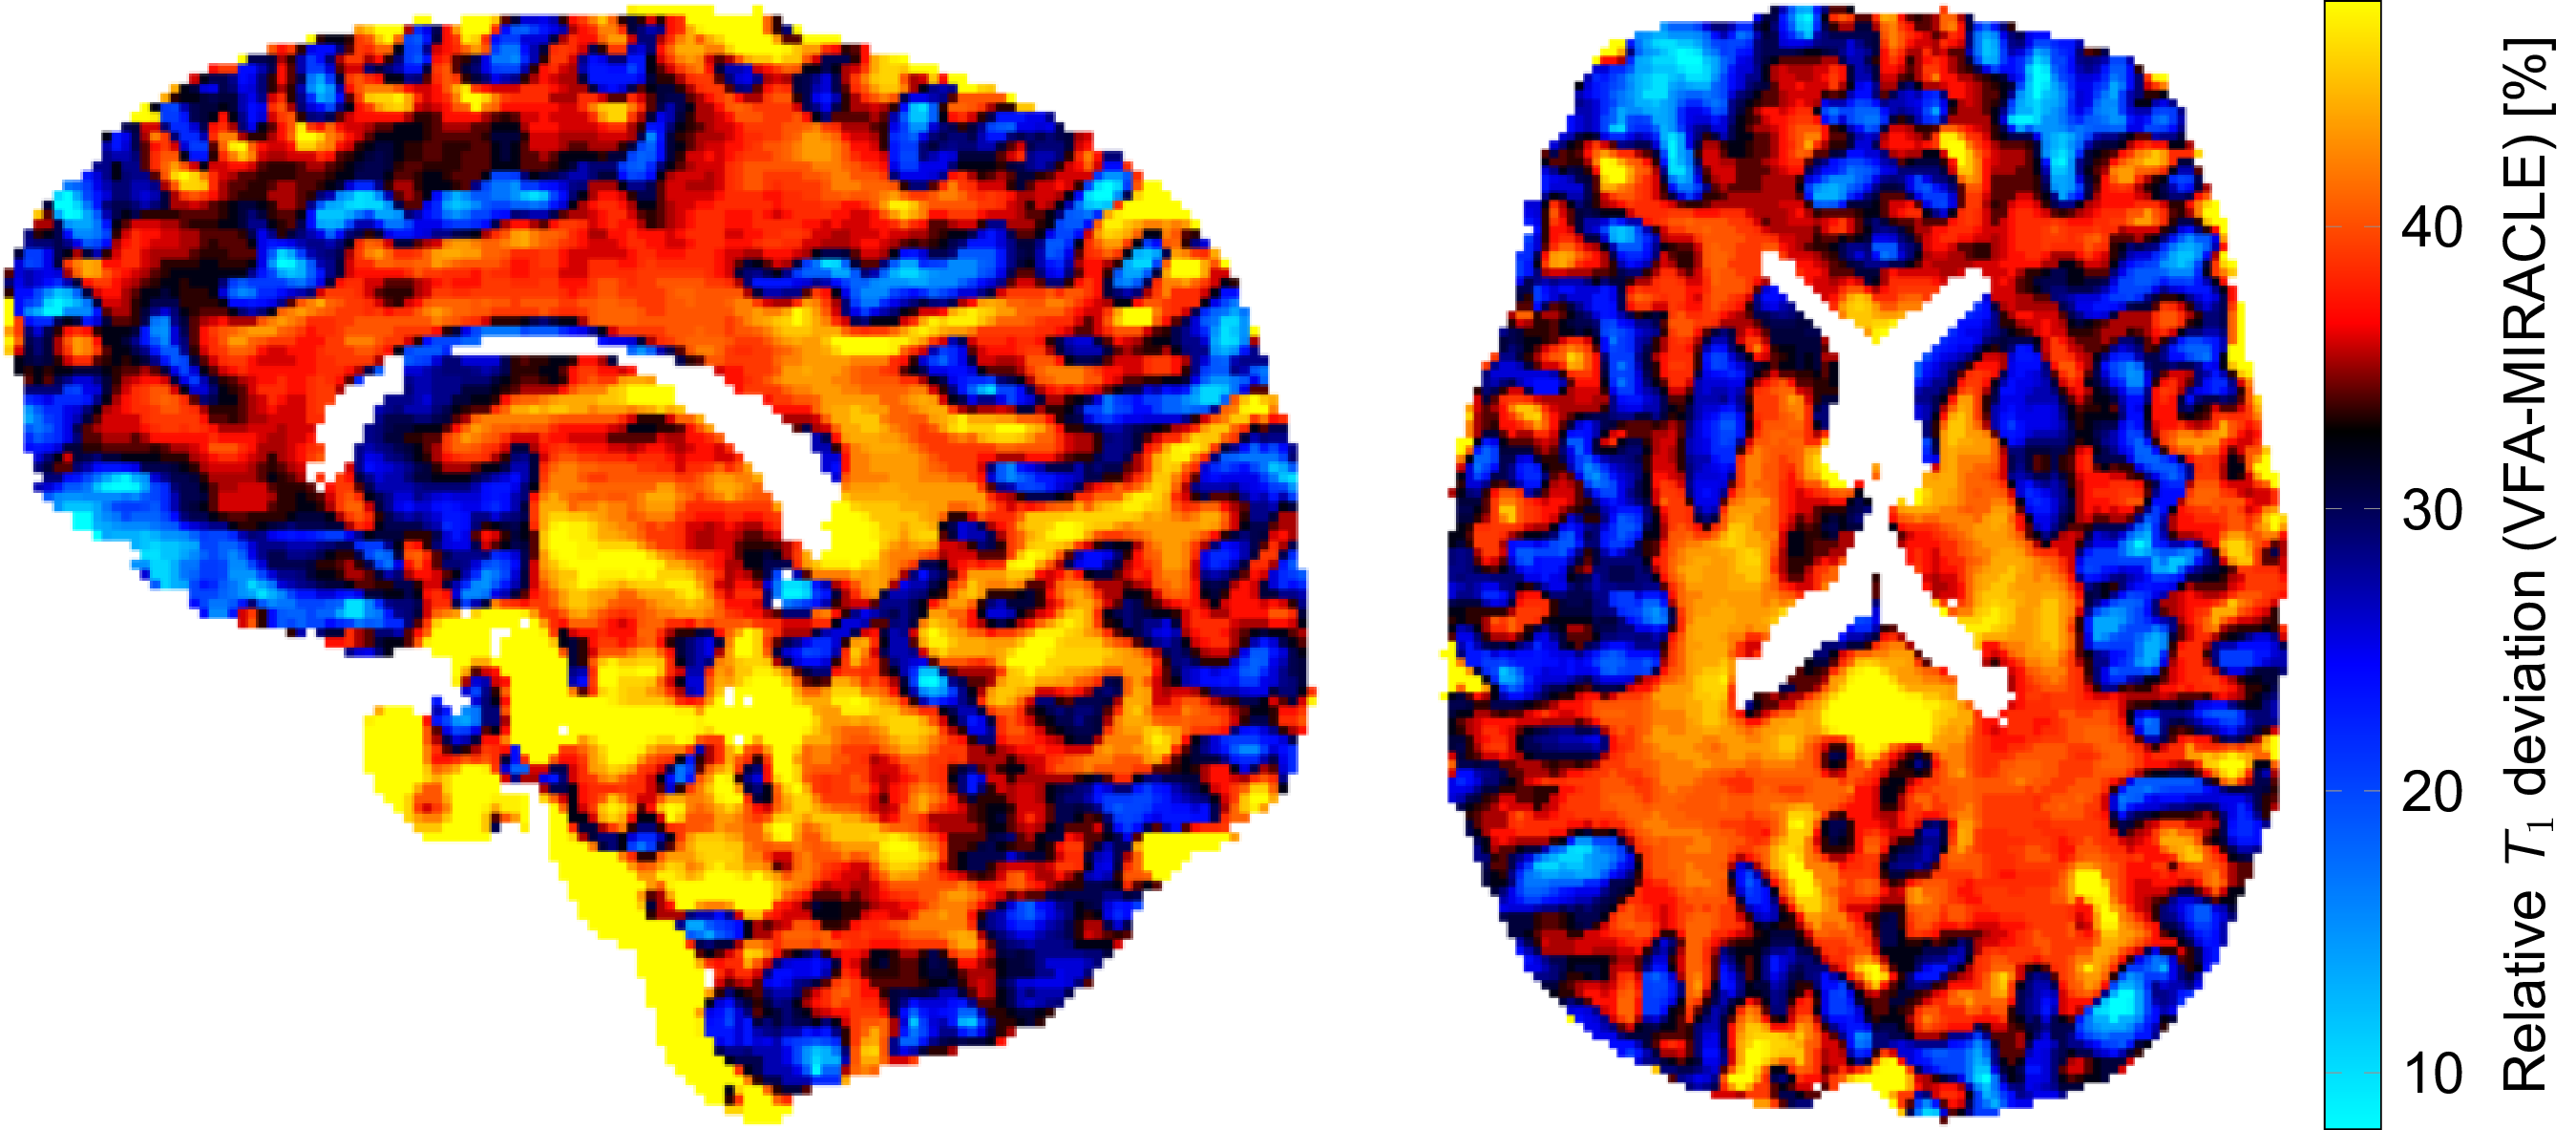
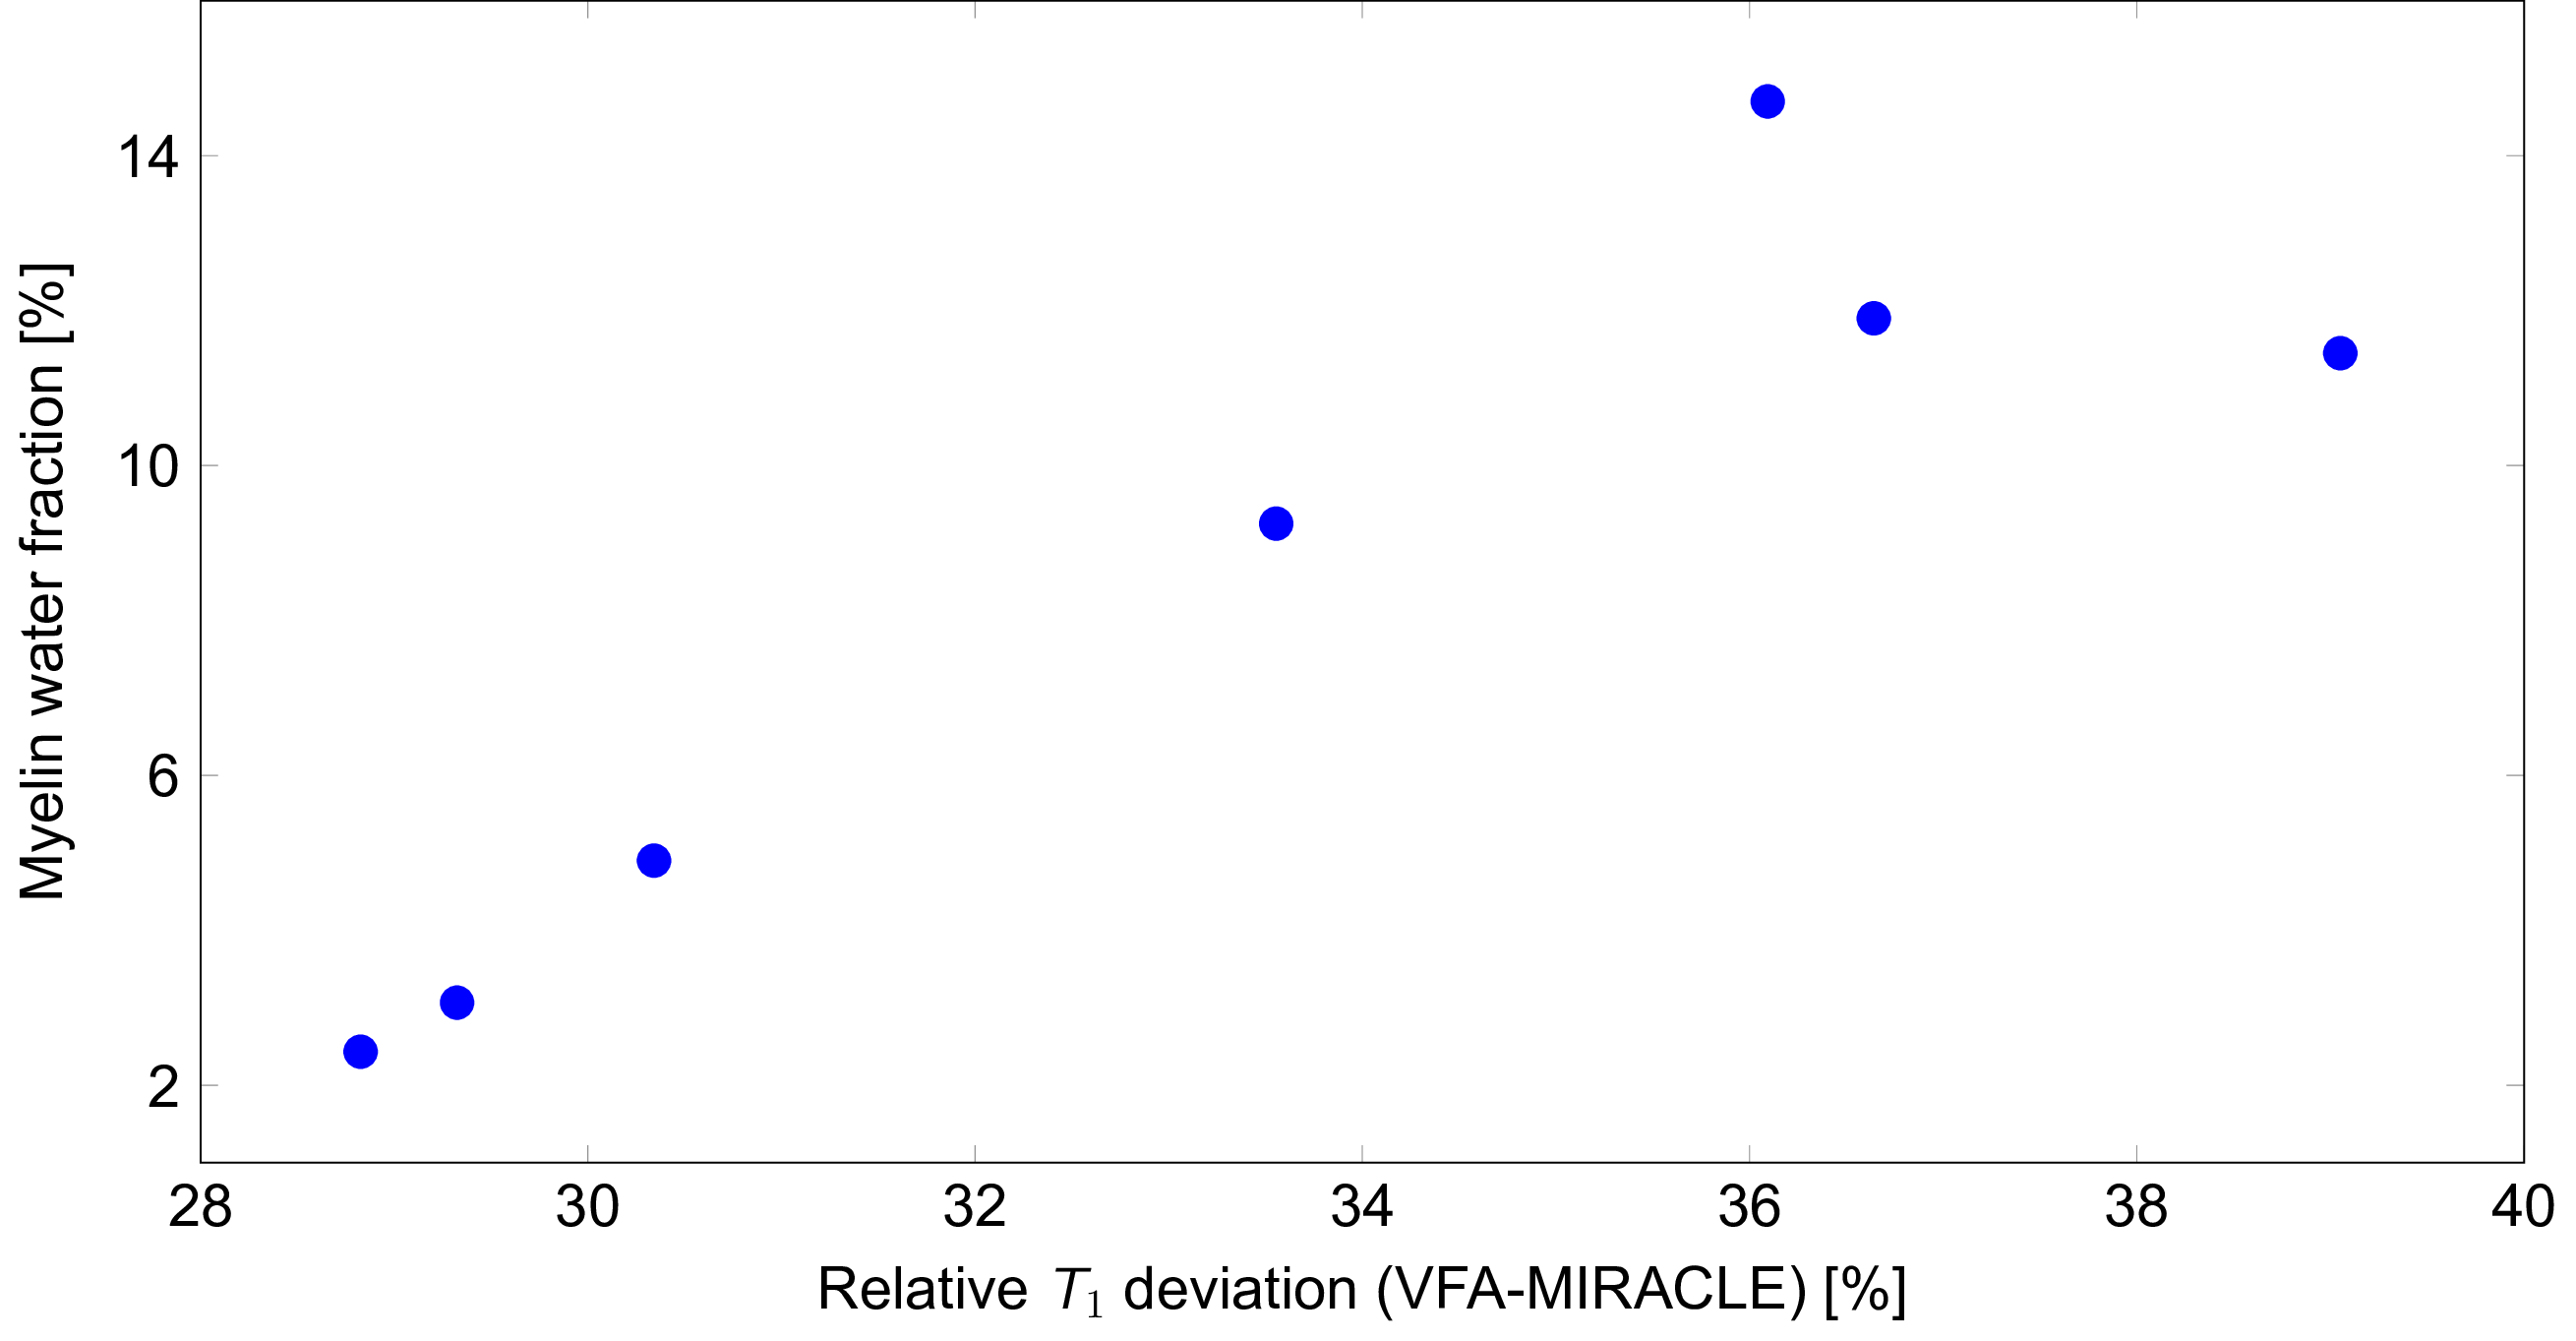
Figure 3 shows the relative deviation, $$$\Delta T_1 = \left\lvert T_{1\,{\rm MIRACLE}} - T_{1\,{\rm VFA}}\right\rvert / T_{1\,{\rm VFA}}$$$, between MIRACLE-T1 and VFA-T1 for an exemplary transversal and sagittal slice in the brain, revealing a pronounced white matter pattern. Since we hypothesized that the frequency-related asymmetry in the bSSFP profile is not only the origin of the observed deviation but should also relate to myelin, a correlation analysis between the myelin water fraction (MFW) and the ΔT1 was performed (cf. Fig. 4). MWF values for different brain regions (caudate, corpus callosum, major and minor forceps, putamen, thalamus) were taken from the literature 7-9, whereas ΔT1 values were extracted for corresponding regions from the measured data (cf. Fig. 3). A very significant ($$$p$$$ = 0.004) and high correlation of 0.91 between the MWF and the apparent deviation in T1 (ΔT1) is found. Overall our findings corroborate the expected variable sensitivity of different MR T1 relaxometry methods to the underlying tissue microstructure. Interestingly, the apparent deviation in the T1 between VFA and MIRACLE shows a strong correlation to the MWF, and thus might be a fast and reliable marker for myelination.
Conclusion
In tissues, different MR relaxometry methods can yield considerably different results due to the underlying microstructure. For the brain, the deviation in T1 between spoiled and balanced gradient-echo shows a marked correlation with the myelin water fraction and might thus represent a sensitive and valuable biomarker for myelination and de-myelination processes in the brain.Acknowledgements
No acknowledgement found.References
- J. Z. Bojorquez et al., MRI 35 (2017) 69-80
- K. Miller, MRM 63 (2010) 385-395
- K. Miller, MRM 63 (2010) 396-406
- D. Nguyen et al., MRM 78 (2017) 518-526
- S. C. L. Deoni et al., MRM 49 (2003) 515–526
- C. Ganter et al., MRM 70 (2013) 1515-1523
- T. D. Nguyen et al., MRM 67 (2012) 614-621
- S. M. Meyers et al., MRI 37 (2017) 187-194
- T. D. Nguyen et al., MRI 39 (2017) 82-88
Figures