5484
Multivariate Pattern Analysis of fMRI Data using Deep Neural Network1Institute of Biomedical Engineering, National Chiao Tung University, Hsinchu city, Taiwan, 2Department of Computer Science, National Chiao Tung University, Hsinchu city, Taiwan, 3Institute of Brain Science, National Yang-Ming University, Taipei city, Taiwan, 4Integrated Brain Research Unit, Department of Medical Research, Taipei Veterans General Hospital, Taipei city, Taiwan, 5Institute of Biomedical Informatics, National Yang-Ming University, Taipei city, Taiwan
Synopsis
This paper presents a novel MVPA method based on deep neural networks, which can identify a group of voxels with their pattern of activity capable of differentiating experimental conditions. Through the forward inference procedure, the proposed deep neural network can also be applied to distinguish brain imaging data of different experimental conditions. Our experimental results suggest that deep neural networks are of great potential as an MVPA tool for functional brain mapping.
Introduction
Multivariate pattern analysis (MVPA)1 has been widely used to reveal condition-related information embedded in the spatial patterns of cortical activity. Compared to univariate approaches, multivariate methods combine signals from all voxels within regions of interest and thus improve the statistical power. In this work, we propose a novel MVPA method based on deep neural networks, which recently receive intense attentions in many research fields. By identifying a group of voxels with discriminative capability using a nonlinear modeling approach, the proposed method can obtain a global functional map representing the information carried by the spatial pattern of activity within the whole brain. We applied this method to analyze a set of functional magnetic resonance imaging (fMRI) data and the results demonstrated the feasibility of the proposed method.Materials and methods
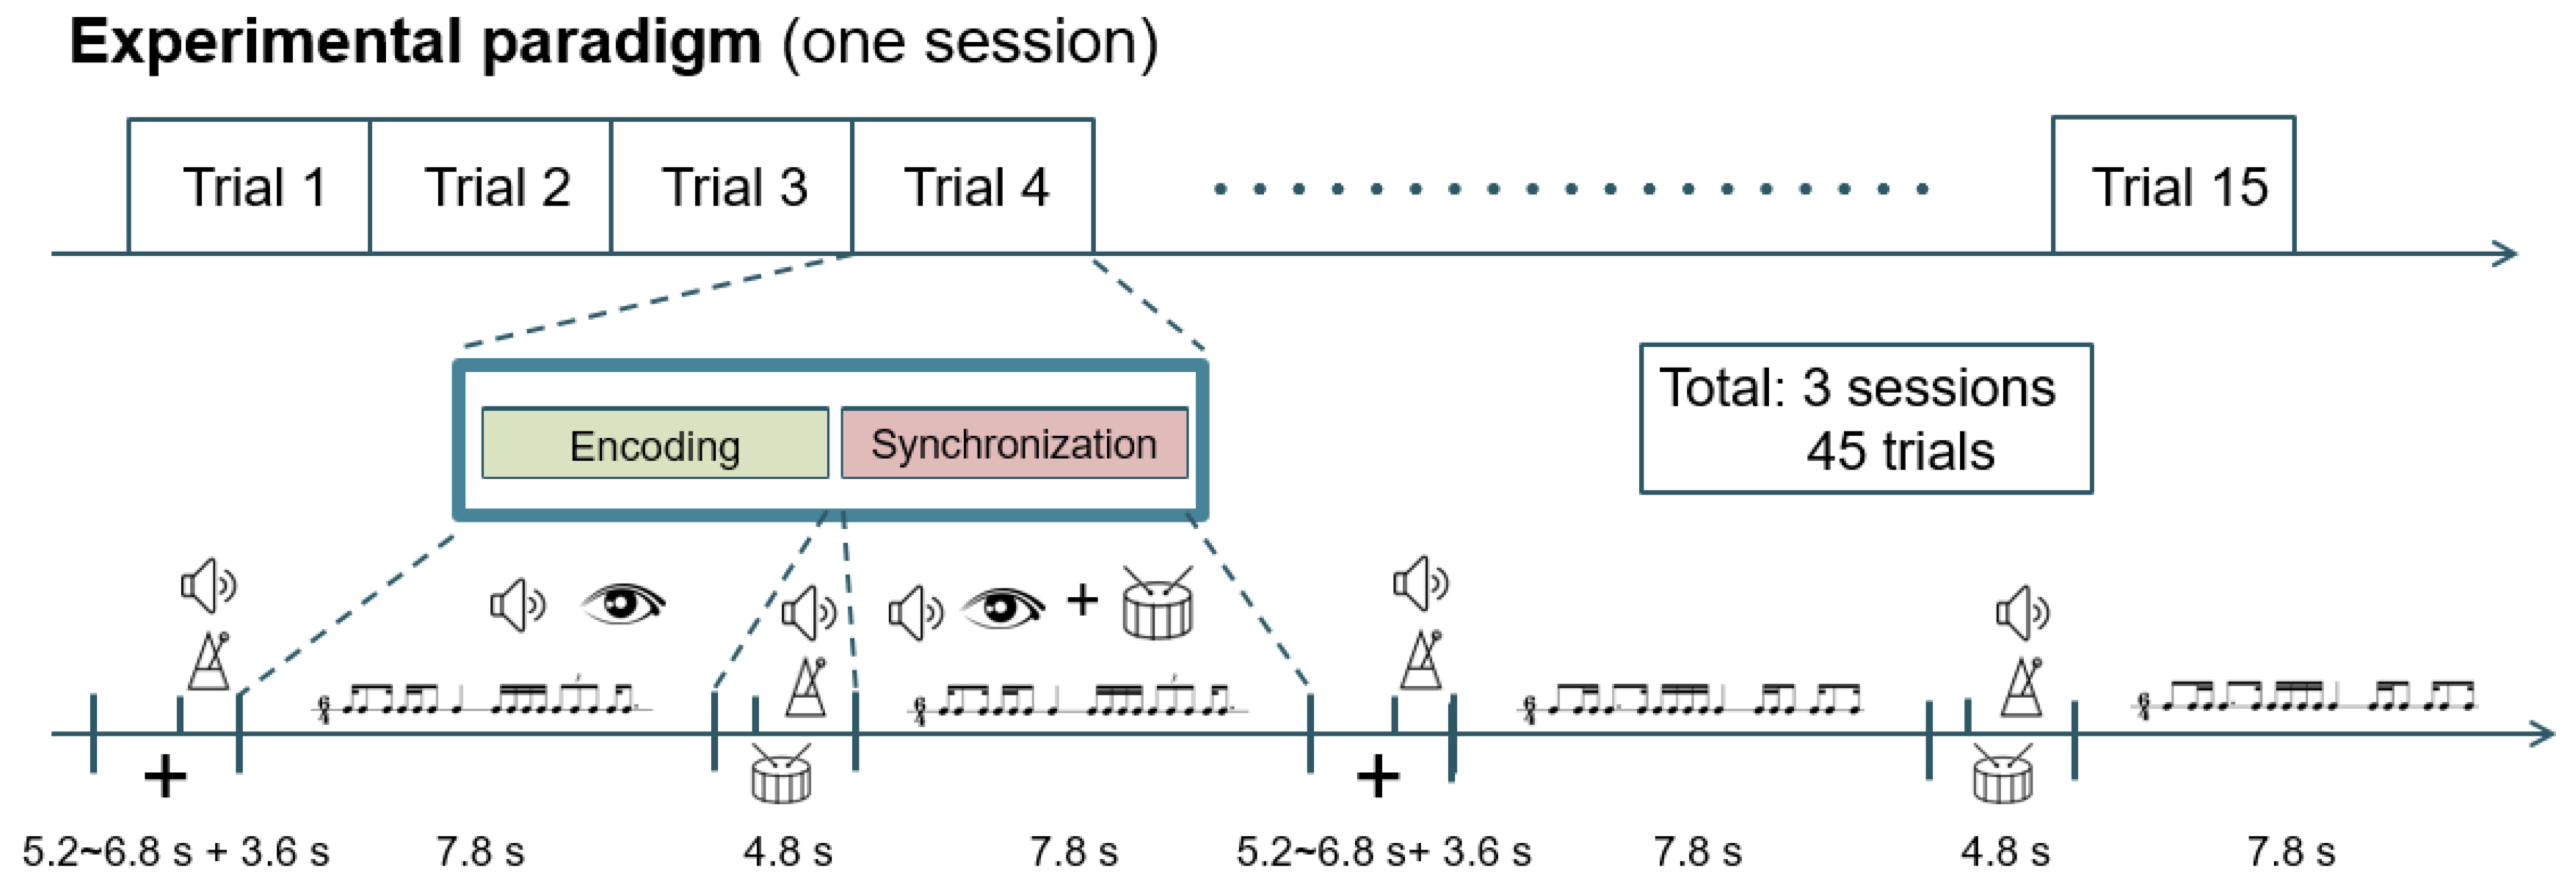
The study protocol, as it paradigm shown in Figure 1, was approved by the ethics committee of Institutional Review Board of Taipei Veterans General Hospital, Taiwan. Eighteen percussionists were recruited for fMRI data acquisition and provided their written informed consents. In each trial, the participant was asked to silently read the displayed music notes and simultaneously listen to the music during the encoding stage. During the synchronization stage, the subject was asked to use his/her index fingers to perform the same music while reading and listening to the music. Totally there were three sessions, each with fifteen trials. The preprocessing procedure of the fMRI data included slice timing, realignment, coregistration, normalization, and smoothing. Then we applied the LS-S (Least Squares - Separate) approach2 to obtain the beta images for each trial to be used in the following analysis.
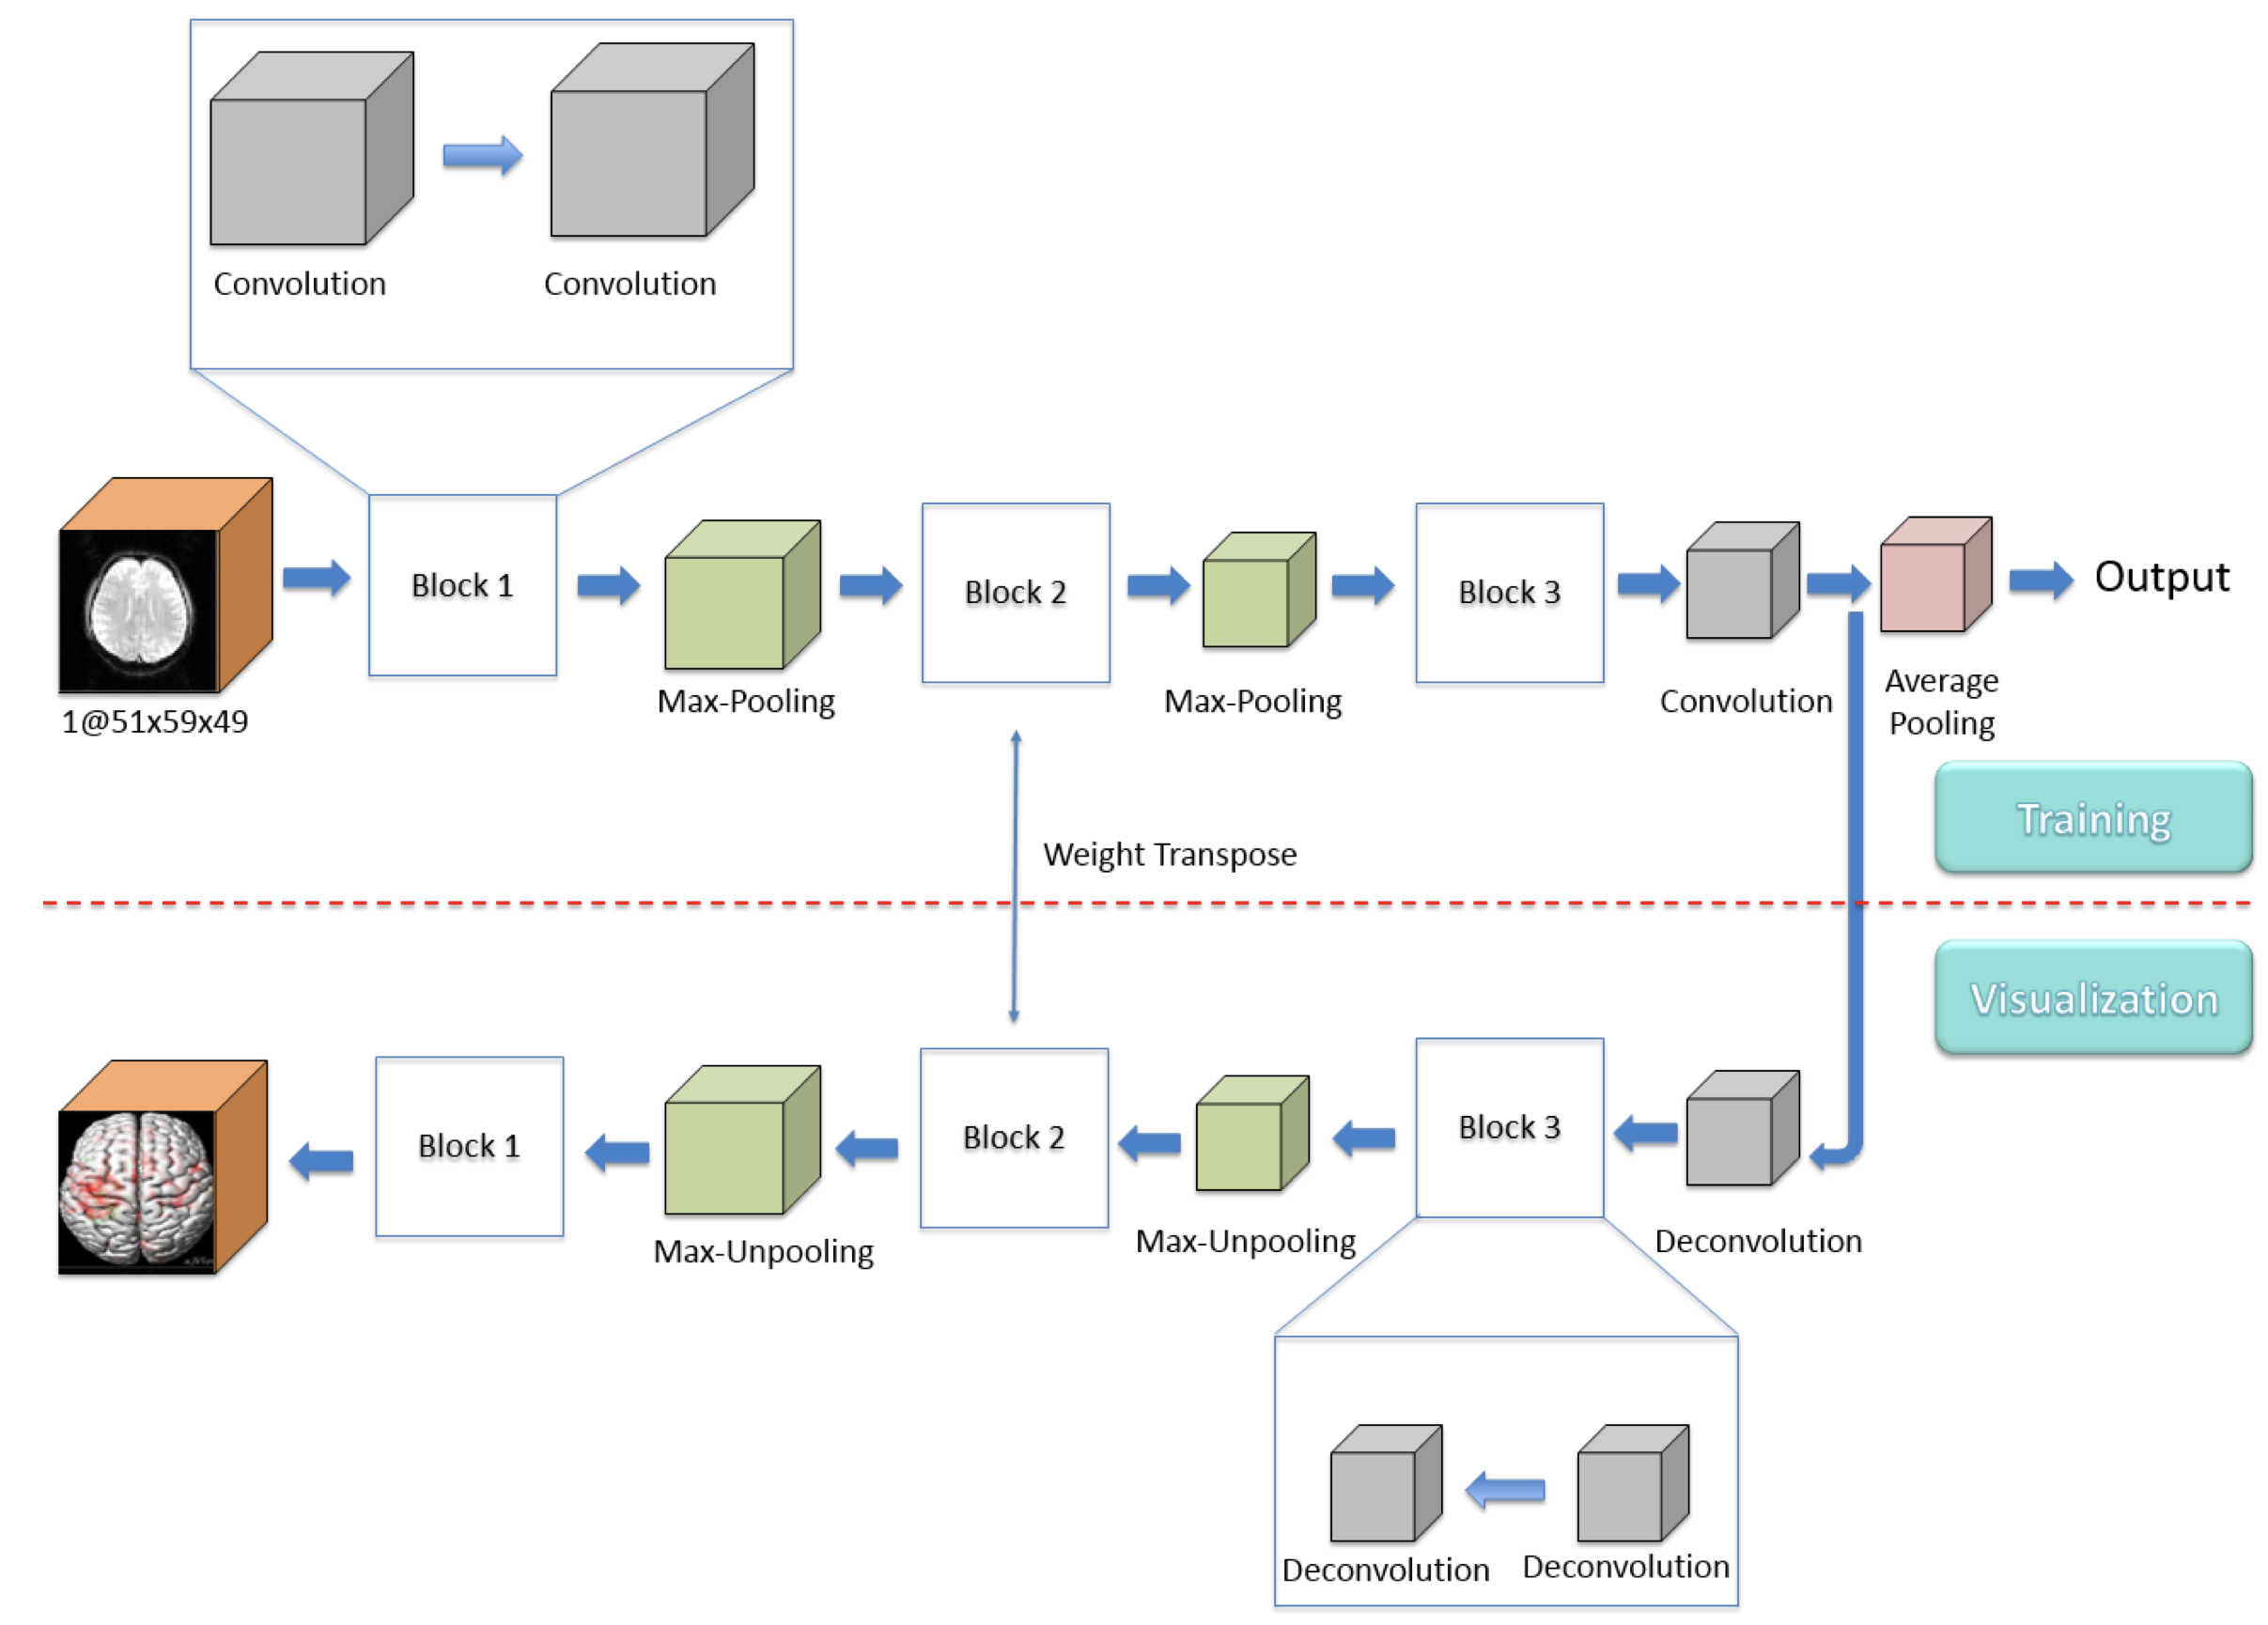
The whole set of beta images were used to train a deep 3D convolutional neural network (CNN) for classifying the data into either encoding or synchronization stage. The 3D CNN constructed in this work consisted of seven 3D convolutional layers, two max-pooling layers, an average-pooling layer, and a sigmoid classifier, as shown in Figure 2 (top panel). Each block contained two 3x3x3 3D convolutional layers, followed by a max-pooling layer with size 3x3x3 and stride 2. The size of input beta images was 51x59x49.
During training, CNN learned features by hierarchically and nonlinearly combining the responses of all voxels in the whole brain. After training, we applied deconvolution neural network3 to visualize the intermediate feature maps and to identify salient voxels involving the differentiation between the encoding and synchronization stages. The feature map visualization procedure was a reversed CNN, as shown in Figure 2 (bottom panel). The weights of deconvolution were from the trained CNN by transposing the CNN weight matrices. We fed the feature map before average pooling into the deconvolution procedure and obtained a functional map with the same size as the original beta image.
Results
Five-fold cross-validation was applied to analyze 90 beta images for each subject. Here we present the results of a single subject. The trained CNN can accurately classify the beta images into either encoding or synchronization stage and the average classification accuracy is 98.8%.
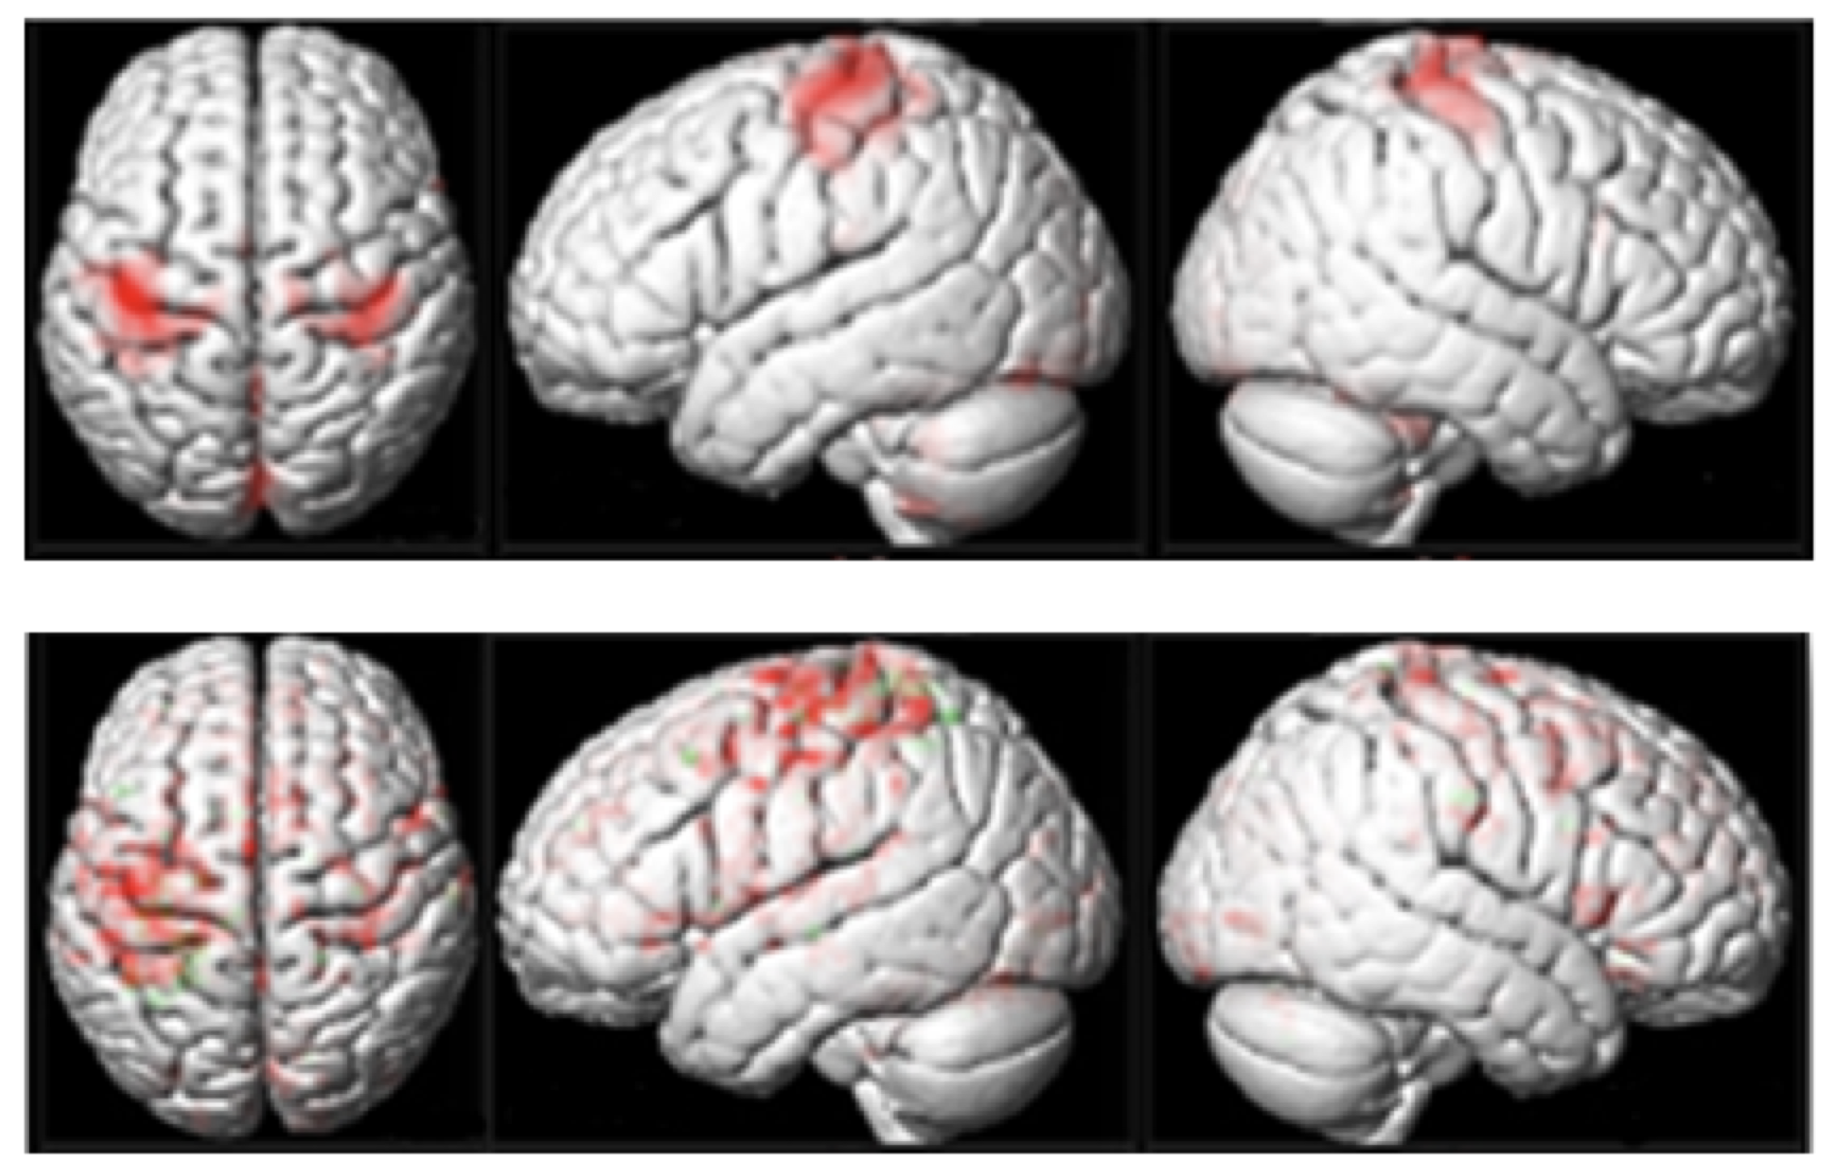
In Figure 3, the results of univariate statistical analysis (t-test using SPM, top panel) and the proposed method (bottom panel) are illustrated. Obtained from the deconvolution procedure, the functional maps of encoding and synchronization stages were analyzed by two sample t-test. Compared to the encoding stage, the functional maps of synchronization stage revealed mostly in the left postcentral area, where were in line with the results of univariate statistical analysis. Moreover, our method revealed the activity in the dorsal and ventral prefrontal regions, indicating that performing music demands more attention and executive functions.
Conclusions
The proposed deep neural network architecture can be applied to distinguish brain imaging data of different experimental conditions through the forward CNN procedure. It also can be used to reveal the distributed brain regions contributing to the differentiation of different experimental conditions, suggesting that deep neural networks are of great potential as an MVPA tool for functional brain mapping.Acknowledgements
This work was supported in part by the Ministry of Science and Technology, Taiwan, with Grants MOST-106-2420-H-009-001, MOST-106-2420-H-010-005, and MOST-106-2420-H-010-006-MY2.References
- Sundermann B, Herr D, Schwindt W, Pfleiderer B. Multivariate classification of blood oxygen level–dependent fMRI data with diagnostic intention: a clinical perspective. American Journal of neuroradiology 2014;35(5):848-855.
- Mumford JA, Turner BO, Ashby FG, Poldrack RA. Deconvolving BOLD activation in event-related designs for multivoxel pattern classification analyses. NeuroImage 2012;59(3):2636-2643.
- Zeiler
MD, Fergus R. Visualizing and understanding convolutional networks. European
conference on computer vision: Springer; 2014. p. 818-833.
Figures