5483
PCA Based Noise Reduction of Delay Maps Obtained from Human Connectome Project Resting State fMRI Data1Harvard Medical School - Mclean Imaging Center, Boston, MA, United States, 2Harvard Medical School - Mclean Imaging Center, BOSTON, MA, United States
Synopsis
Previous work from our group has presented compelling evidence that systemic low frequency oscillations (sLFOs), the major constituent of low frequency global systemic noise overlying resting state functional networks, propagate dynamically throughout the brain with cerebral blood circulation. More specifically, it has been demonstrated that sLFOs travel with the bulk cerebral blood flow with voxel-specific arrival time delays, and their spatiotemporal pattern changes in a way that tracks cerebral blood flow dynamics. We are interested in using the Human Connectome Project (HCP) dataset to determine normative blood flow delays throughout the brain. Time delay maps were obtained by the Regressor Interpolation at Progressive Time Delays (RIPTiDe) method , which was applied to 487 subjects of the HCP 500 subjects release data. While the procedure generates extremely clean mean delay maps, the individual delay maps are quite noisy. Because the circulation delays should in general be slowly varying in space, PCA noise reduction is a natural choice to preserve the spatial structure of the delay maps while removing random noise points.
Abstract
Previous work from our group has presented compelling evidence that systemic low frequency oscillations (sLFOs), the major constituent of low frequency global systemic noise overlying resting state functional networks, propagate dynamically throughout the brain with cerebral blood circulation. More specifically, it has been demonstrated that sLFOs travel with the bulk cerebral blood flow with voxel-specific arrival time delays, and their spatiotemporal pattern changes in a way that tracks cerebral blood flow dynamics Tong et. al. (2017). We are interested in using the Human Connectome Project (HCP) dataset to determine normative blood flow delays throughout the brain. Time delay maps were obtained by the Regressor Interpolation at Progressive Time Delays (RIPTiDe) method Erdogan et. al., which was applied to 487 subjects of the HCP 500 subjects release data. While the procedure generates extremely clean mean delay maps, the individual delay maps are quite noisy. Because the circulation delays should in general be slowly varying in space, PCA noise reduction is a natural choice to preserve the spatial structure of the delay maps while removing random noise points.
Introduction
The three dimensional time delay maps of all of the resting state scans for the entire set of subjects can be summarized in a matrix form X. Rows of the matrix represent different subjects, columns represent the voxels, and each value in the matrix is the corresponding time delay. In the HCP 500 subject release, there are 487 subjects with complete resting state acquisitions. Since each subject has two resting state scan, the whole data set is in the size of $974$x$902629$. By PCA, we decompose the data covariance $X^TX$ matrix of size $902629$x$902629$ as:
\begin{align}
X^TX = \sum_{i=1}^{N} \lambda_i u_iu_i^T
\end{align}
where $\lambda_i $ and $ u_i$ are eigenvalues and eigenvectors, respectively. However, the direct application of PCA is problematic. Because the feature size is very high and sample size is low. For that reason, we applied PCA to the transpose data matrix X as suggested by \cite{bishop2006machine}. The data covariance matrix of the $XX^T$ which is only size of $974$x$974$ can be decomposed similarly as
\begin{align}
XX^T = \sum_{i=1}^{K} \lambda_i^o v_iv_i^T
\end{align}
where $\lambda_i $ and $v_i$ are eigenvalues and eigenvectors of the transposed data covariance matrix, respectively. However, working in the simplified data covariance matrix, we can go back to the original eigenvectors easily as: \citep{bishop2006machine}
\begin{align}
u_i = X^Tv_i
\end{align}
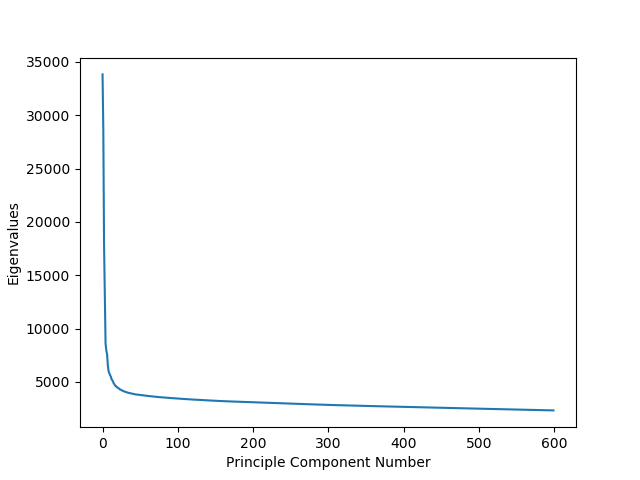
In order to determine the main components of data covariance matrix, we plot the eigenvalues. We selected the components where the plot has a hinge. Subsequently, the whole data is projected in the selected principal components. Results
The plot of eigenvalues of the PCA methods is a nice shaped figure as seen in Figure 1. The hinge occurs at the 39'th component. Hence, first 39 components are chosen to describe the whole data. Remaining components are taken as noise.
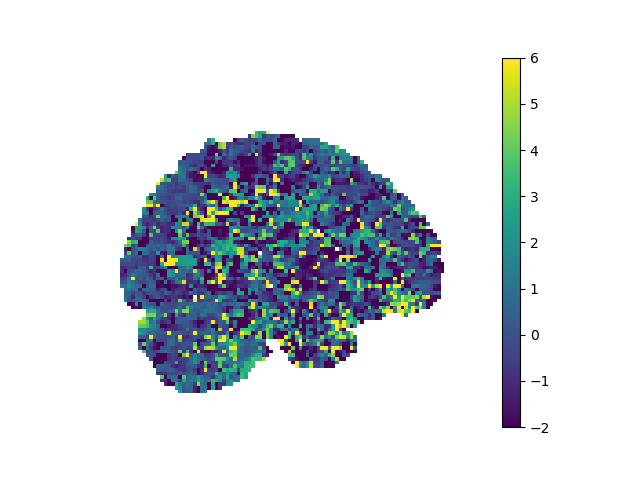
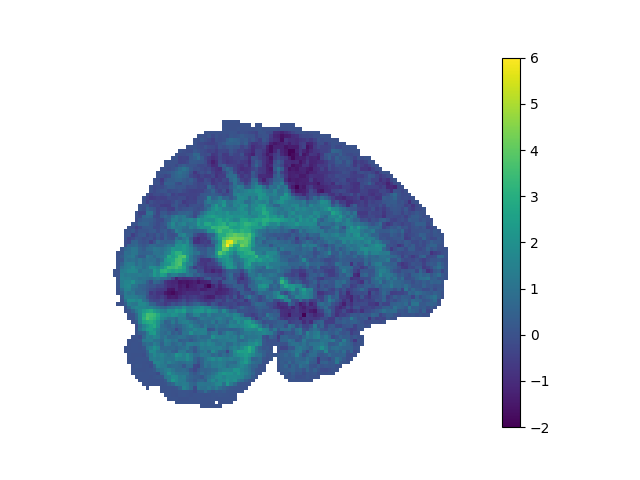
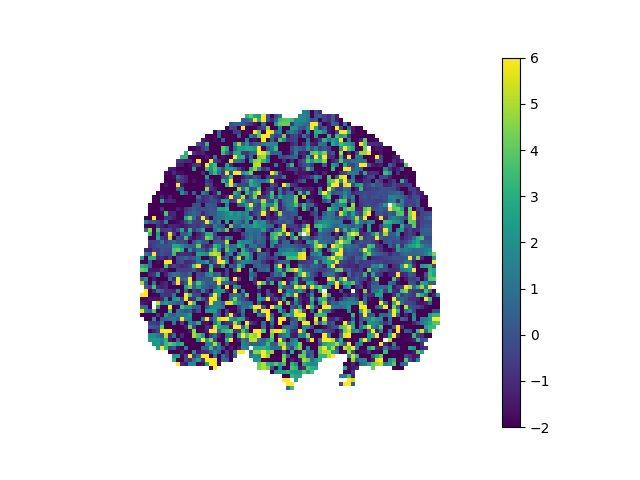
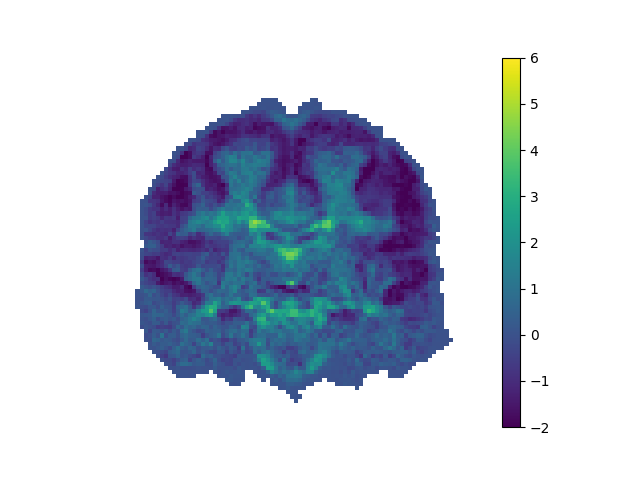
After applying noise reduction by PCA method, our noisy figures are smoothed as seen in Figure 2,3,4,5.
Discussion
Direct application of the RIPTIDE algorithm to the resting state fMRI data can result in noisy delay maps. In order to improve signal to noise ratio, we used the rich Human Connectome Project data set. By applying PCA to the delay maps, we performed noise reduction. The noise removed figures are smooth. After PCA noise reduction, we have also delay maps which are compatible with the expected physiological expected delay ranges. Because the major source of variation between subjects should be between the individual arterial territories, we also performed linear regression analysis towards the average territory map given by Tatu et. al. The error in linear regression for the PCA applied RIPTIDE was around 17-percentage better.
By compactly representing each delay maps with 39 PCA coefficients (rather than 902629 voxels), the delay maps are more amenable to being used as inputs for other machine learning techniques in our subsequent works. For example, we hope to use deviation from the smooth variation of the PCA delay map representations as a method for discerning vascular anomalies such as strokes. Conclusion
Regressor interpolation at progressive delays (RIPTIDE) method is used to obtain time delay maps to the human connectome project (HCP). These maps contain a good deal of redundant information, and are amenable to substantial compression using PCA decomposition into a relatively small set of spatial components. The PCA decomposition method chosen is suitable for low sample high feature sizes. The outputs are smoothed versions of the formerly noisy figures.Acknowledgements
No acknowledgement found.References
1. Tong and Frederick et. al., Perfusion information extracted from resting state functional magnetic resonance imaging, Journal of Cerebral Blood Flow and Metabolism, 2017
2. Erdogan et. al. Correcting for blood arrival time in global mean regression enhances functional connectivity analysis of resting state fMRI-BOLD signals, Frontiers in human neuroscience, 2016
3. Bishop, Christopher M. "Machine learning and pattern recognition." Information Science and Statistics. Springer, Heidelberg, 2006.
4. Tatu et. al. Arterial territories of the human Brain, Manifestations of Stroke 2012Figures