5480
Smooth global fMRI signals facilitate robust cross-subject classification of naturalistic movie stimuli1AMRI, LFMI, NINDS, NIH, Bethesda, MD, United States
Synopsis
The imprecision of anatomical alignment methods commonly limits the spatial resolution and sensitivity of conventional fMRI analysis based on statistical parametric mapping. Recently proposed machine-learning methods aim to circumvent the cross-subject (XS) alignment problem by computing a linear projection of the fMRI signal from each subject's anatomical space to a common albeit abstract "functional" space [1][2]. The success of these "hyperalignment" methods is often attributed to a spatially and functionally specific (linear) correspondence between the fMRI signal in different subjects under similar stimulation conditions. Cross-subject PCA of averaged fMRI data from repeated movie-viewing experiments reveals smooth globally distributed fMRI signal components that facilitate robust cross-subject classification by Linear Discriminant Analysis (LDA). Such global cortical network activity may contribute to the success of fMRI hyperalignment strategies.
Introduction
The imprecision of anatomical alignment methods commonly limits the spatial resolution and sensitivity of conventional fMRI analysis based on statistical parametric mapping (SPM). Recently proposed machine-learning methods aim to circumvent the cross-subject (XS) alignment problem by computing a linear projection of the fMRI signal from each subject's anatomical space to a common albeit abstract "functional" space [1][2]. The success of these "hyperalignment" methods is often attributed to a spatially and functionally specific (linear) correspondence between the fMRI signal in different subjects under similar stimulation conditions. We recently demonstrated that PCA-LDA classifiers achieve high classification rates for naturalistic movie stimuli presented repeatedly to the same subject. Here we demonstrate that the same classifiers also achieve high classification rates in cross-subject classification. Both same-subject (SS) and cross-subject (XS) classifications seem to rely primarily on smooth global fMRI signal patterns that are robustly reproduces across experimental runs and across subjects.Methods
Four healthy volunteers underwent fMRI and simultaneous eye tracking while watching a 5-minute scene from a popular action movie repeatedly – 8 times over the course of 4-6 scan sessions. fMRI data were acquired at 2mm isotropic resolution on a 7T MRI scanner equipped with a 32-channel receive head coil using a TR of 2s and typical single-shot EPI sequence parameters. All data analysis was done using custom code in Matlab supplemented by tools from AFNI and FSL. The fMRI data from each experimental run underwent motion correction, alignment to the subject's T2-weighted anatomical scan and resampling to an isotropic resolution of 1.2mm. Motion parameters and trends up to 2nd order were regressed out before normalizing the variance of each voxel time series. Drawing on previous work to maximize the same-subject classification accuracy (CA) by Linear Discriminant Analysis (LDA) the present analysis focused on 2^14 voxels in each subject, those most responsive to the stimulus (according to a univariate F-statistic) [3]. The fMRI signals from each subject were averaged across experimental runs and reduced to 75 principal components, equal to the number of fMRI volumes in the first half of each experiment. Data from the second half was set aside as validation data for the subsequent classification analysis. The principal components (PCs) from all 4 subjects were concatenated as separate features and subjected to a second, joint PCA yielding components common across subjects. The procedure yielded a number of dominant (high-variance) PCs that where similar across experiments and subjects, primarily in their time course, but also broadly with regard to coarse anatomical features.Results&Discussion
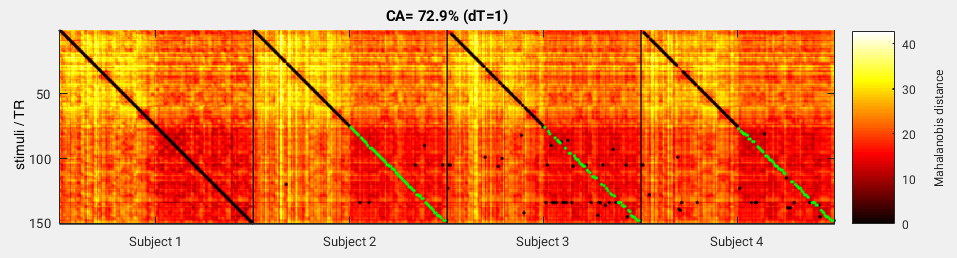
Figure 1 shows the first PC across the group of 4 subjects: A) the time course originating from each subject’s subspace and B-E) the corresponding spatial weight maps in each subject’s anatomical space. Figure 2 shows stimulus-by-stimulus dissimilarity matrices based on the Mahalanobis distance underlying the LDA classifier comparing fMRI data from subject 1 (reference) to subjects 1-4 (probes). Green dots mark column minima that indicate correctly classified samples from the validation data. Black dots signify incorrectly classified validation samples as well as training samples that did not contribute to the overall classification accuracy of CA=72.9%. In this example the first half of the data (movie) was used as training data for computing PCAs and residual covariance matrices (LDA). The resulting CA was high, well above the theoretical chance level of 3/75=4%.Conclusions
Cross-subject PCA of averaged fMRI data from repeated movie-viewing experiments reveals smooth globally distributed fMRI signal components that facilitate robust cross-subject classification by Linear Discriminant Analysis (LDA). Such global cortical network activity may contribute to the success of fMRI hyperalignment strategies.Acknowledgements
No acknowledgement found.References
[1] Haxby, J.V. et al., 2011. A common, high-dimensional model of the representational space in human ventral temporal cortex. Neuron, 72(2), pp.404–416.
[2] Guntupalli, J.S. et al., 2016. A Model of Representational Spaces in Human Cortex. Cerebral cortex (New York, NY : 1991), 26(6), pp.2919–2934.
[3] Mandelkow, H., de Zwart, J.A. & Duyn, J.H., 2017. Effects of spatial fMRI resolution on the classification of naturalistic movies. NeuroImage, 162, pp.45–55.
Figures
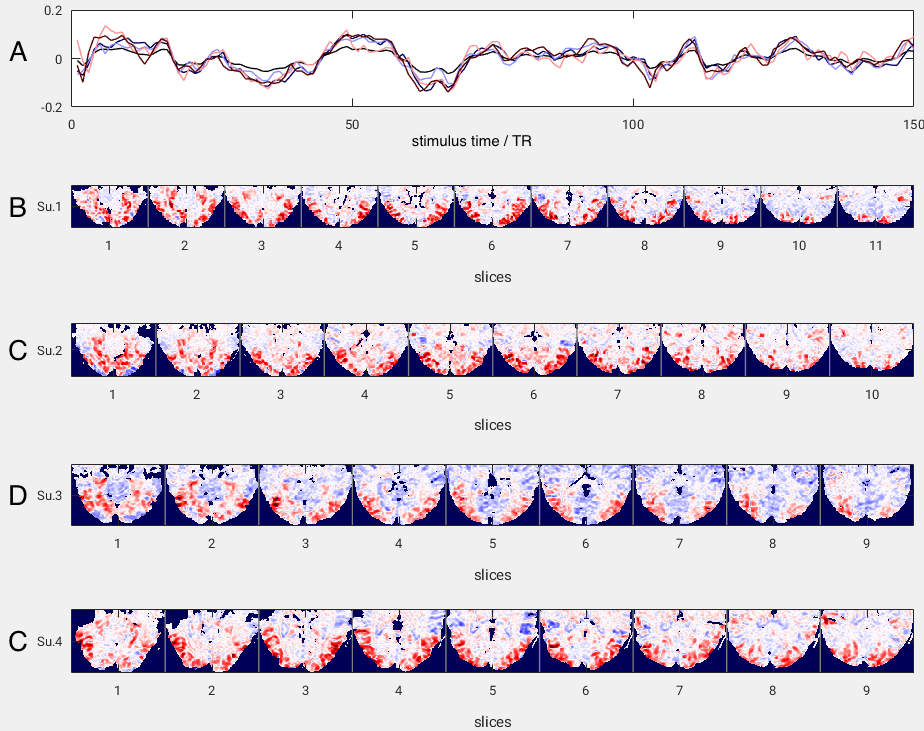
Figure 1 Group PC #1: Four subject time courses (A) each 150 TR long (5-minute movie stimulus) corresponding to the projected weight maps for principal component #1 in each subject’s anatomical space (B-E).