5476
Complex-valued analysis of high-resolution SSFP-fMRI increases reliability in detecting active voxels1Department of Biomedical Engineering, Amirkabir University of Technology, Tehran, Iran (Islamic Republic of), 2School of Cognitive Sciences, Institute for research in fundamental sciences (IPM), Tehran, Iran (Islamic Republic of)
Synopsis
In this study, we evaluated the reliability of the results of a complex-valued analysis that uses both magnitude and phase data in
Introduction
SSFP-fMRI techniques indicate high-specificity [1-4]. They, however, suffer from lower sensitivity compared to GRE BOLD, which can be partly compensated by collecting data at high static magnetic field [1-2]. The sensitivity of these techniques can be further improved in processing step by complex-valued analysis [5]. It is hypothesized that a complex domain data analysis is preferred over only magnitude-based analysis methods, since it uses both magnitude and phase signal-change information. In this study, we evaluated the reliability and sensitivity of results of the complex-valued analysis approach with magnitude-based analysis on experimental CE-FAST data at 7 Tesla.Material & Methods
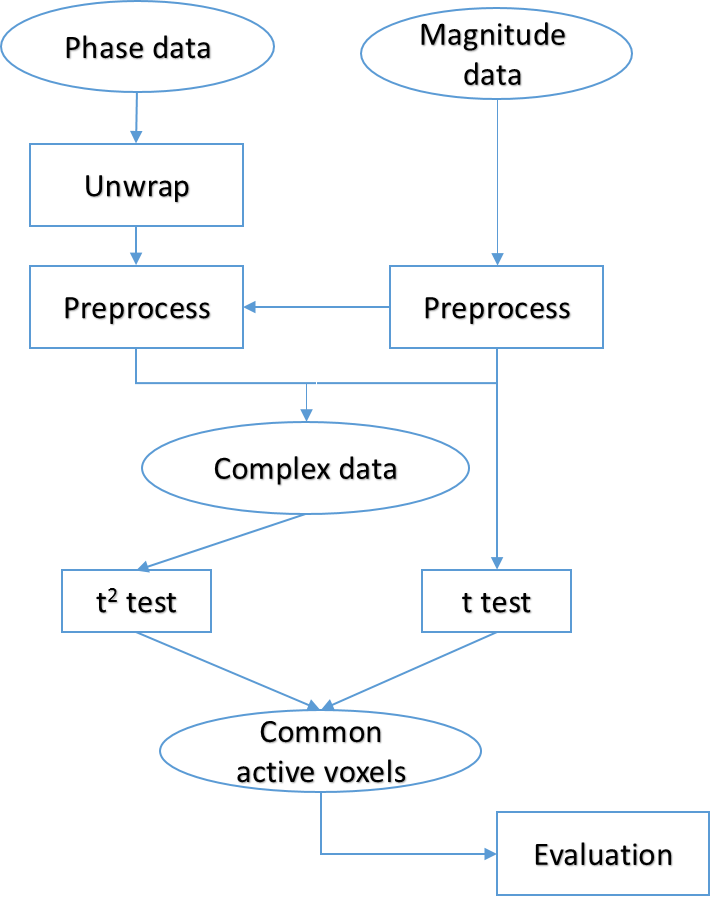
Data were acquired using a 7T Magnetom (Siemens Healthcare, Erlangen, Germany) scanner with 32 channel head coil with a non-balanced (nb) SSFP (CE-FAST) technique [4]. Implemented parameters for imaging sequence were as follows: TR/TE=14.1/10.9ms, voxel size=1.25x1.25x5 mm, Matrix size=160x148x12, FA=23°, Volume-TR=8s, Partial Fourier = (6/8, 6/8), GRAPPA=3. A total of 40 volumes were acquired in 320 seconds for each subject. For five randomly selected subjects, both magnitude and phase data were reconstructed. In all data acquisitions, a combined visual-motor task was used by utilizing a reversing checker-board (flashing in 8 Hz) simultaneously with right hand finger tapping. The data were preprocessed using FSL and analyzed using Matlab in steps shown in figure 1. The preprocessing steps included brain extraction and head motion correction. Brain extraction mask was generated and motion parameters were obtained from the magnitude images and applied on the unwrapped phase images. Complex data were then generated by phase and magnitude images. For the complex analysis, we used the Hotelling’s t2-test method first applied by Lee et. Al. on bSSFP-fMRI data in 2007 [5]. Hotelling’s t2-test is a bivariate test to evaluate the null hypothesis in the complex domain, where the two variables are real and imaginary parts of the data [5]. For the magnitude data, we tested the null hypothesis by conventional t-test method.Results
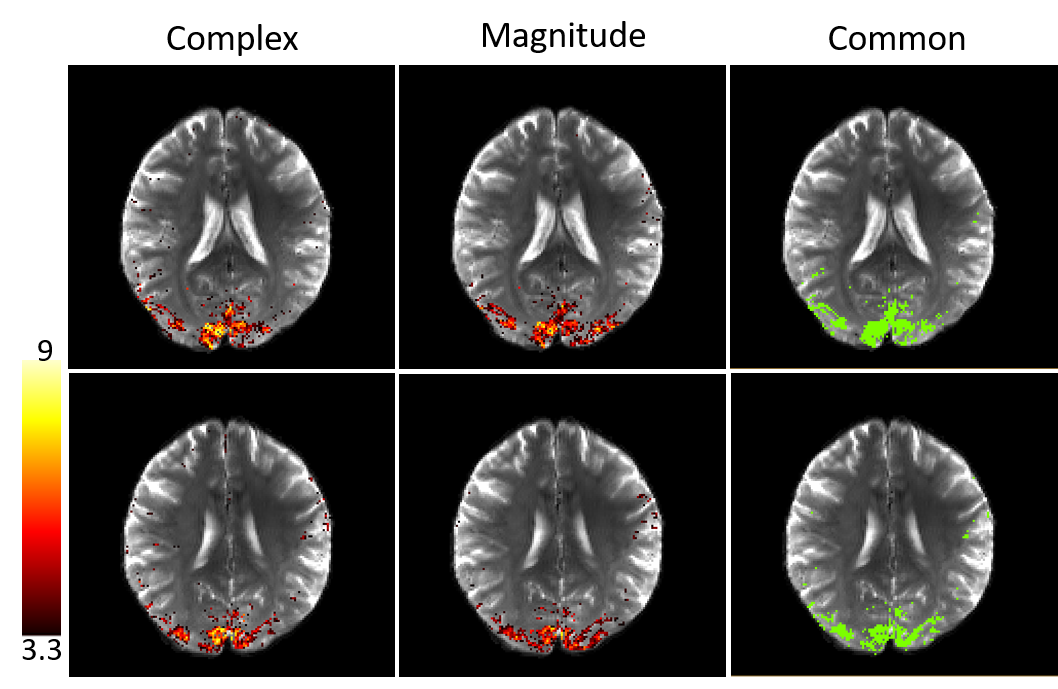
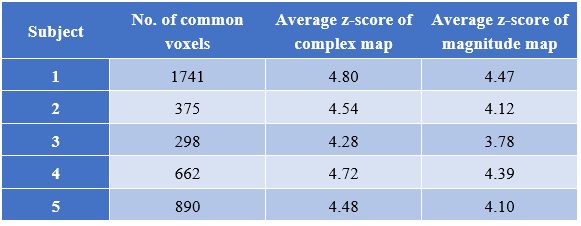
An uncorrected p-value of 0.001 was set as a threshold to determine the active voxels and z-score maps were acquired. White matter was then masked to eliminate the false positives. The results for two selected slices of complex and magnitude maps of a sample subject are shown in figure 2. Activated voxels that are in common between magnitude and complex maps were extracted and over them the z-score was averaged. Number of common voxels and the average z-score of magnitude and complex maps are shown in table 1 for all subjects.Discussion
Here, we evaluated the complex data analysis method and compared the results with magnitude-based ones on experimental nbSSFP data. Complex analysis showed an average of 9.4% higher mean z-score over magnitude analysis for common activated voxels over the 5 subjects. This suggests an increased level of sensitivity in complex analysis of SSFP data. Complex maps also showed more active voxels compared to magnitude ones, which is in agreement with previous studies [5]. This increase could be caused by false positives as a result of large veins dephasing effects, but since we conducted the comparison only on the common active voxels, we may conclude that the aforementioned increase is at least partly from the real activity that the magnitude analysis had missed.Conclusion
Including the phase data through the complex analysis of SSFP-fMRI technique increases the reliability of active voxels detection as well as sensitivity. The complex-valued analysis is therefore a promising method in analyzing SSFP-based techniques.Acknowledgements
The authors thank Prof. David G. Norris for facilitating the data acquisition. This work was supported by Iranian Council for Cognitive Sciences and Technologies (COGC) by grant no. 3198.References
[1] Barth, Markus, et al. "T2‐weighted 3D fMRI using S2‐SSFP at 7 tesla." Magnetic resonance in medicine 63.4 (2010): 1015-1020.
[2] Goa, Pål E., et al. "BOLD fMRI signal characteristics of S1-and S2-SSFP at 7 Tesla." Frontiers in neuroscience 8 (2014).
[3] Auerbach, Edward J., Keith Heberlein, and Xiaoping Hu. "High-resolution T2 fMRI at high magnetic fields using PSIF." Proceedings of the 10th Annual Meeting of ISMRM. 2002.
[4] Malekian, Vahid, et al, “A Robust SSFP Technique for fMRI at Ultra-High Field Strengths”, Proc. Intl Soc Mag Reson Med. Vol. 25. 2017.
[5] Lee, Jongho, et al. "Complex data analysis in high‐resolution SSFP fMRI." Magnetic resonance in medicine 57.5 (2007): 905-917.
Figures