5475
Temporal autocorrelation bias still exists in fMRI results1Department of Clinical Neurosciences, University of Cambridge, Wolfson Brain Imaging Centre, Cambridge, United Kingdom, 2Department of Pure Mathematics and Mathematical Statistics, University of Cambridge, Statistical Laboratory, Cambridge, United Kingdom
Synopsis
Given the recent trend towards validating the neuroimaging methods, we compared the most popular fMRI analysis softwares: AFNI, FSL and SPM, with regard to autocorrelation modelling. We used both resting-state and task-based fMRI data, for which we assumed different experimental designs. For FSL and SPM we observed a strong relationship that the lower the assumed experimental design frequency, the more likely it was to observe significant activation. It indicates that pre-whitening in FSL and SPM does not remove a substantial part of the temporal autocorrelation in the noise. Our study points to superior autocorrelation modelling in AFNI.
Introduction
The main motivation for our work was study (1), where it was shown that in SPM the lower the repetition time (TR), the more likely it is to detect significant activation in single subject fMRI studies. Compared to (1), we used additional baseline measures. Apart from SPM, we investigated AFNI and FSL. These three softwares are the most popular ones used in fMRI research. Our aim was to identify the software which models temporal autocorrelation in the most accurate way. The historically very first fMRI studies were performed without accounting for temporal autocorrelation, and we tried to check if the methods introduced later, which are nowadays used in virtually all fMRI studies, work as expected.
Another motivation for our work is the recent controversies around some other popular neuroimaging methods, including cluster inference (2) and spatial resolution changes (3). Current large-scale validation studies reflect the current abundance of fMRI data, high computational capabilities of today’s computers and other scanning sequences as compared to the 1990s, when the standard neuroimaging methods were first proposed.
Methods
For native space analyses started in the three softwares of interest (AFNI, FSL and SPM), the same mask, the same registration to MNI space and the same multiple testing correction were applied. This way we limited the influence of possible confounders on the results. Furthermore, rather than investigating the positive rates only, we used two additional markers. The first one was the mean number of significant voxels across subjects in a dataset, while the second one was the spatial distribution of the significant voxels. Apart from assuming dummy experimental designs for resting state data, we also assumed wrong experimental designs to task-based data, and we used resting state scans simulated using the neuRosim package in R (4). All our scripts can be found on https://github.com/wiktorolszowy/fMRI_temporal_autocorrelation
In AFNI autocorrelation is modelled voxel-wise. For each voxel an ARMA(1,1) process is estimated. For FSL a Tukey taper is used to smooth the spectral density estimates. These smoothed estimates are then additionally smoothed within tissue type (5). SPM estimates autocorrelation globally as an AR(1) process combined with white noise.
Results
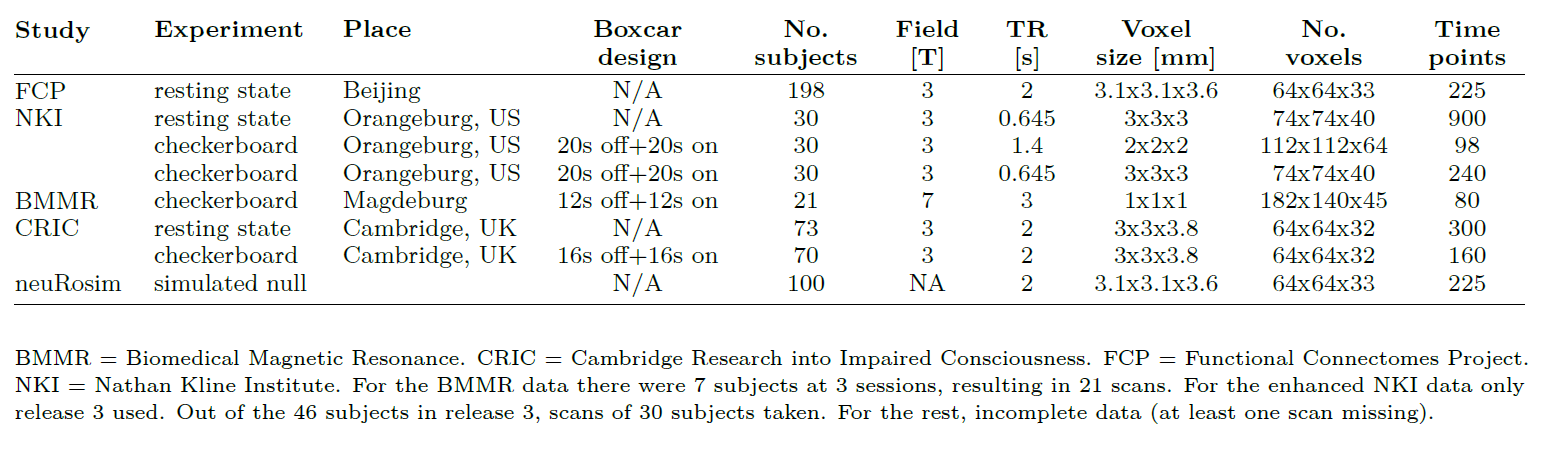
Table 1 shows 8 fMRI datasets which correspond to different scanning sequences, subject populations and fMRI experiments (rest vs. task), which we employed in our study.
Fig. 1 presents mean numbers of voxels deemed significant across the subjects in four resting state datasets. On the x-axis the assumed experimental designs are listed. The highest assumed experimental design frequency was 1/20 Hz (“10” on the x-axis), which corresponded to a boxcar design of 10s of assumed rest followed by 10s of assumed stimulus presentation. The lowest assumed experimental design frequency was 1/80 Hz (“40” on the x-axis), which corresponded to a boxcar design of 40s of assumed rest followed by 40s of assumed stimulus presentation. On average, AFNI returned for resting state scans the least significant voxels, while SPM returned the most significant voxels.
Fig. 2 presents mean numbers of voxels deemed significant across the subjects in four task-based datasets. Again, AFNI returned the least significant results. On the other hand, the three softwares performed similarly for the assumed true experimental designs.
Discussion
We used resting state scans (both real and simulated) with assumed dummy experimental designs and task-based scans with assumed wrong experimental designs as baseline approaches. For these baselines AFNI analyses resulted in lower numbers of significant voxels. For task-based data with assumed true experimental design the relative differences between the softwares were smaller. Opposed to FSL and SPM, AFNI estimates temporal autocorrelation in each voxel separately. Thus, there is less autocorrelated noise left in the data and the statistics are not inflated. A particularly interesting case is the checkerboard experiment conducted with impaired consciousness patients, where SPM found more significant activation for the experimental design with the assumed lowest stimulus frequency than for the true experimental design. This is in line with (6), where it was shown that if temporal autocorrelation is not removed from the data, then there exists a relationship between lower assumed experimental design frequency and increased number of significant voxels.
Conclusion
AFNI removes temporal autocorrelation more accurately than FSL and SPM. There is still need to validate and possibly improve some of the methods used in fMRI studies.Acknowledgements
We would like to thank the James S. McDonnell Foundation for funding the image acquisitions of the Cambridge Research into Impaired Consciousness (CRIC) group, and the CRIC group for sharing their data. Oliver Speck, Michael Hoffmann and Aini Ismafairus from the Otto von Guericke University provided us with the 7T data. We also thank the Neuroimaging Informatics Tools and Resources Clearing house and all of the researchers who have contributed with data to the 1,000 Functional Connectomes Project and to the Enhanced Nathan Kline Institute - Rockland Sample. Furthermore, we would like to thank Paola Finoia for much valuable advice and Paul Browne for technical support. W.O. was in receipt of scholarships from the Cambridge Trust and from the Mateusz B. Grabowski Fund.References
(1) Eklund, A., Andersson, M., Josephson, C., Johannesson, M., & Knutsson, H. (2012). Does parametric fMRI analysis with SPM yield valid results?—An empirical study of 1484 rest datasets. NeuroImage, 61(3), 565-578.
(2) Eklund, A., Nichols, T. E., & Knutsson, H. (2016). Cluster failure: why fMRI inferences for spatial extent have inflated false-positive rates. Proceedings of the National Academy of Sciences, 201602413.ISO 690.
(3) Mueller, K., Lepsien, J., Möller, H. E., & Lohmann, G. (2017). Commentary: Cluster failure: Why fMRI inferences for spatial extent have inflated false-positive rates. Frontiers in human neuroscience, 11, 345.
(4) Welvaert, M., Durnez, J., Moerkerke, B., Verdoolaege, G., & Rosseel, Y. (2011). neuRosim: An R package for generating fMRI data. Journal of Statistical Software, 44(10), 1-18.ISO 690
(5) Woolrich, M. W., Ripley, B. D., Brady, M., & Smith, S. M. (2001). Temporal autocorrelation in univariate linear modeling of FMRI data. Neuroimage, 14(6), 1370-1386.
(6) Purdon, P. L., & Weisskoff, R. M. (1998). Effect of temporal autocorrelation due to physiological noise and stimulus paradigm on voxel-level false-positive rates in fMRI. Human brain mapping, 6(4), 239-249.
Figures