5472
Multi-site reliability of Default Mode Network and Graph Theoretical Measures in Resting State fMRI1Electrical and Computer Engineering, Purdue University, West Lafayette, IN, United States, 2Departments of Radiology and Imaging Sciences, Neurology, and Psychiatry, Indiana University School of Medicine, indianapolis, IN, United States
Synopsis
This study investigated the multi-site reliability of resting state fMRI (rs-fMRI) using Default Mode Network (DMN) connectivity and graph theory measures like mean shortest path distance, clustering coefficient, modularity, transitivity and global mean strength. Test-retest and between-site reliability for all metrics were calculated by variance component analysis using restricted maximum likelihood (REML) estimates. Test-retest reliability was found to be poor to fair and between-site reliability was consistently poor for all metrics.
Introduction
Resting state functional MRI (rs-fMRI) is widely used in the investigation of functional connectivity as a potential biomarker for neurological disease prognosis and progression. Multi-site longitudinal studies can help in collection and comparison of larger datasets over diverse clinical populations. This study sought to quantify the test-retest and between-site reliability of default mode network (DMN) connectivity and graph theory measures.Methods
1) Participants: 24 healthy volunteers (13 male and 11 female; ages:22-41) participated in a total of four imaging sessions (0-21 days apart) at two sites. (Site 1) Two imaging sessions were conducted using a 3T General Electric Signa HDx and a 16-channel brain array (Nova Medical). (Site 2) Two imaging sessions were conducted using a 3T GE Discovery MR750 and a 32-channel brain array (Nova Medical). Both imaging sessions at any given site were conducted on the same day. An additional 15 healthy volunteers (6 male and 9 female; ages:15-29) participated in one imaging session at Site 1.
2) MR Data Acquisition: Each imaging session (independent of site) consisted of a high-resolution (1mm isotropic) T1-weighted scan for registration purposes and two rs-fMRI scans with common imaging parameters across sites (TR/TE=2000/26ms; flip=35deg; 34 slices; FOV=20cm; 3.125x3.125x3.80mm voxel size, 290 volumes).
3) Data Processing: rs-fMRI data were processed following the pipeline from a recent study1 using AFNI2 and FSL3,4. Complete datasets of four rs-fMRI scans were thus obtained for 17 participants after motion censoring. Using the atlas5, the surviving brain volumes were divided into 278 contiguous regions-of-interest (ROIs).
4) Data Analysis: The functional connectivity (FC) matrix for each rs-fMRI scan was computed by cross-correlating the mean time series of each of the 278 ROIs. Resultant FC matrices were treated as weighted undirected graphs to calculate network measures at different threshold values of correlation. Self-connections, anti-correlations and all values less than the threshold were set to zero and the largest component of the undirected graph of ROIs was used for computing network measures.
DMN connectivity was calculated using a spherical seed region (18mm radius) placed at the posterior cingulate/precuneus (PCC; MNI coordinates 0,50,28). The mean time series of the seed region was correlated with each voxel time series to obtain a whole-brain correlation map. Using the independent dataset from 15 individuals (with same imaging parameters) the average whole-brain correlation map was used as a connectivity mask for the DMN to avoid circularity issues, and to obtain high quality ROIs. For averaging purposes, clusters of at least 500 voxels were observed for a correlation threshold of |r| > 0.13, resulting in four ROIs, largely located in PCC, medial frontal cortex (MFC), right and left temporal cortex (RTC and LTC respectively). The average Pearson correlation coefficient was obtained within each of these ROIs for each rs-fMRI scan and participant.
For all gray matter voxels, the temporal signal to noise ratio (tSNR) was also computed.
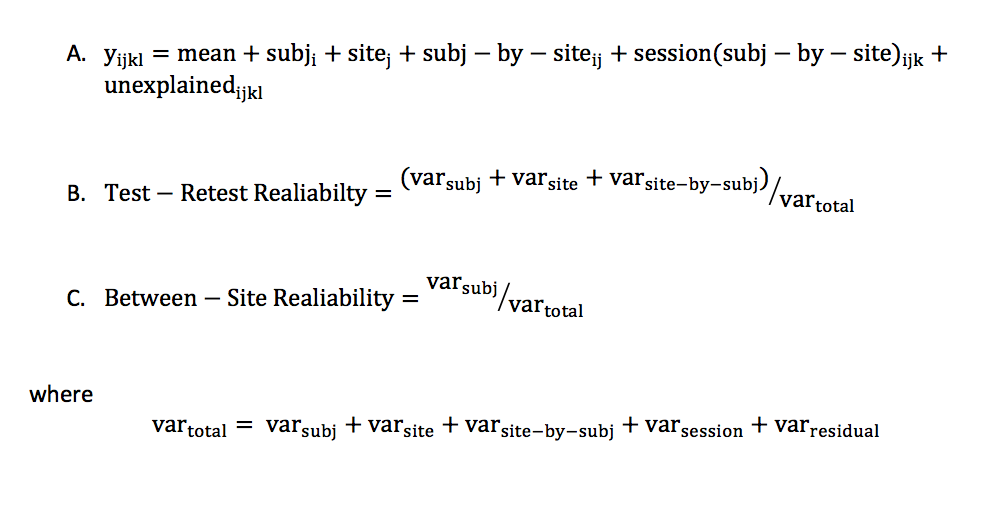
The reliability of each metric was calculated by variance component analysis according to the model6 in equation (A) of Figure 1, using restricted maximum likelihood (REML) estimates. All factors are treated as random effects, with subjects and sites fully crossed, and sessions nested within site and subject combinations. The residual term accounts for the variance due to runs within each session, day-to-day variation at each site, and other unexplained factors. Test-retest and between-site reliability was estimated by equations (B) and (C) of Figure 1.
Results
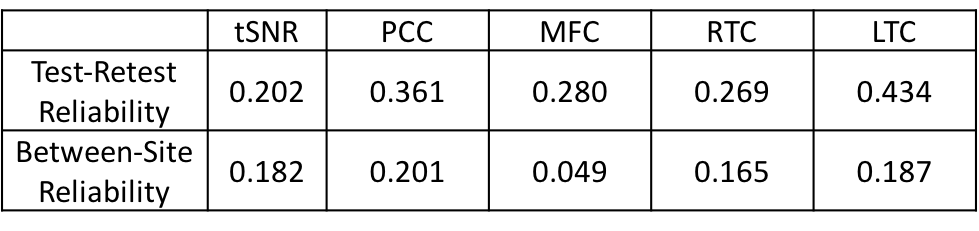
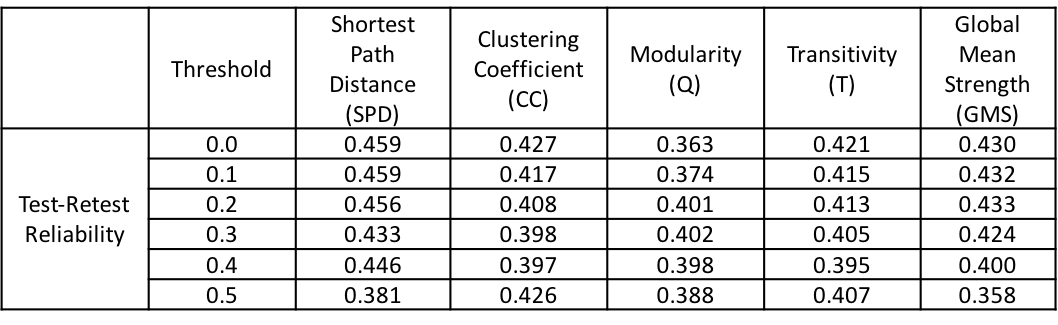
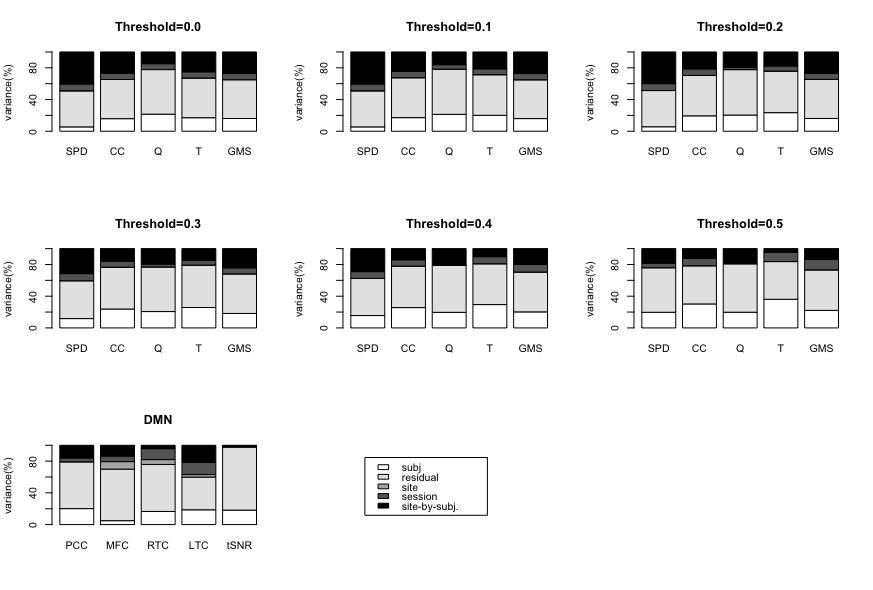
Table1-3 presents the test-retest and between-site reliability values for tSNR, DMN and network measures. Test-retest reliability was found to be poor to fair7 whereas between-site reliability was poor for all measures. The between-site reliability for network measures increased with the correlation threshold. Figure 2 depicts the percentage variance of each component in the model for DMN and network measures at all threshold levels.Discussion
Lower test-retest reliability values for tSNR suggests larger variation among imaging sessions and runs for a given site and could be the likely cause of the poor reliability for all measures. Poor reliability for between-site reliability indicates a strong contribution from site and site-by-subject variance components. That said, between-site reliability exhibited an increasing trend with correlation threshold for network measures, signifying that stronger connections are more likely to be stable across sites. Noise measurements from phantoms and better tSNR control may help to regularize the data and increase reliability.Conclusion
Despite the synchronization of rs-fMRI acquisition protocol across sites, the DMN and network measures yielded at most fair test-retest, but poor between-site, reliability. This calls for better metrics and noise control measurements when comparing or contrasting rs-fMRI data across sites.Acknowledgements
The authors would like to thank Dr. Gregory Tamer, Jr., Xianglun Mao, Nicole Vike, Liesl Krause, and Jana Vincent for assistance in data collection. This work was partially supported by a grant from the Indiana Clinical and Translational Sciences Institute Neuroscience Strategic Research Initiative.References
- Abbas, Kausar, et al. "Alteration of default mode network in high school football athletes due to repetitive subconcussive mild traumatic brain injury: a resting-state functional magnetic resonance imaging study." Brain connectivity 5.2 (2015): 91-101.
- Cox, Robert W. "AFNI: software for analysis and visualization of functional magnetic resonance neuroimages." Computers and Biomedical research 29.3 (1996): 162-173.
- Jenkinson, Mark, et al. "Fsl." Neuroimage 62.2 (2012): 782-790.
- Smith, Stephen M. "Fast robust automated brain extraction." Human brain mapping 17.3 (2002): 143-155.
- Shen, Xilin, et al. "Groupwise whole-brain parcellation from resting-state fMRI data for network node identification." Neuroimage 82 (2013): 403-415.
- Friedman, Lee, et al. "Test–retest and between‐site reliability in a multicenter fMRI study." Human brain mapping 29.8 (2008): 958-972.
- Cicchetti, Domenic V. "Guidelines, criteria, and rules of thumb for evaluating normed and standardized assessment instruments in psychology." Psychological assessment 6.4 (1994): 284.
Figures