5471
Using Hierarchical Clustering Method to Reveal the Formation of Sub-groups among Subjects at Frontal Cortex in fMRI study with Complex Natural Stimulus1Graduate Institute of Biomedical Electronics and Bioinformatics, National Taiwan University, Taipei, Taiwan, 2Institute of Biomedical Engineering, National Taiwan University, Taipei, Taiwan, 3Department of Medical Imaging, Taipei Medical University-Shuang Ho Hospital, New Taipei, Taiwan, 4Department of Neuroscience and Biomedical Engineering, Aalto University, Espoo, Finland
Synopsis
The inter-subject correlation (ISC) analysis which is widely used in functional magnetic resonance imaging (fMRI) studies with complex natural stimulus design. It has been reported that relatively lower ISC value at higher cognitive brain areas could be inferred for individual variability. This study proposed the hierarchical clustering analysis method to discover the formation of sub-groups which showed positive correlation within the sub-group members but negative or non-correlation between the sub-groups among subjects. We found that the existence of sub-groups among whole subjects rather than non-correlation at frontal cortex. The synchronized brain activity could be found at frontal cortex within each sub-group.
INTRODUCTION
Brain areas underpinning the process of complex and naturalistic stimuli can be revealed by studying correlation of local BOLD signal time series from subject pairs1. High inter-subject correlation (ISC) has been typically found at the sensory cortex2. Lower but significant ISC has also been reported at higher order areas3,4, potentially caused by individual variability4.
Here we hypothesize that individual variability can lead to the formation of sub groups, such that significant synchronized brain activity exists within each sub-group, while all subjects have negligibly or negatively correlated brain activity. We propose to use a hierarchical clustering method5,6 to first identify sub-groups that demonstrate differently synchronized brain activity and then analysis of natural stimuli, and to investigate the existence of sub-groups which could not reveal by ISC.
METHOD
Ten right-handed healthy adults (age from 24±2.6) familiar with the game League of Legend (Riot Games, 2009) participated in this experiment. Each subject was scanned on a 3T MRI scanner (Skyra, Siemens) with a 32-channel head coil array. T1-weighted Brain structural images were acquired (MPRAGE; TR/TE = 2530/3.03(ms), FOV = 256 mm, flip angle = 7o, matrix size = 224256, voxel size = 1.0 mm3, GRAPPA acceleration = 2).
In the film fMRI session, participants were instructed to watch the video clips edited from the recorded game (League of Legend). For the resting fMRI session, participants were instructed to fixate their eyes on a cross at the center of the screen. The fMRI data were acquired by T2*-weighted echo-planar imaging (EPI) sequence (TR/TE = 2000/30 ms, flip angle = 90o, matrix size = 128128, slice numbers = 32, voxel size = 4x4x4 mm3; total acquisition time = 15’00” and 4’00” for film and resting sessions, respectively). The fMRI data from each subject were preprocessed with SPM87, including motion correction, slice timing correction, spatial smoothing (5 mm FWHM) and spatial normalization to the MNI template. We calculated the voxel-wise Pearson’s correlation coefficient (r) for time series fMRI data across subjects. The ISC value at each brain location was calculated as the t-statistics over Fisher z-transformed r’s from all subject pairs.
Hierarchical clustering analysis used the Unweighted Pair Group Method with Arithmetic Mean (UPGMA) method8 with the distance d=1-r. The distance between two clusters A and B was calculated by dc=1/(NA*NB)*∑∑d(x,y) where x were members in A and y were members in B, and NA, NB represented the numbers of members in A and B. After clustering (Figure 1), to distinguish the existence of sub-groups, we designed 3 steps as follows:
Step1: To exclude the positive correlation between sub-groups , we calculated the maximum dc(Figure 1; distance represented by the red horizontal line) in the resting session as the null hypothesis H01. We defined a significant threshold distance D while P(D≤dc|H01)<0.05. In the film session, the voxels with maximum dc>D were regarded as potential existence of sub-groups for not rejecting the none/negative correlation between sub-groups.
Step2: To further examine the positive correlation within sub-groups, we calculated summation of the difference of distance (SΔd) between maximum dc and both links connected with it (Figure 1; summation of the two blue vertical lines) in resting session as the null hypothesis H02. A threshold ts was defined by P(ts≥SΔd|H02)<0.05. The voxels in the film session with SΔd>ts indicated the significant positive correlation within sub-groups and regarded as another potential existence of sub-groups.
Step3: To test the consistency of the members in each sub-group, we selected the region of interest (ROI) at frontal cortex by the intersection of the two potential sub-groups above and examined the correlation between subject pairs across voxels by t-statistics over Fisher z-transformed r’s (Figure 2b-left).
RESULT & DISCUSSION
Significant positive correlation within specific subjects and negative correlation between them, which matched the definition of sub-groups, revealed at the voxels in frontal cortex (Figure 2b-left).
We also examined the visual cortex selected by the peak ISC value with 12mm sphere (Figure 2a, blue), which showed significant positive correlation between whole subjects among voxels but no sub-groups existed.
We further classified subjects into two groups based on the sub-group formation, and applied ISC analysis for each separately. The significant ISC at frontal cortex were revealed within both sub-groups (Figure 3, p<0.005, k>30).
CONCLUSION
ISC of whole subjects in the frontal cortex could be biased by individual variation4,9. We separated subjects into two sub-groups based on the distance by hierarchical clustering. The result suggested that the ISC at frontal cortex could be revealed by dividing the whole subjects into the sub-groups based on their similarity and calculating ISC, respectively.Acknowledgements
This work was partially supported by Ministry of Science and Technology, Taiwan (103-2628-B-002-002-MY3, 105-2221-E-002-104), and the Academy of Finland (No. 298131).References
1. Bartels, A. & Zeki, S. (2004), Functional brain mapping during free viewing of natural scenes
2. Abrams, D. A., S. Ryali, T. Chen, P. Chordia, A. Khouzam, D. J. Levitin and V. Menon (2013), Inter-subject synchronization of brain responses during natural music listening
3. Hasson, U. (2004), Intersubject Synchronization of Cortical Activity During Natural Vision
4. Hasson, U., O. Furman, D. Clark, Y. Dudai and L. Davachi (2008), Enhanced Intersubject Correlations during Movie Viewing Correlate with Successful Episodic Encoding
5. Hartigan JA. Clustering algorithms. John Wiley & Sons, 1975.
6. Matlab, Statistical toolbox. The MathWorks, Inc. HTTP://www- .mathworks.com
7. SPM8, Wellcome Department, University College London, UK; http://www.fil.ion.ucl.ac.uk/spm/software/spm8/)
8. Sokal R and Michener C (1958). "A statistical method for evaluating systematic relationships"
9. Erik D. Lumer (1998), Neural Correlates of Perceptual Rivalry in the Human Brain
Figures
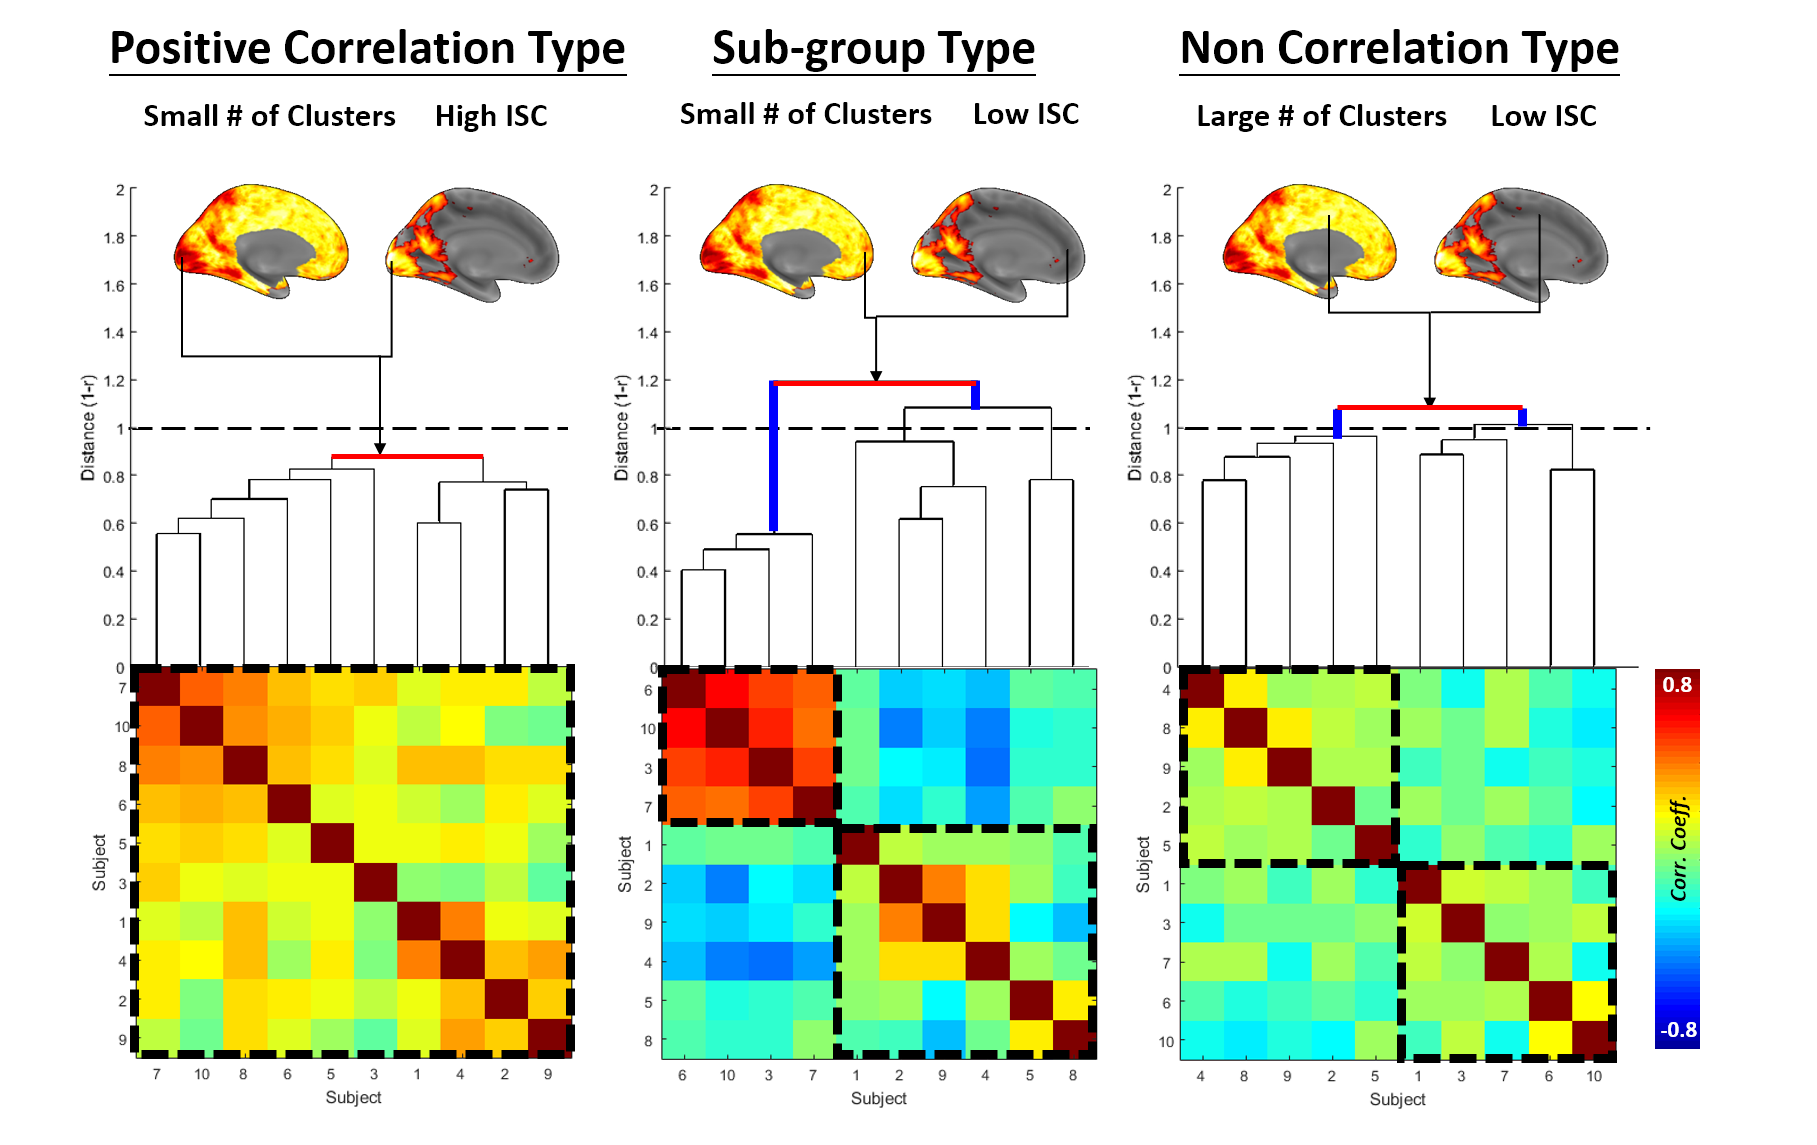
Figure 1. The three possible types of relationship between subjects.
The dendrogram (middle row) generated by hierarchical clustering and the correlation matrix (bottom row) showed the similarity of brain activity between subject pairs in the three types.
Dendrogram: The red line meant the maximum dc. The black dashed-line represented the cut-off distance D determined by resting session. The straight blue lines stood for the delta distance SΔd. Correlation matrix: The dotted black frame represented the potential existence of sub-groups.
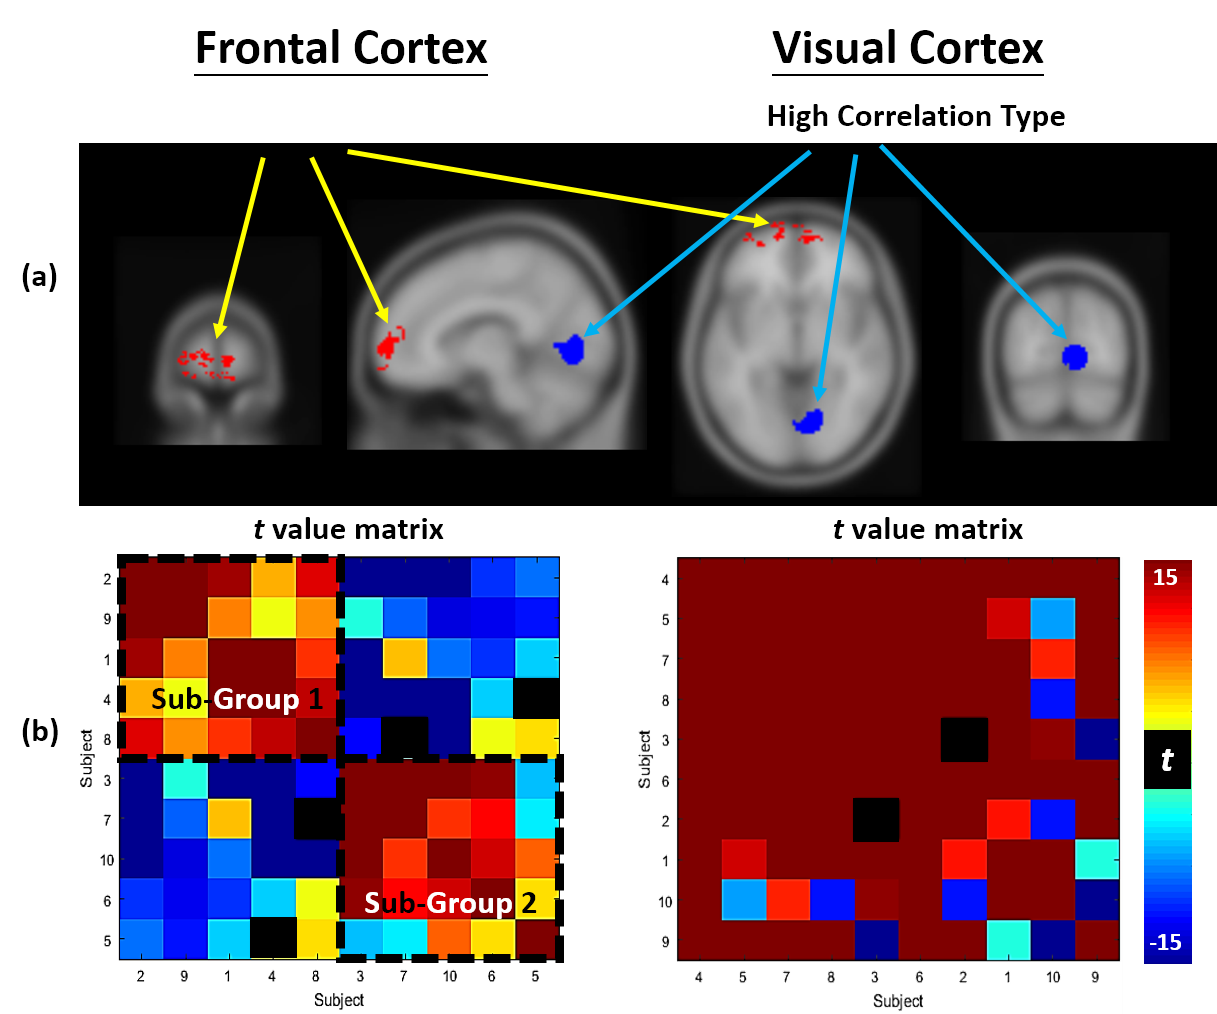
Figure 2. The consistently correlated between subject pairs within selected ROI
a) The red mark regions represented the voxels classified as the sub-group type at frontal cortex (729voxels). The blue mark regions were selected by the peak ISC value at visual cortex with 12mm sphere (620voxels).
b) The higher t value represented the more consistently correlated between subject pairs among all voxels within selected ROI, at frontal/visual cortex. The black-dashed frame labeled the existence of sub-groups
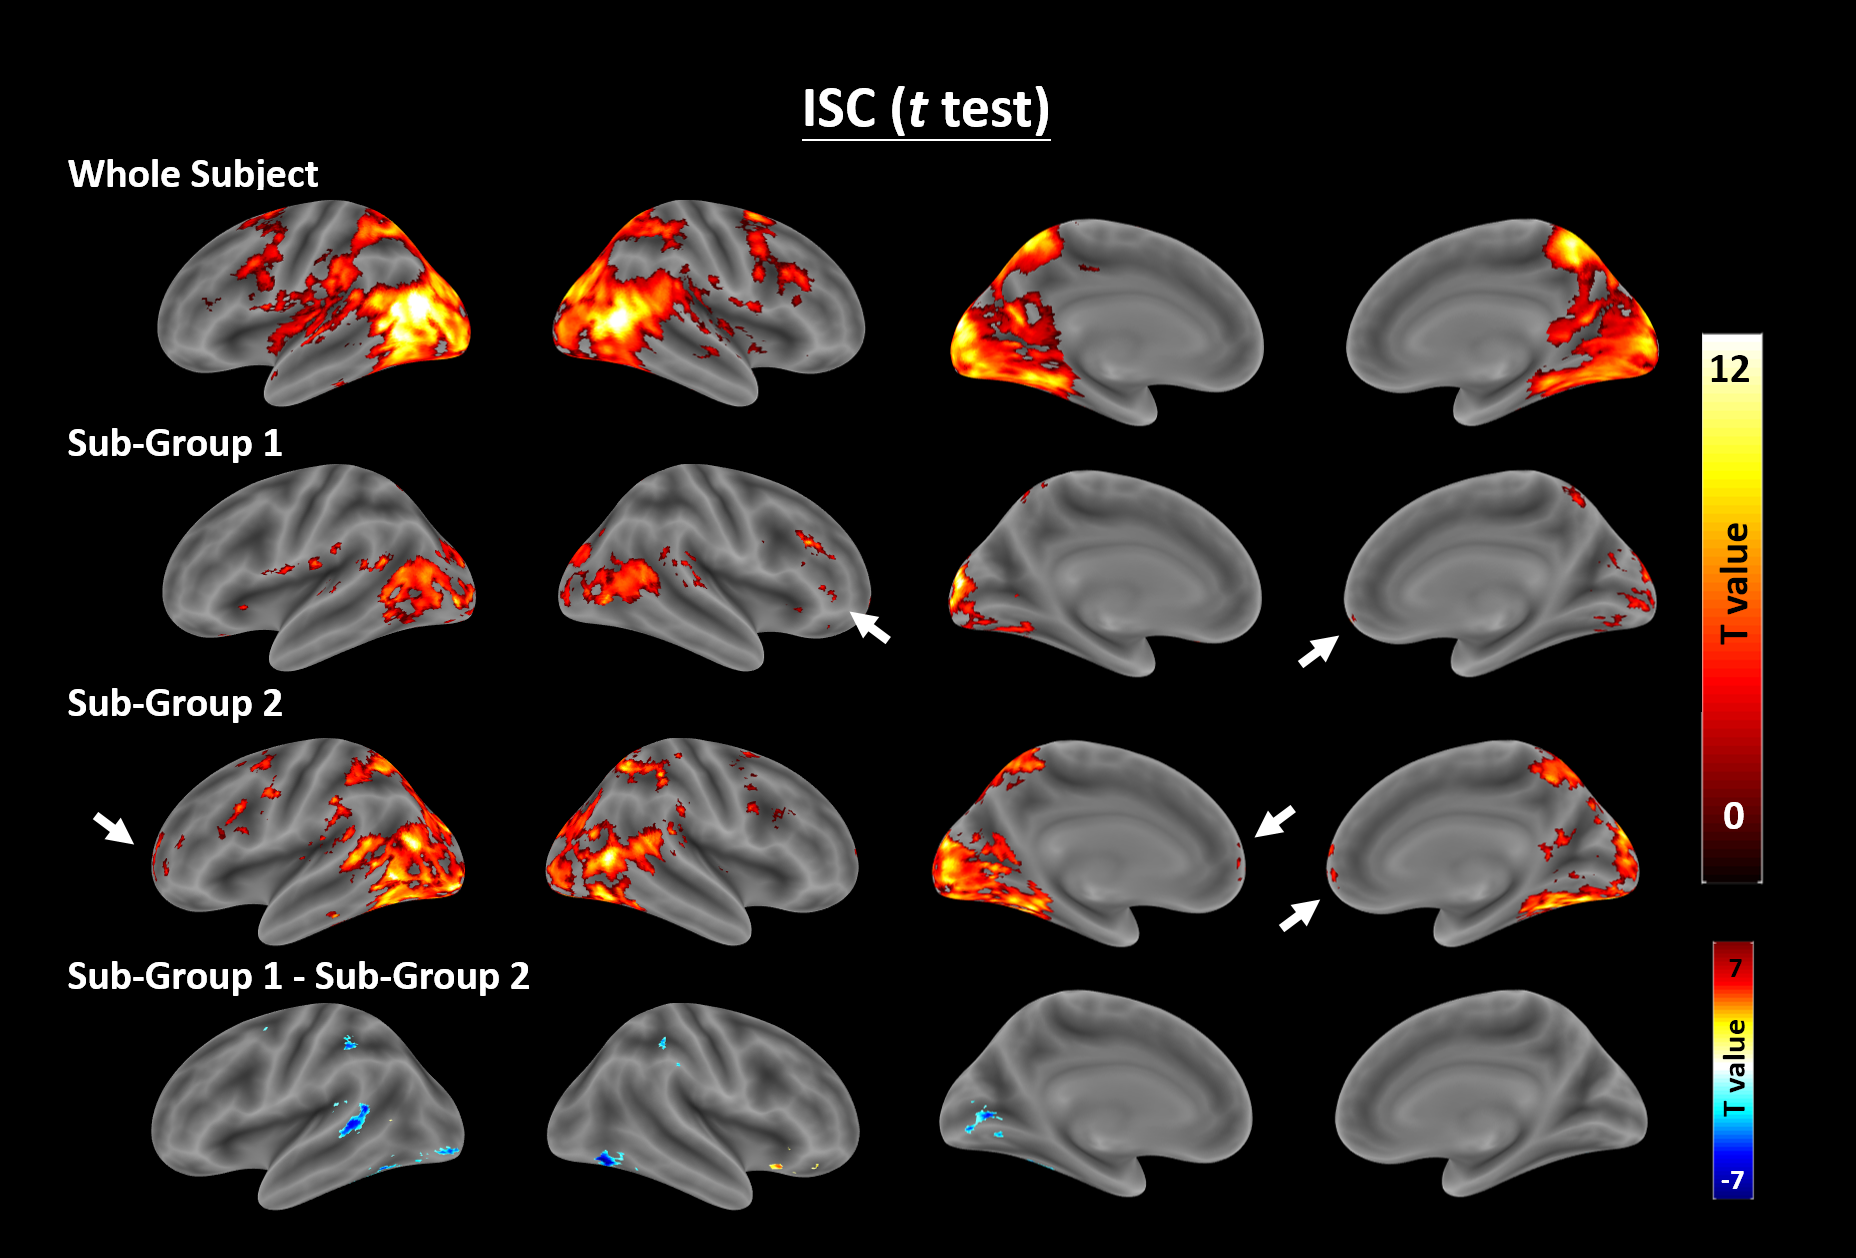
Figure 3. The ISC results of the whole subjects (the first row), the sub-group 1 (the second row) and the sub-group 2 (the third row), as well as the significant ISC difference between the two subgroups.
The ISC result within sub-group 1 and sub-group 2 both revealed some significant correlation at frontal cortex which could not be revealed by ISC within whole subjects as a group.