5470
Comparison of the functional correlation tensor under eyes closed and eyes open conditions1GE Healthcare China, Beijing, China, 2Center for Medical Device Evaluation, CFDA, Beijing, China
Synopsis
Recently, a novel technique was proposed directly integrated resting-state fMRI and DTI techniques to construct a local spatio-temporal correlation tensor from resting state fMRI data, termed as the functional correlation tensor. Previous studies demonstrated that resting-state fMRI properties varied from different resting conditions, such as eyes closed, eyes open and fixation. However, whether the functional correlation tensor will be affected by different baseline conditions is still need to be investigated. In this study, group-level properties of the functional correlation tensor were assessed and compared under eyes closed and eyes open conditions.
Introduction
Resting state functional MRI (R-fMRI) and diffusion tensor imaging (DTI) can in vivo and non-invasively map functional and structural brain networks, respectively [1]. Generally, combining R-fMRI and DTI data could allow us to characterize structure-function relations of distributed neural networks [2]. Recently, a novel technique was proposed directly integrated these two approaches to construct a local spatio-temporal correlation tensor from R-fMRI data [3], termed as the functional correlation tensor. It shows great potential to investigate the relationship between function and structure in human brain [4]. Previous studies demonstrated distinguished R-fMRI properties of both local indices and long-range correlations, even brain networks under different rest conditions, such as eyes closed (EC), eyes open (EO) and fixation [5-7]. However, whether the functional correlation tensor will be affected by different rest conditions is still unknown. The purpose of this study is to investigate group-level properties of the functional correlation tensor under both EC and EO conditions.Methods
R-fMRI images were acquired in Beijing Normal University, which were freely available on f1000 Project website (http://fcon_1000.projects.nitrc.org/indi/IndiPro.html). Forty-eight healthy volunteers were included in this study. R-fMRI images were scanned under both EC and EO conditions. The pre-processing steps were conducted for both conditions, including slice timing correction, head motion correction and spatial normalization to MNI space. After that, a global time course was removed through intensity normalization and a band-pass filter was applied with a cutoff frequency of 0.1 Hz. Then, the functional correlation tensor was voxel-wisely reconstructed using the method in ref. 3. Tensorial indices such as FA and Trace were computed for each subject of both conditions. Paired t-test was used to assess between-condition difference of FA and Trace. The threshold was set as FWE corrected p < 0.05.Results
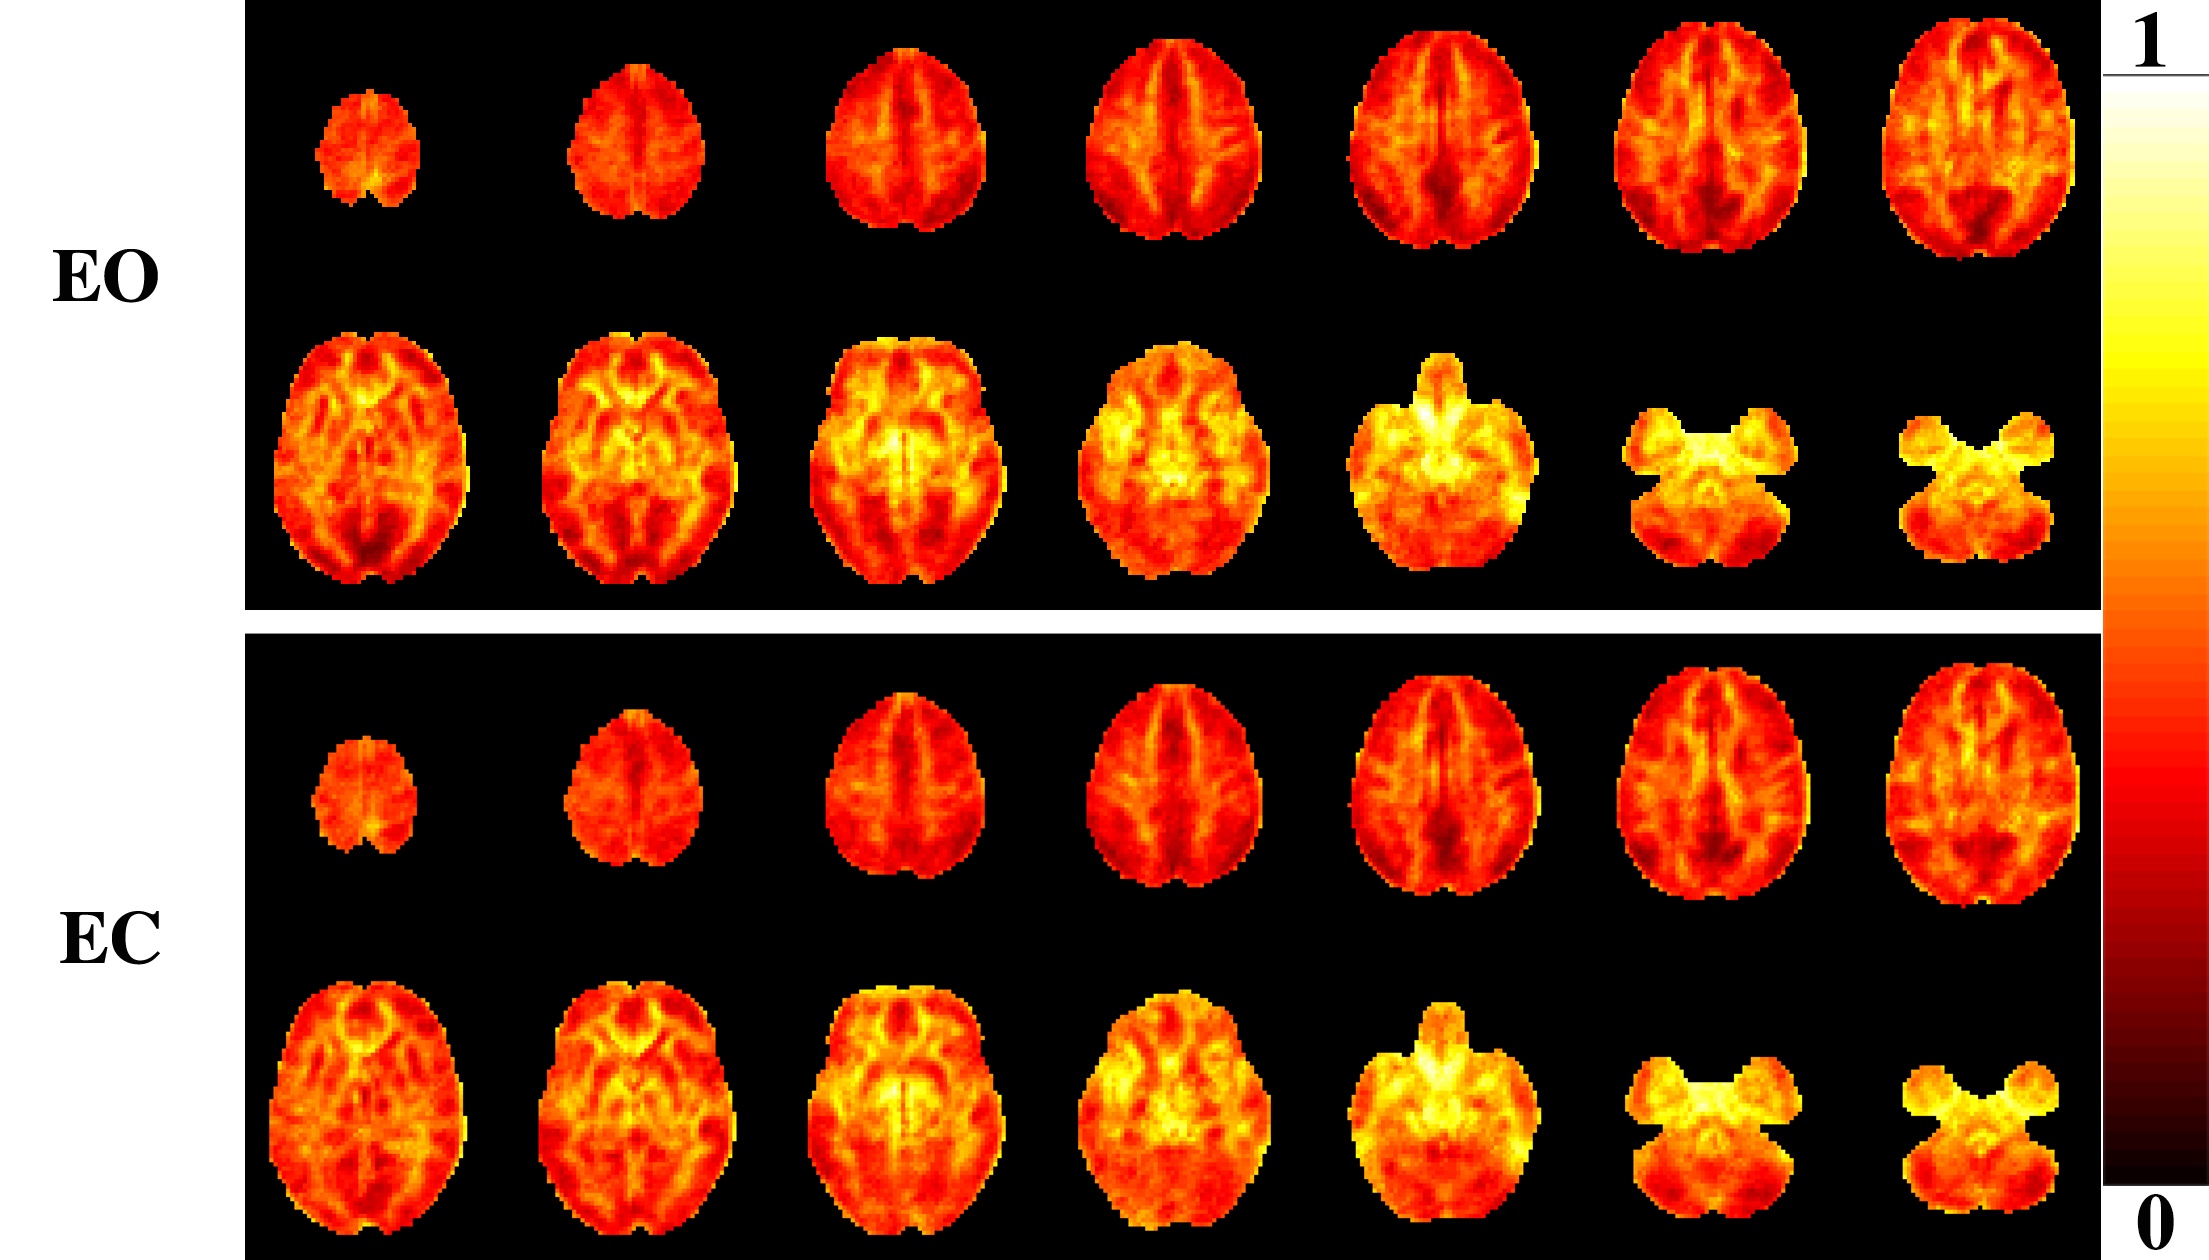
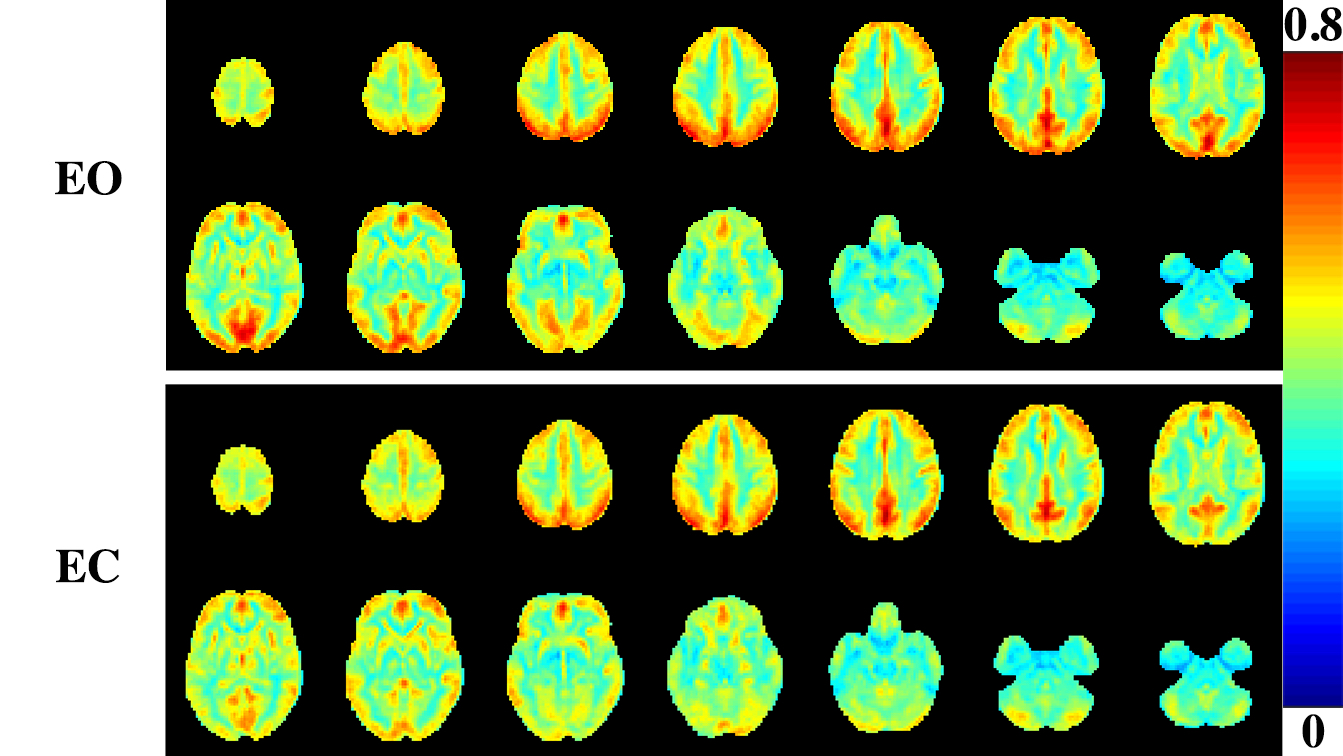
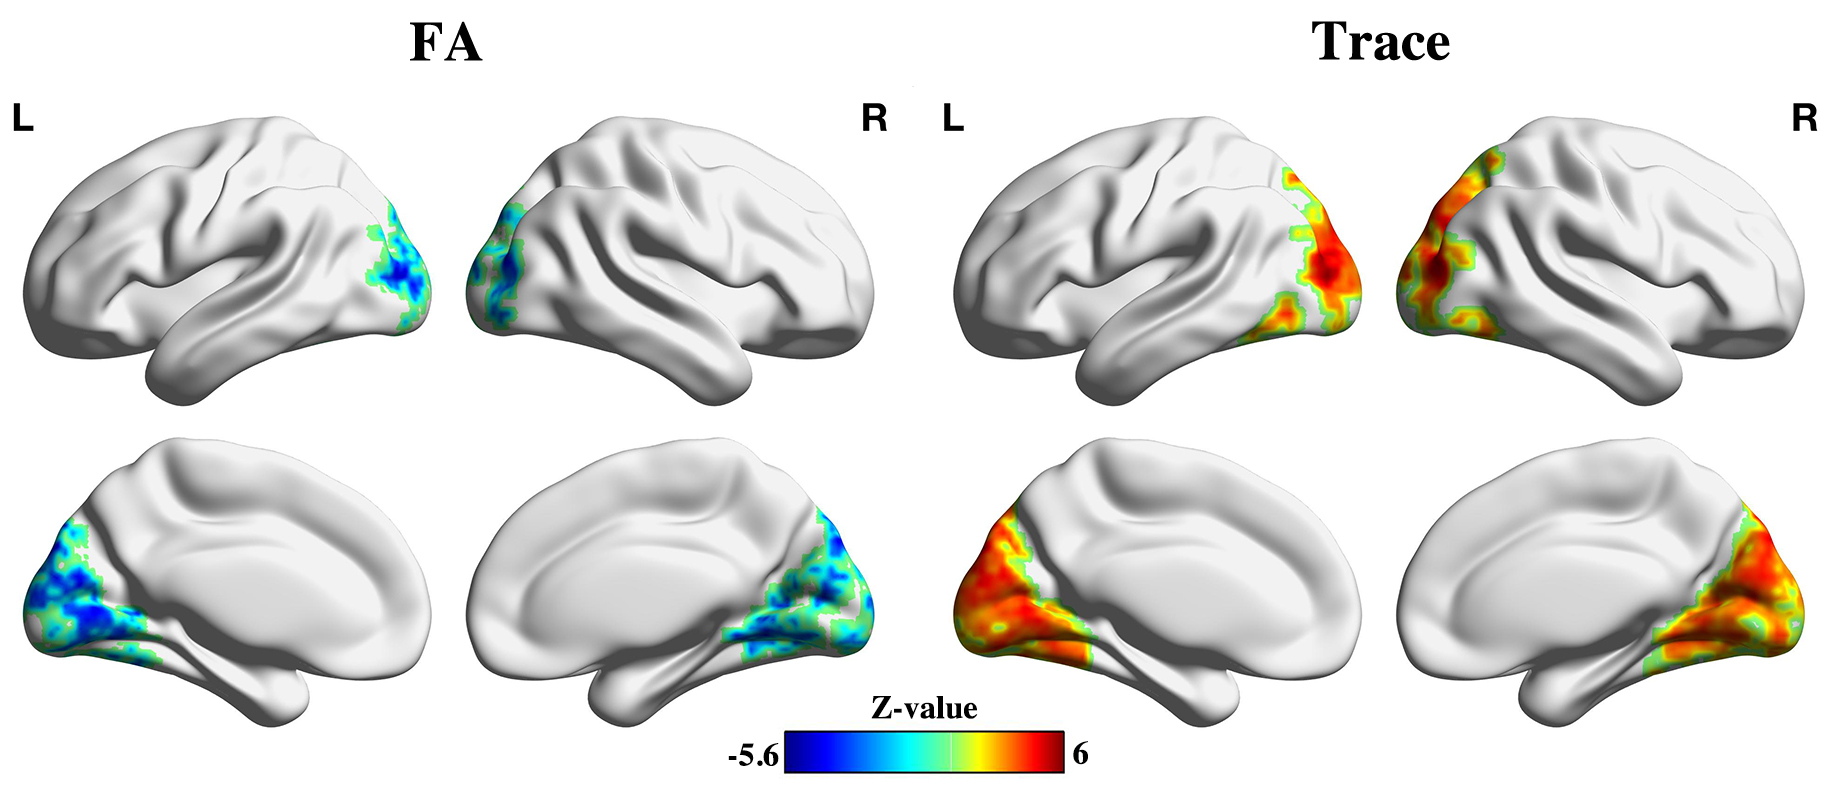
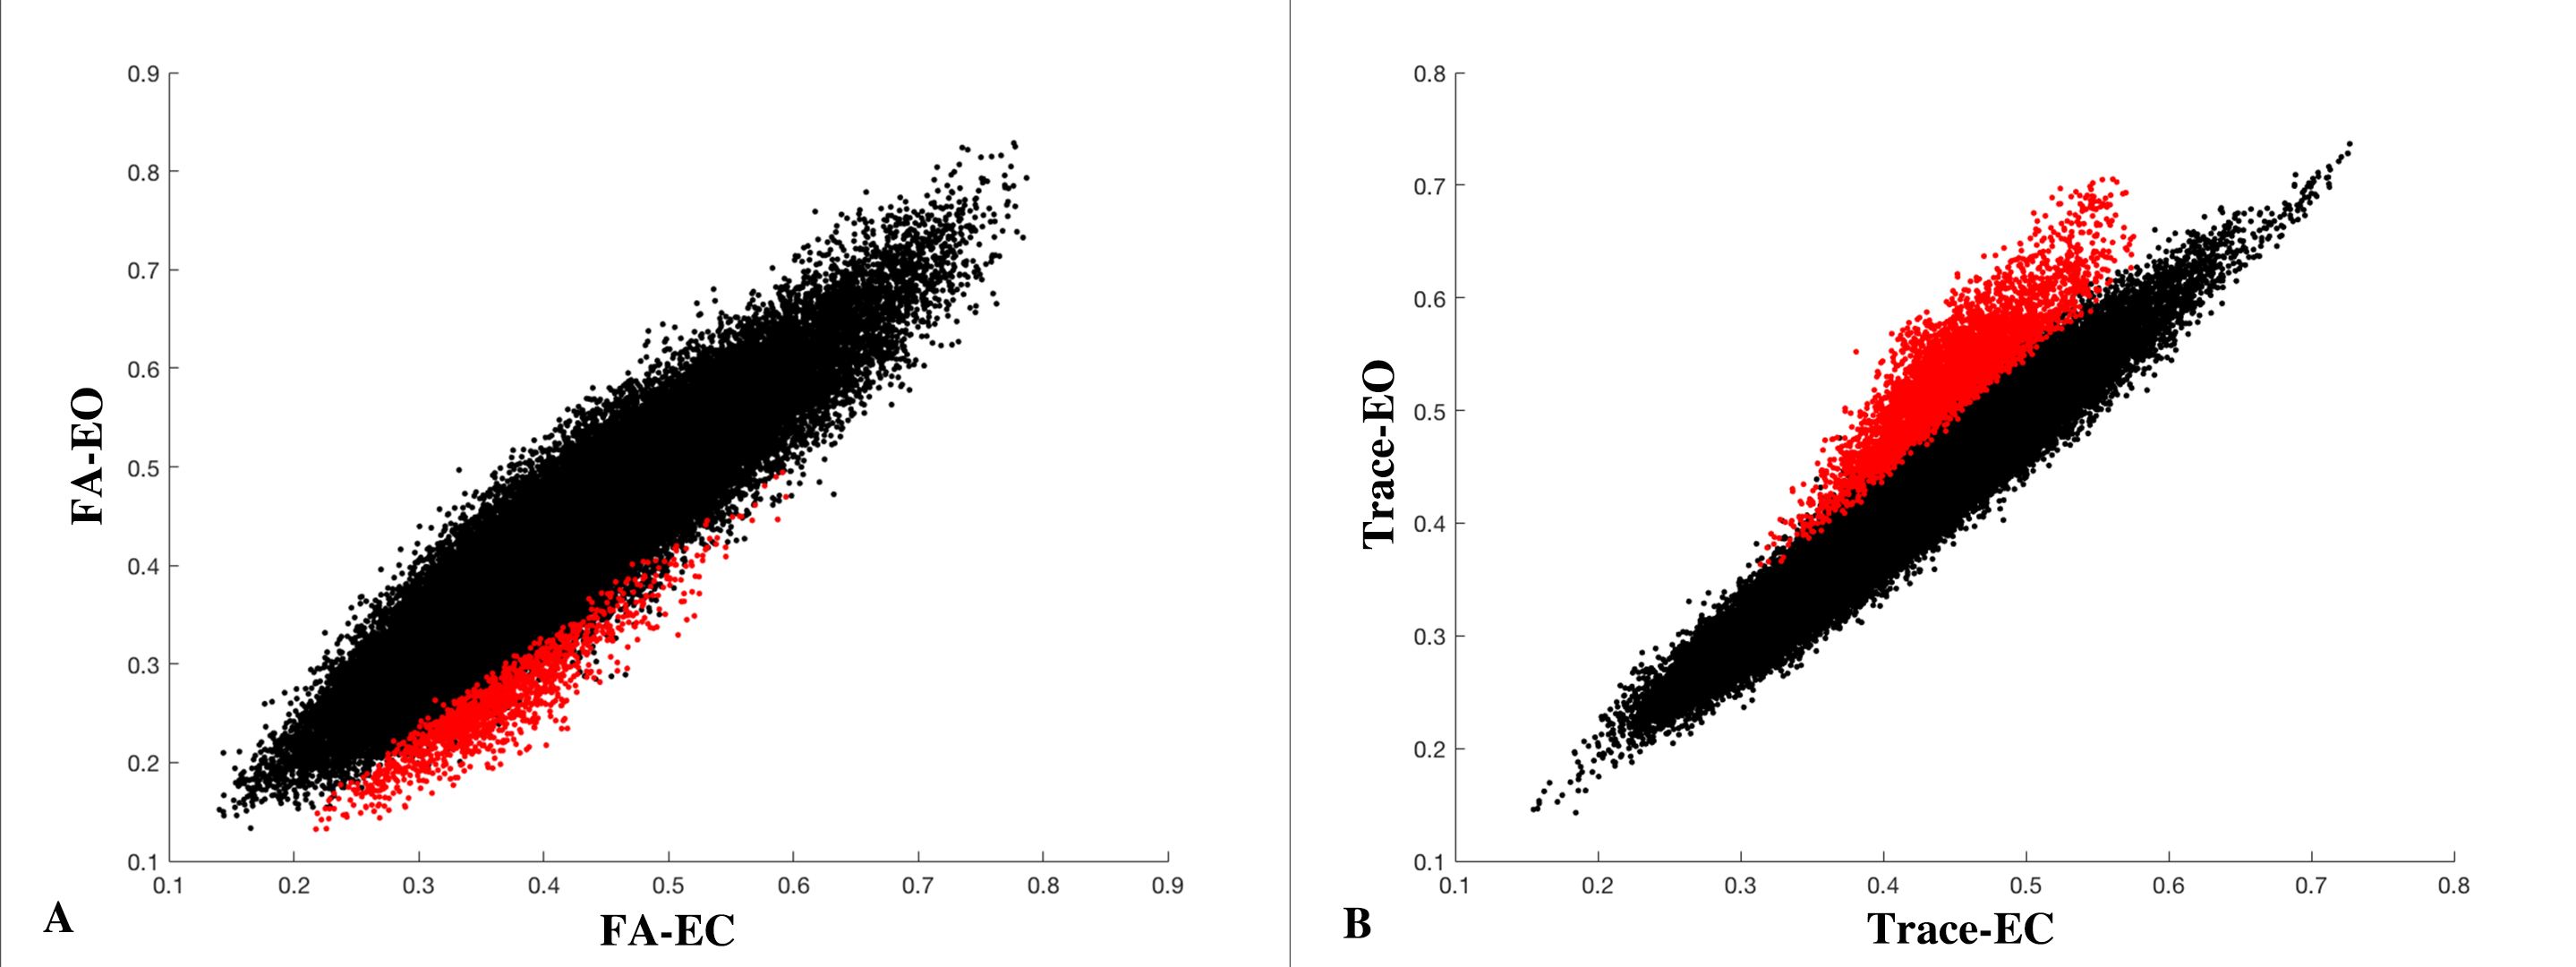
The group averaged FA maps of the functional correlation tensor under EO and EC conditions were shown in Fig. 1. It can be seen that the FA value from white matter (WM) was significant higher than that of gray matter (GM). It was similar to the FA contrast of DTI. The group mean Trace maps of the functional tensor of both conditions were demonstrated in Fig. 2. We can see that typically the GM has higher Trace value than WM for both conditions, especially for regions from default mode network (DMN), like precuneus cortext (PCC) and medial prefrontal cortex (MPFC). Visually, both mean FA and Trace maps exhibit significant between-condition differences in visual cortex. Statistically, the results of between-condition differences were shown in Fig. 3. Regions exhibited significant differences between EC and EO conditions were indeed lied in occipital lobe or visual cortex. However, the FA value in visual cortex were decreased in EO condition compared to EC, while the Trace value were increased compared to EC. At last, the EO vs. EC scatter plots of regions showed significant between-condition difference (red dots) and any other voxels of the whole brain (black dots) for both FA and Trace were shown in Fig. 4. Besides visual cortex (red dots), there were good consistency between EC and EO for other cortical regions (black dots).Discussion and Conclusions
In this study, deceased FA and increased Trace values were found in visual cortex under EO condition compared to EC. Under EO condition, neurons in visual cortex are highly synchronous. Thus, it may lead to increased temporal correlation or functional connectivity in visual cortex under EO than EC. The increased correlation can cause elevated Trace value, which indicates the mean correlation value between a given pixel and neighborhood pixels. Also, the decreased FA value in visual cortex may due to this reason. In conclusion, properties of the functional correlation tensor are slightly modulated by different rest conditions. It may offer help to further understanding and application of this novel technique.Acknowledgements
No acknowledgement found.References
[1] Bullmore E, Sporns O. Complex brain networks: graph theoretical analysis of structural and functional systems[J]. Nature Reviews Neuroscience, 2009, 10(3): 186-198.
[2] Honey C J, Sporns O, Cammoun L, et al. Predicting human resting-state functional connectivity from structural connectivity[J]. Proceedings of the National Academy of Sciences, 2009, 106(6): 2035-2040.
[3] Ding Z, Newton A T, Xu R, et al. Spatio-temporal correlation tensors reveal functional structure in human brain[J]. PLoS One, 2013, 8(12): e82107.
[4] Ding Z, Xu R, Bailey S K, et al. Visualizing functional pathways in the human brain using correlation tensors and magnetic resonance imaging[J]. Magnetic resonance imaging, 2016, 34(1): 8-17.
[5] Xu P, Huang R, Wang J, et al. Different topological organization of human brain functional networks with eyes open versus eyes closed[J]. Neuroimage, 2014, 90: 246-255.
[6] Yuan B K, Wang J, Zang Y F, et al. Amplitude differences in high-frequency fMRI signals between eyes open and eyes closed resting states[J]. Frontiers in human neuroscience, 2014, 8.
[7] Zou Q, Miao X, Liu D, et al. Reliability comparison of spontaneous brain activities between BOLD and CBF contrasts in eyes-open and eyes-closed resting states[J]. Neuroimage, 2015, 121: 91-105.
Figures