5469
A comparison between amplitude of low frequency fluctuation calculation methods based on R2* signal and traditional T2*-weighted signal1Center for Brain Imaging Science and Technology, Key Laboratory for Biomedical Engineering of Ministry of Education, College of Biomedical Engineering and Instrumental Science, Zhejiang University, Hangzhou, China, 2Center for Cognition and Brain Disorders and the Affiliated Hospital,Zhejiang Key Laboratory for Research in Assessment of Cognitive Impairments, Institutes of Psychological Sciences, Hangzhou Normal University, Hangzhou, China
Synopsis
The amplitude of low frequency fluctuation (ALFF) is usually computed from T2*-weighted functional MRI (fMRI) signals, which is affected by R2* fluctuation, echo time, spin density, and mean R2*. To make ALFF more comparable and reliable between researches, we proposed a new method of ALFF calculation based on R2* (ALFF-R2*) in this work and further implemented for multi-echo fMRI. Statistical results from eyes-open and eyes-closed fMRI datasets show that ALFF-R2* detected an overall smaller significant regions than traditional ALFF in the paired T maps. The dice similarity coefficient between T maps from ALFF-R2* and traditional ALFF was 0.37. ALFF-R2* is potential to provide more specific results than traditional ALFF.
Introduction
Amplitude of low frequency fluctuation (ALFF) characterizes the mean spectral amplitude of low frequency fluctuation in spontaneous brain activity from resting-state fMRI (RS-fMRI)1, and widely used in neuropsychiatric researches2~3. The traditional method for ALFF calculation is based on signals directly from T2*-weighted images1. However, the signal fluctuation is primarily caused by both the fluctuation of R2* and spin density (S0), which is usually believed due to physiological or scanner noise. Moreover, the fMRI signal is affected by echo-time (TE) and the mean R2* of the voxel. To get rid of the effects of S0, TE, and mean R2*, in this study, we proposed a calculation method of ALFF based on R2* fluctuation (ALFF-R2*) and compared it with traditional ALFF method based on T2*-weighed signal with eyes-open (EO) and eyes-closed (EC) RS-fMRI data.Materials and methods
RS-fMRI dataset with EO and EC was obtained in seven healthy subjects (23.6 ± 2.6 years old, 2 females) on a Siemens MAGNETOM Prisma 3T scanner (Siemens Healthcare, Erlangen, Germany). The blood-oxygenation-level-dependent (BOLD) images were acquired using a multi-echo (ME) gradient echo echo-planar imaging pulse sequence with the following parameters: repetition time / TE1 / TE2 / TE2 / TE3 = 2000 / 13 / 30.93 / 48.86 / 66.79 ms, flip angle = 78°, 22 slices with interleaved acquisition, slice thickness/gap = 4/0.8 mm, field of view = 220 × 220 mm2 with an in-plane resolution of 3.44 × 3.44 mm2. The duration of each resting-state fMRI scan was 6 minutes. The T1-weighted images were acquired using a 3D magnetization-prepared rapid-acquisition gradient echo sequence with a resolution of 1×1×1 mm3.
After conventional preprocessing, S0(t) and R2*(t) were firstly obtained by fitting the fMRI data from 4 echoes with $$$S(t)=S0(t)\cdot exp(-R2^{*}(t)\cdot TE)$$$. Then, S0(t) and R2*(t) from four different voxels were selected for simulating the ALFF variation with different TEs. ALFF and ALFF-R2* were computed as the mean spectral power from 0.01~0.08 Hz of fMRI signal and R2* curve, respectively. Before statistical analysis, the ALFF and ALFF-R2* were normalized with the whole-brain mean value for each subject. Afterwards, paired T-test with EO-EC was applied to ALFF from 4 echoes and ALFF-R2* to gain the areas with different brain activity between EO and EC. The T maps of ALFF-R2* and ALFF at TE = 30.93 ms, which were obtained under the threshold of p < 0.05 and cluster size > 50 voxels, were compared with dice similarity coefficient (DSC).
Results
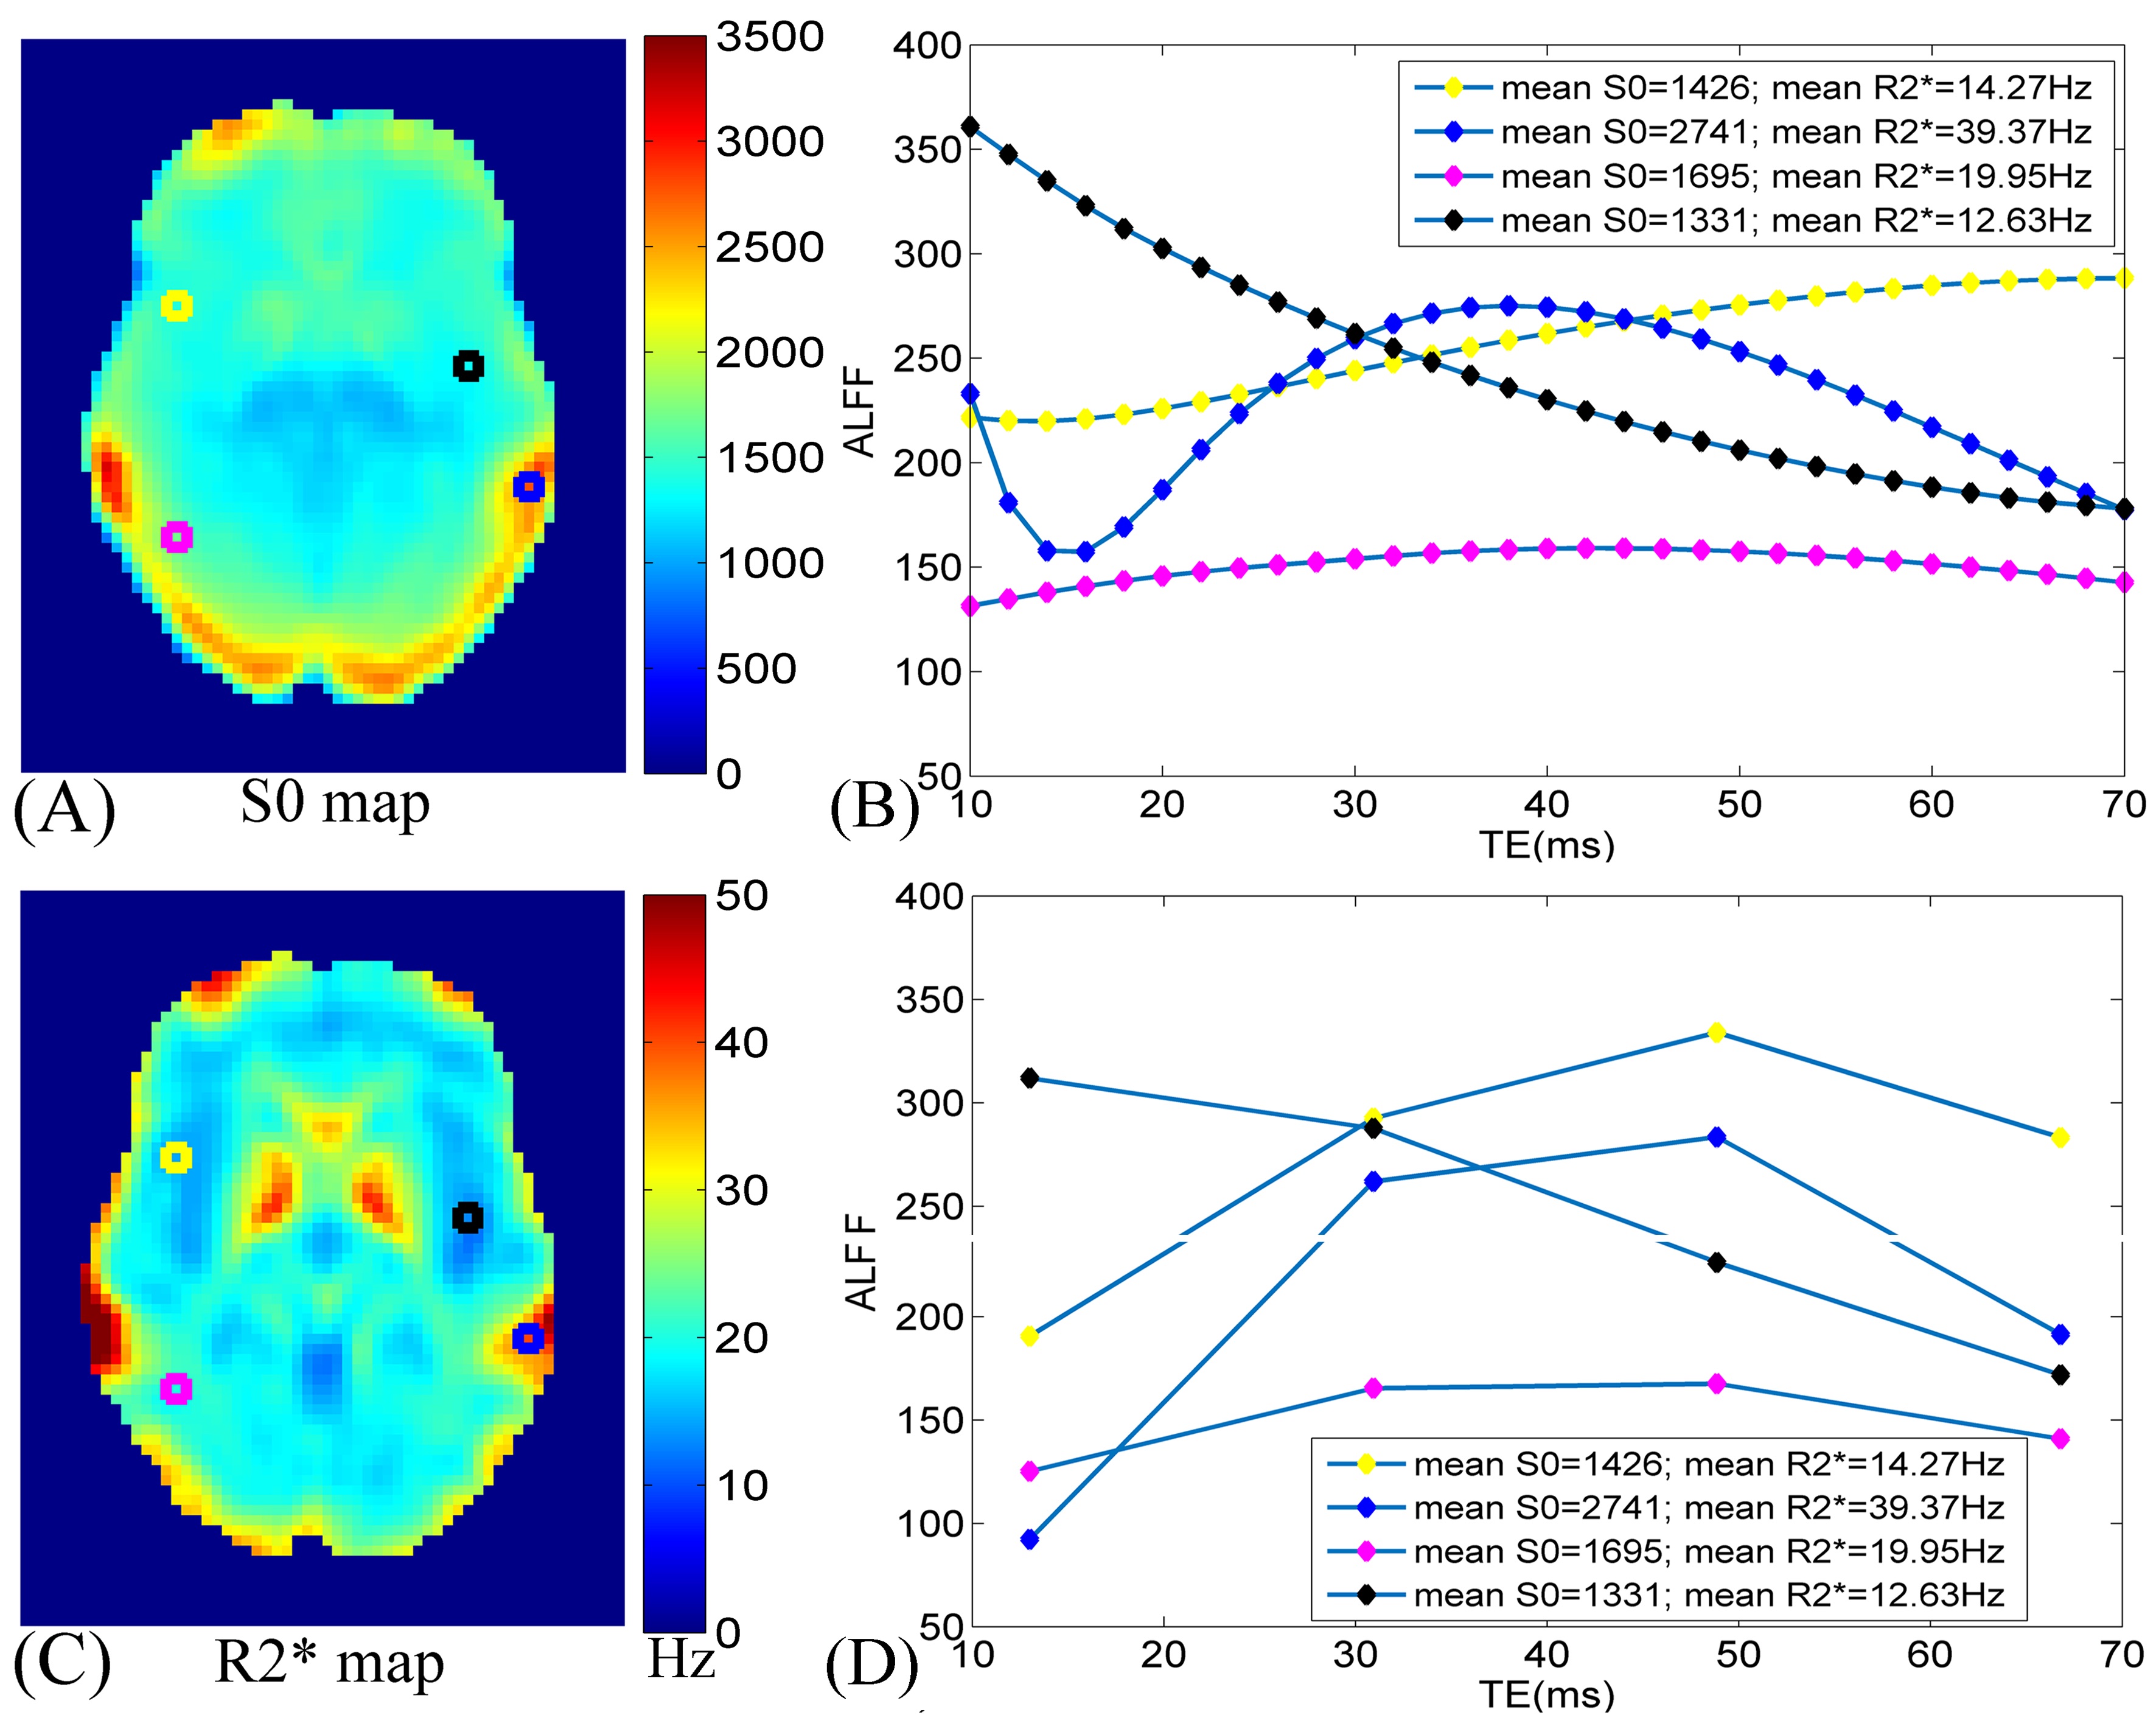
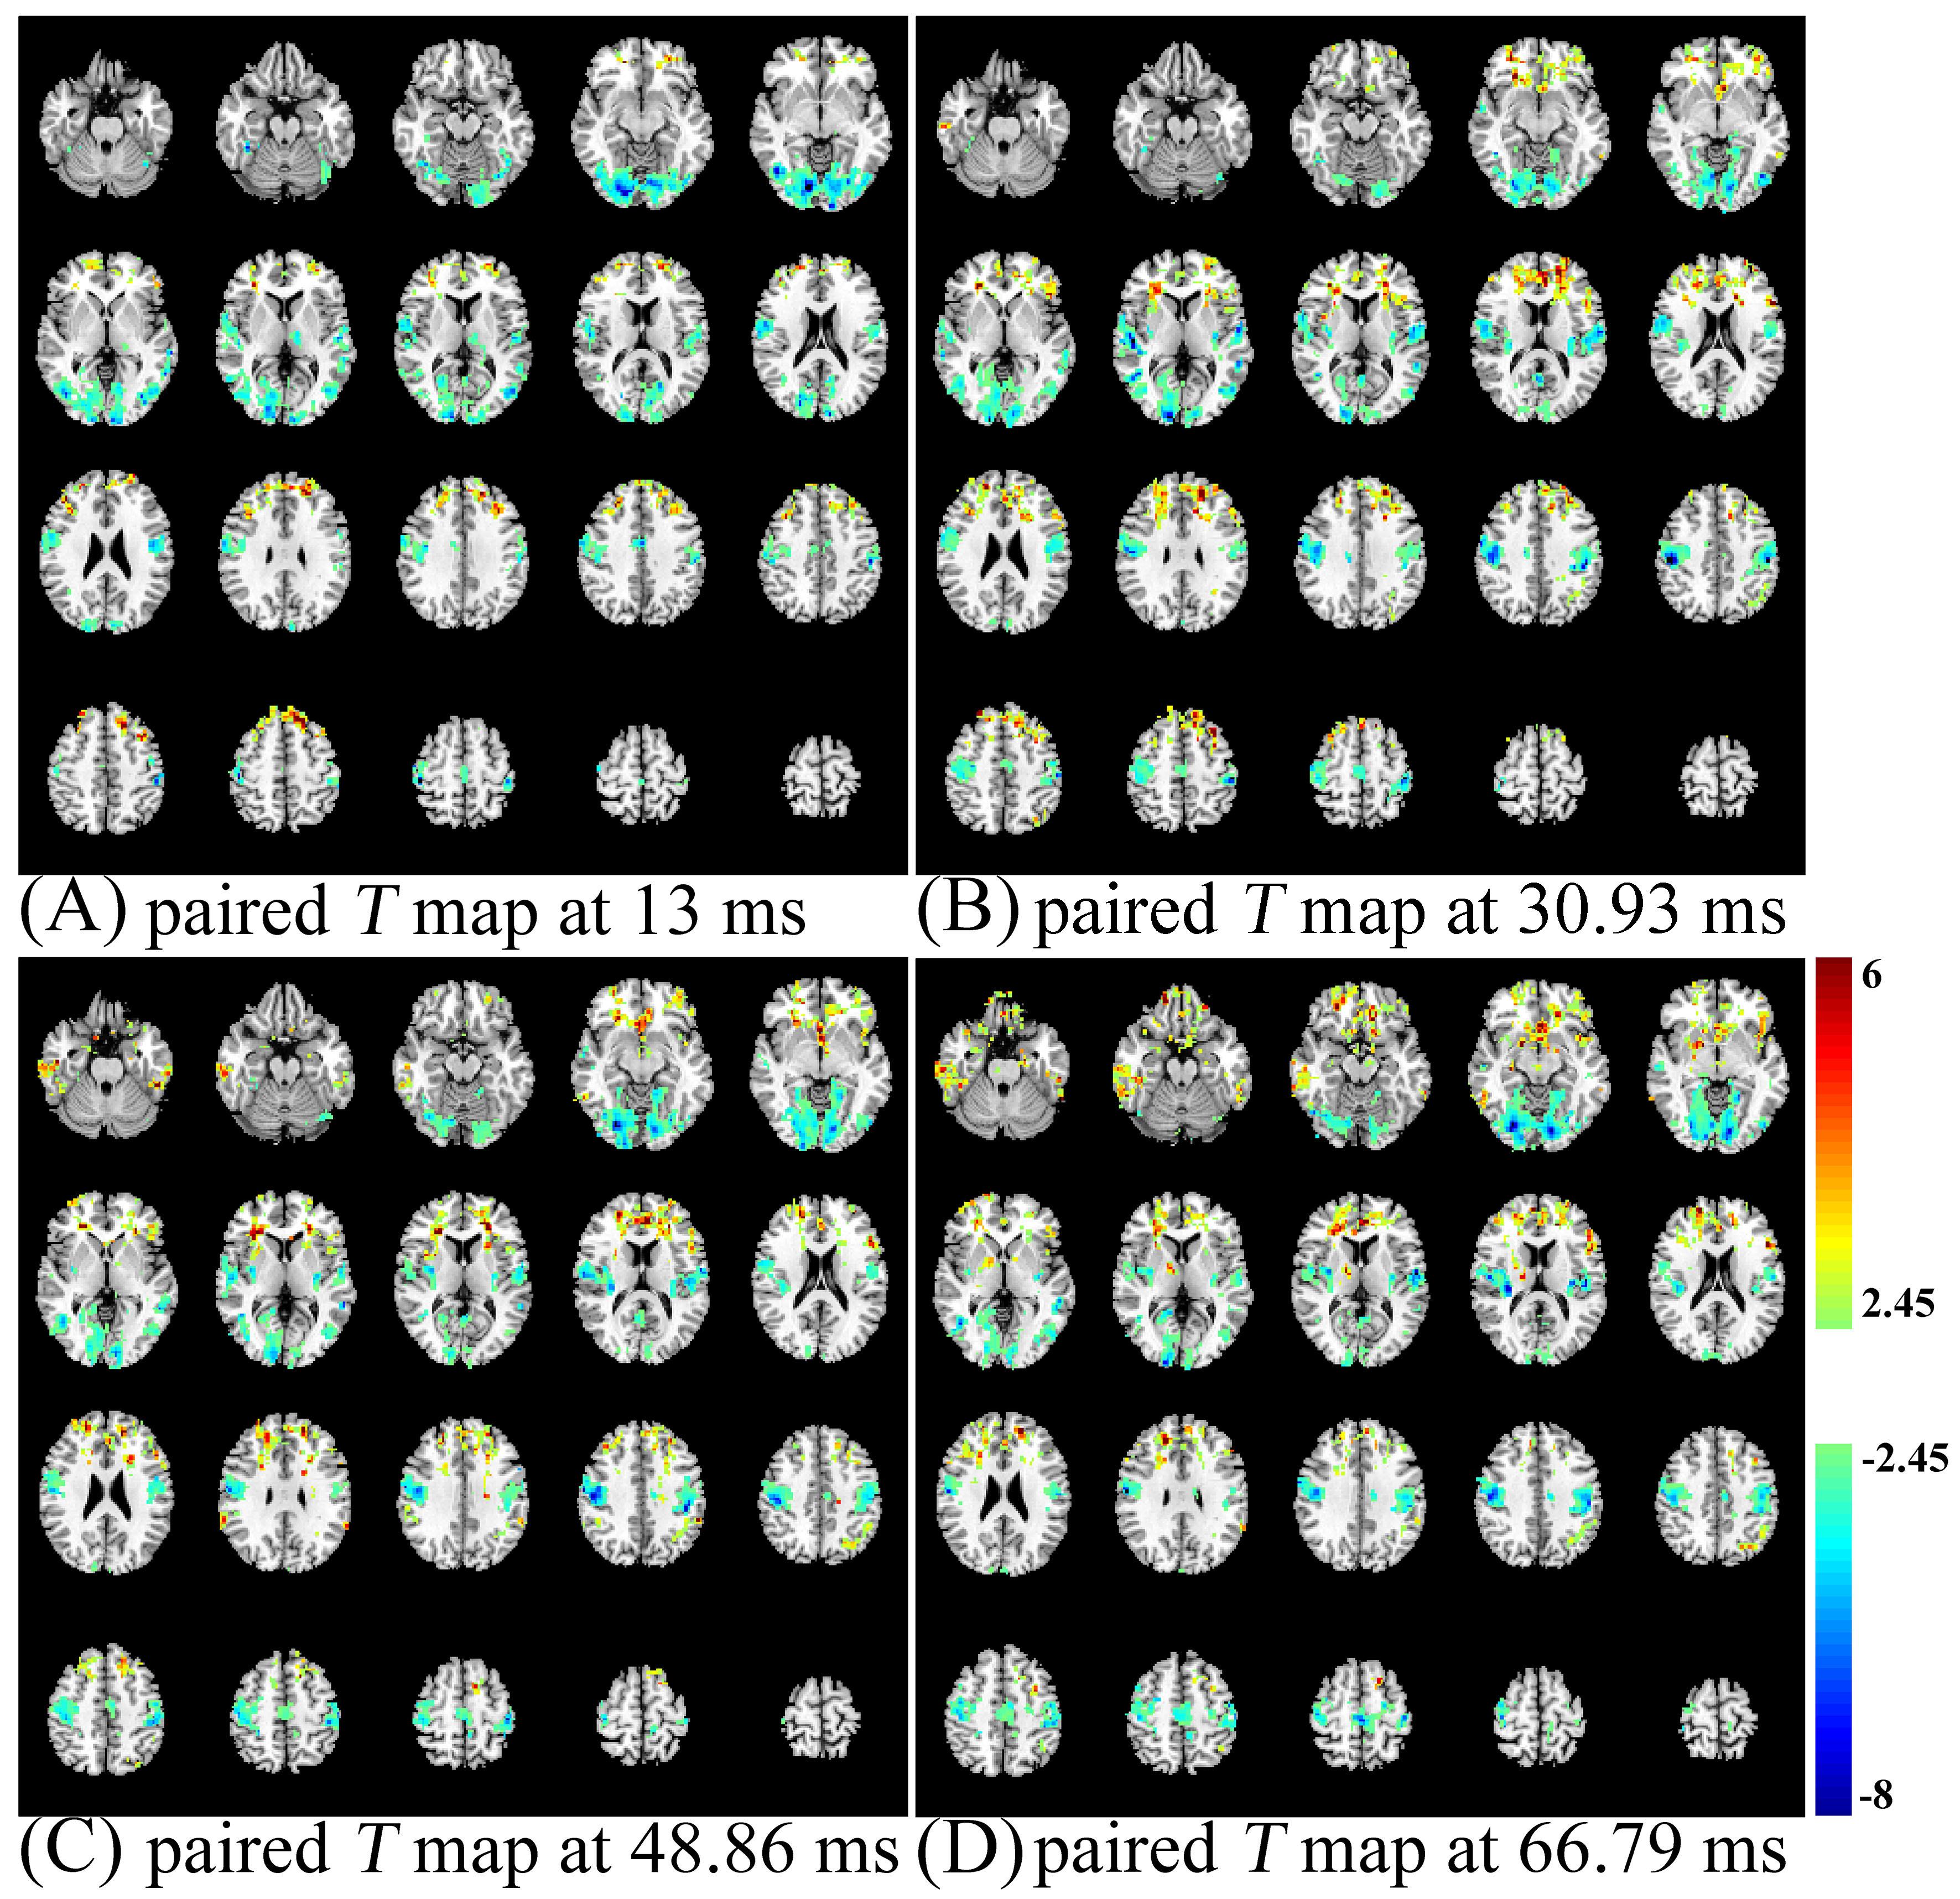
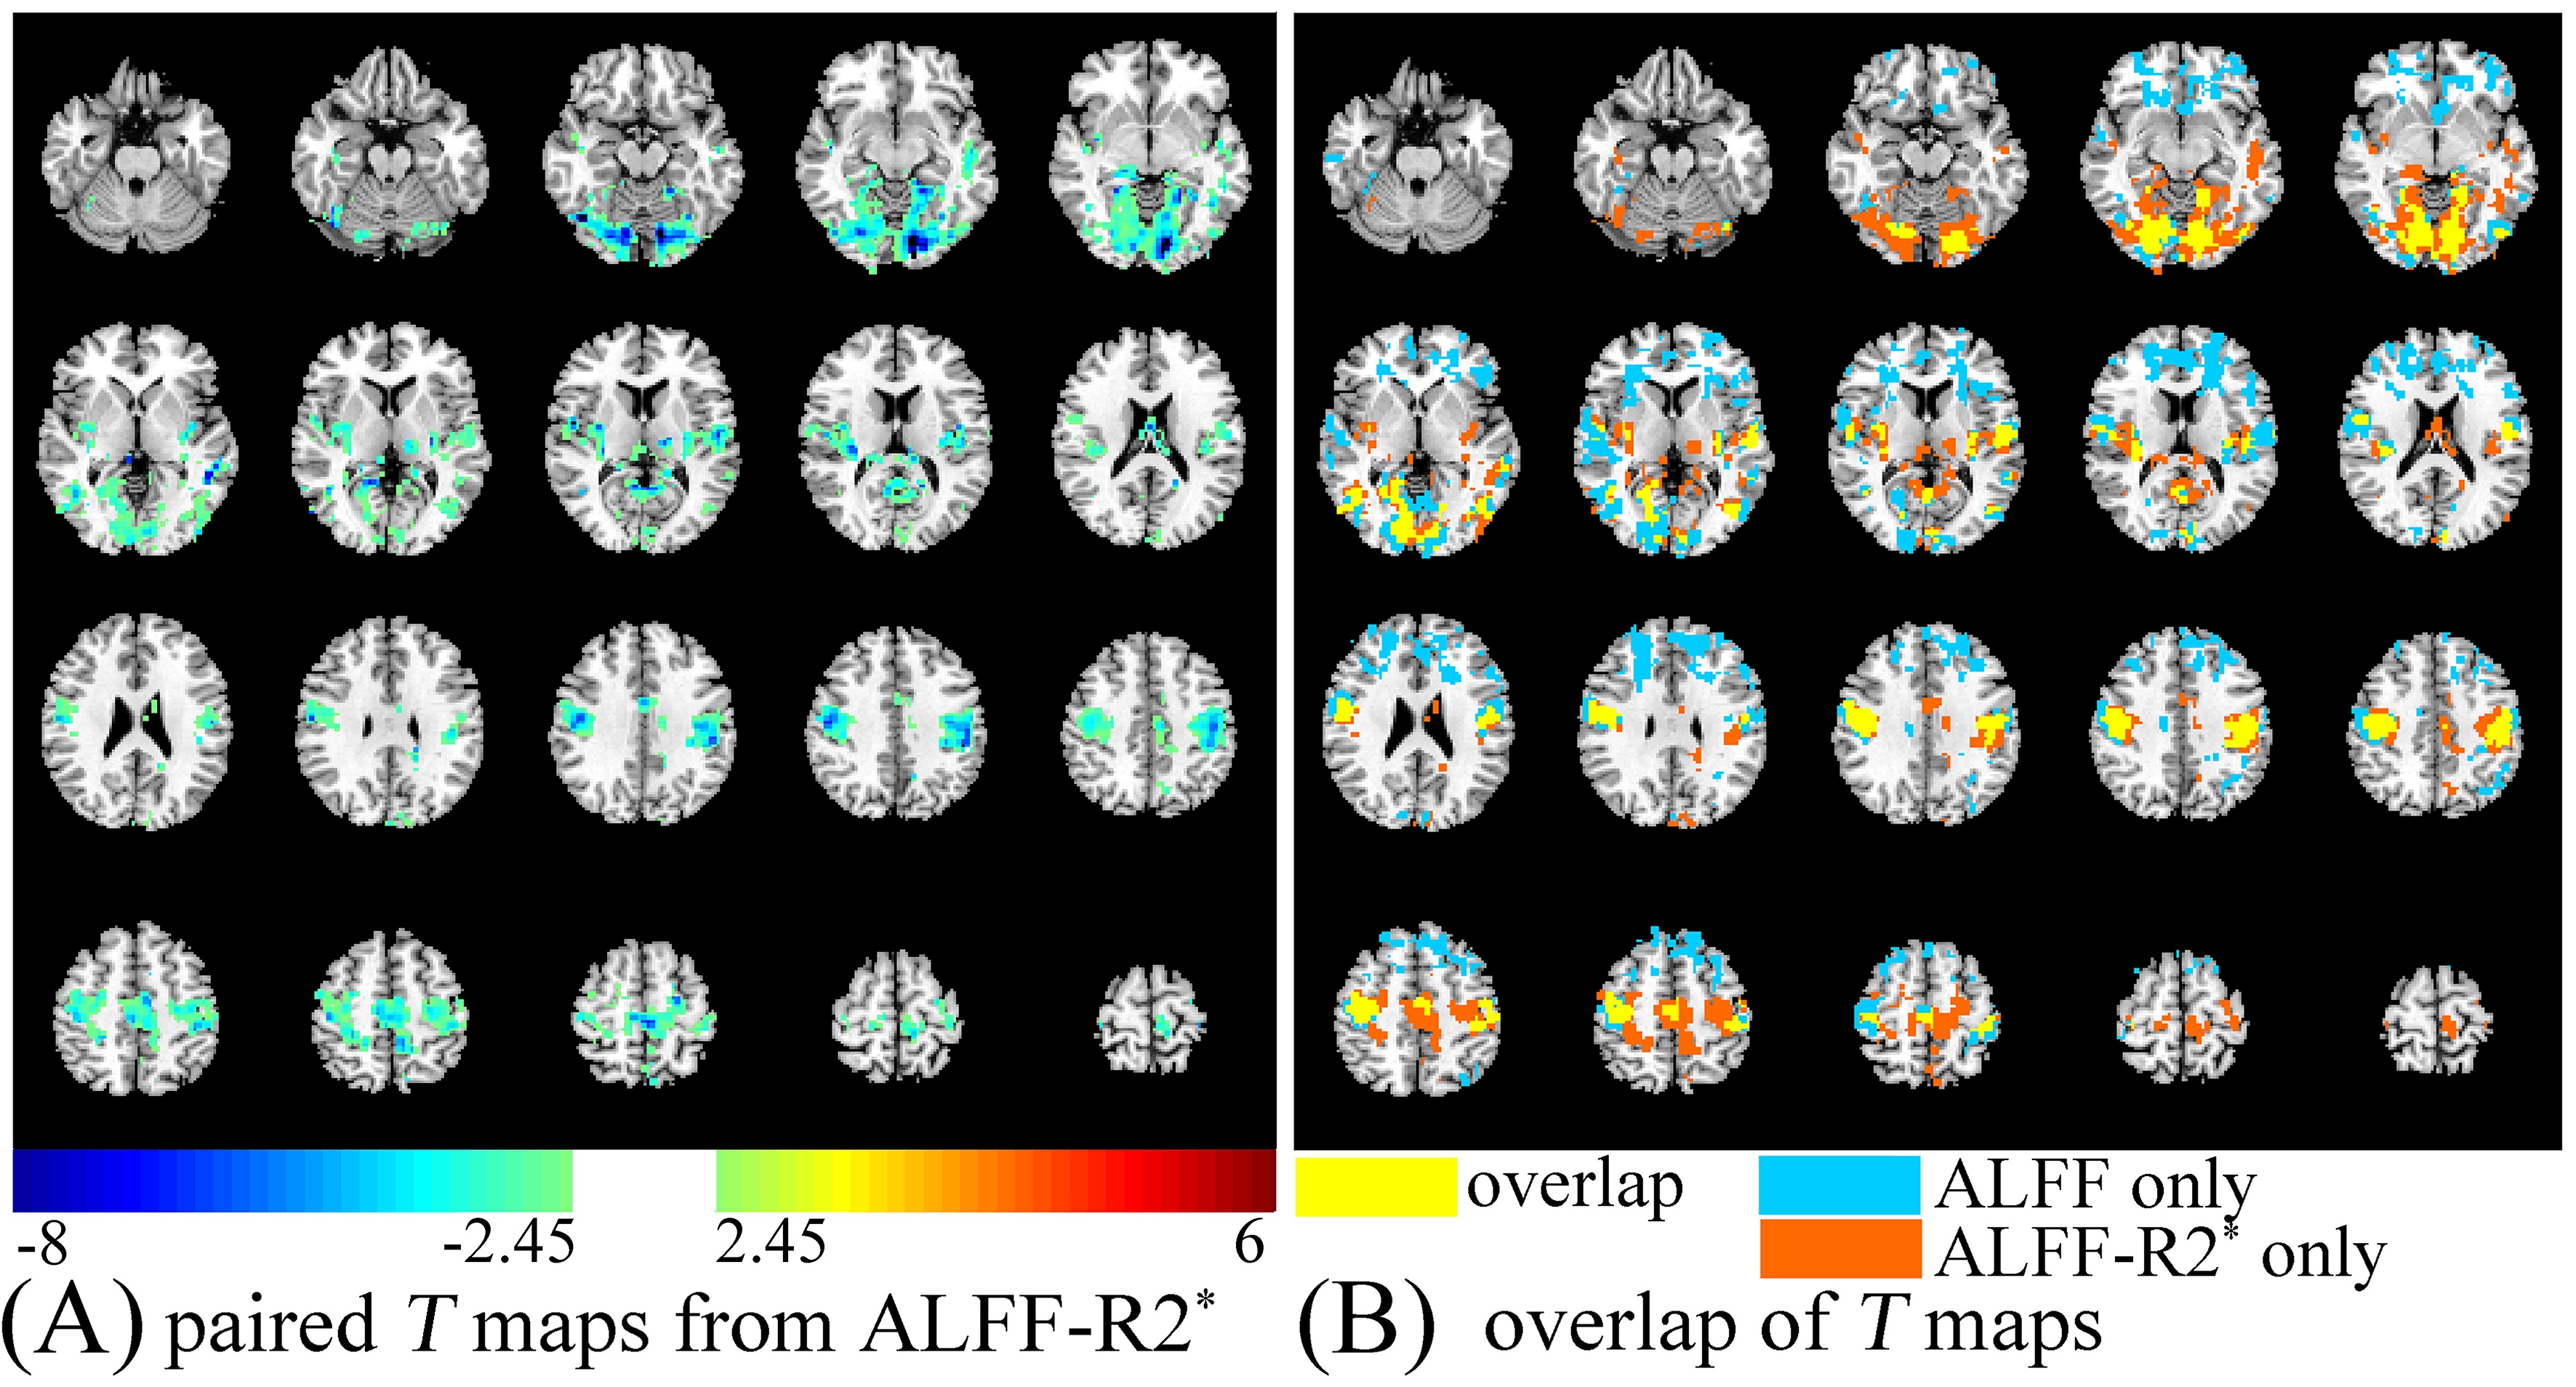
The R2* values at the interface of air and tissue are ultra-high (Fig.1C) and large S0 values locate at gray matter (Fig.1A). From the simulation, it can be found that a typical curve of ALFF variation with TE should include an initial descending, then ascending, and finally descending (Fig. 1B). However, due to the difference in mean S0 and R2*, the variation trends are very inconsistent between 10 ms ~ 70 ms. ALFF variation with TE from in-vivo data (Fig. 1D) is consistent with that from simulation (Fig. 1B). Paired T maps of ALFF (Fig. 2) with p < 0.05 and cluster size > 50 show that statistical results altered with different TEs. Regions in the frontal lobe, somatosensory cortex, and temporal lobe become larger with increasing TE, while the area of the occipital lobe gets smaller with higher TE. Comparing T maps from ALFF-R2* and ALFF at 30.93 ms, ALFF-R2* detects larger brain regions at the lower part of occipital lobe and the upper part of somatosensory cortices, while ALFF detected exclusively large frontal lobe (Fig. 3). The remained number of voxels in T maps, thresholded with p < 0.05 and cluster size > 50, is 5362 for ALFF-R2* and 6827 for ALFF, respectively. The DSC for these two T maps is 0.37.Discussion
Consistent with Ref. 4, the R2* values in the brain cover a large range from ~10 Hz to ~50 Hz and the TE with maximum ALFF was slightly away from 1/R2* influenced by the fluctuation of S0. Previous studies demonstrated that ALFF was significantly higher under EO than EC at the frontal lobe5, our results from traditional ALFF method are agreed with it. However, paired T-test results of ALFF-R2* showed no significant difference at the frontal lobe. Two causes may attribute to the result alteration between ALFF and ALFF-R2*: the effect of exponential function and fluctuation of S0.
Conclusion
ALFF calculated from R2* fluctuation could get rid of the confounding related with S0 fluctuation, TE dependence, and mean R2* effect. Multi-echo BOLD EPI thus provides significant benefit to resting-state fMRI study with both elevated sensitivity and reliability.Acknowledgements
This work was supported by the National Key R&D Program of China (2017YFC0909200), the National Natural Science Foundation of China (81661148045, 81520108016, 81271652, 31471084, 81401473, and 91632109), the Fundamental Research Funds for the Central Universities (2017QNA5016) of China.References
- Zang, Y., He, Y., Zhu, C., Cao, Q., Sui, M., Liang, M., … & Wang, Y. (2007). Altered baseline brain activity in children with ADHD revealed by resting-state functional MRI. Brain Dev, 29(2), 83–91.
- Wu, T., Ma, Y., Zheng, Z., Peng, S., Wu, X., Eidelberg, D., & Chan, P. (2015). Parkinson's Disease-Related Spatial Covariance Pattern Identified with Resting-State Functional MRI. Journal of Cerebral Blood Flow & Metabolism, 35(11), 1764-1770.
- Dai, Z., Yan, C., Wang, Z., Wang, J., Xia, M., Li, K., & He, Y. (2012). Discriminative analysis of early Alzheimer's disease using multi-modal imaging and multi-level characterization with multi-classifier (M3). Neuroimage, 59(3), 2187-2195.
- Wu, C. W., Gu, H., Zou, Q., Lu, H., Stein, E. A., & Yang, Y. (2012). TE-dependent spatial and spectral specificity of functional connectivity. Neuroimage, 59(4), 3075-3084.
- Zou, Q., Yuan, B. K., Gu, H., Liu, D.,
Wang, D. J., Gao, J. H., ... & Zang, Y. F. (2015). Detecting static and
dynamic differences between eyes-closed and eyes-open resting states using ASL
and BOLD fMRI. PloS one, 10(3), e0121757.
Figures