5468
An automated method for assessing the accuracy of cross-modal registration in high-field fMRI1Department of Psychology, University of Minnesota, Minneapolis, MN, United States, 2Center for Magnetic Resonance Research, University of Minnesota, Minneapolis, MN, United States, 3Office of the Associate Dean for Research, College of Liberal Arts, University of Minnesota, Minneapolis, MN, United States
Synopsis
In this work, we developed a method for evaluating the quality of cross-modal registration of functional and anatomical MRI datasets that obviates the need for subjective human judgments. In brief, we propose that the overlap of an activation mask derived from the functional data with a binary GM mask derived from the reference anatomical volume is a useful metric for overall registration quality. In addition, we promote the use of activation consistency throughout the gray matter as an inclusion criterion for regions of interest when computing laminar (depth-dependent) profiles, provided that the activation is computed in a robust, independent localizer.
INTRODUCTION
Information about the gray matter (GM) depth-dependent profile of blood oxygen level dependent (BOLD) signals is valuable only if GM is accurately labeled in the functional volume. Since the contrast between GM and white matter (WM) is generally poor in T2- or T2*-weighted functional data, it is most common for information about depth to be derived from T1-weighted anatomical images. Thus, accurate registration of functional data to anatomical data is vital in laminar studies. Assessing the quality of registration between functional and anatomical data generally involves visual inspection by human observers, which is subjective and impractical on a large scale. Furthermore, distortion in functional data means that registration is not good everywhere.METHODS
Data acquisition
Three healthy adults were studied with a 7T Siemens scanner with a custom-made 32-channel receive, 4-channel transmit head coil. T1-weighted anatomical data were acquired in-session at 1mm isotropic resolution[CAO1] . Functional data were acquired with 0.8 mm isotropic T2*-weighted EPI images. Each participant volunteered for two experiments. All 6 scanning sessions included 8-12 functional scans for which fMRI laminar profiles of early visual responses were desired and 4 independent visual localizer scans. The independent localizers were either block-design presentation of high-contrast visual stimuli (12 sec on, 12 sec off, 10.5 cycles per scan) or a population receptive field mapping scan in which 16 16-sec blocks of dynamic, high-contrast bars drifting across the visual field in different directions were alternated with 4 sec of visual rest.
Two methods for evaluating overall registration quality
Following motion correction and distortion compensation, we computed a single EPI image that was the mean of the first volume of each scan in the scanning session. This volume was used for registration to the anatomical (T1) data. We also computed a binary activation mask from the 4 independent localizers interspersed throughout the scanning session using a statistical threshold of p < 0.0001 (uncorrected).
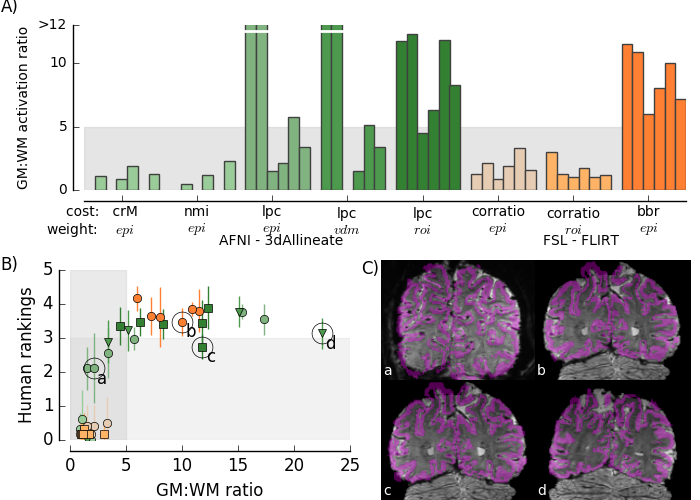
We then used multiple registration cost and weighting functions from both AFNI’s 3dAllineate and FSL’s FLIRT tools to provide a variety of registration results for each of the six datasets, resulting in 48 registrations. Six expert observers evaluated each registration on a scale of 0-5 (0=failure; 5=perfect). For each registration, binary GM and WM masks were also resampled from the anatomical T1 to the functional space and used to compute the ratio of the number of “active” voxels co-registered with GM to the number of “active” voxels co-registered with WM. This metric, referred to as the “GM:WM activation ratio”, is the tool we propose for assessing overall registration quality (Fig. 1A).
Region-specific masks for reliable depth-dependent analyses
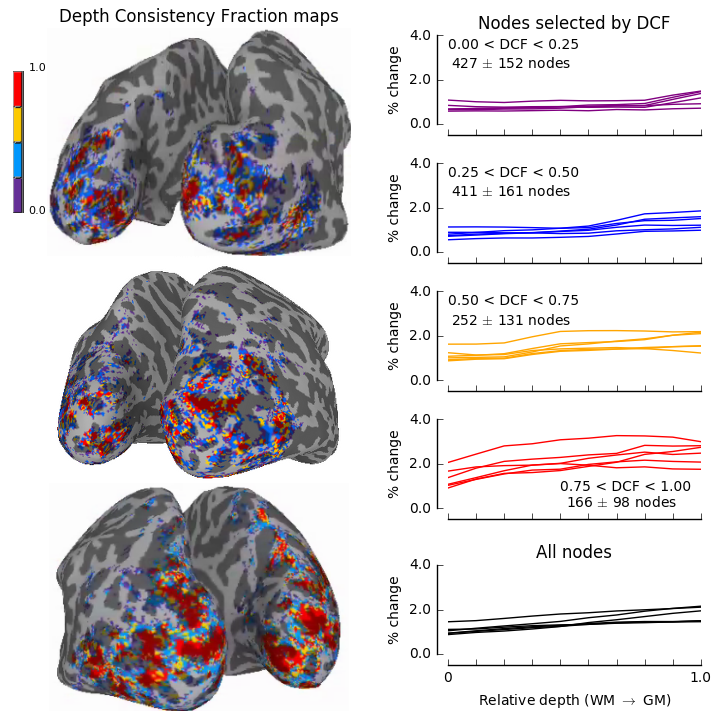
Although many algorithms produced good overall alignments, it was evident that all EPI datasets had residual distortion that varied in severity throughout the volume and resulted in varying quality of GM labeling. Therefore, we developed a metric that quantified the quality of the GM labeling by computing the consistency of the activation throughout the cortex depth. We refer to this metric as the depth-dependent consistency fraction. It is important to note that this is only a useful metric when computed for an independent functional localizer that produces robust responses throughout the GM depth. One way to approach the problem of residual distortions in functional datasets is to create a mask that will exclude regions with imperfect registrations from subsequent analyses. This may be achieved with an independent scan that, ideally, targets all layers of GM and, at minimum, is not generated with a contrast that is related to subsequent analyses.
RESULTS
The human observers’ ranking of alignment quality increased as the GM:WM activation ratio increased for alignments of poor to moderate quality (observer ratings < 3 and GM:WM ratio < 5, Fig. 1B, C). For datasets with GM:WM activation ratios above 5, observers’ (average) ratings reached a plateau between 3 and 4. In this regime, datasets had no egregious or systematic registration deficits. Thus, we concluded that GW:WM activation ratio is a useful metric for evaluating registration quality and that values above 5 indicated good overall registration.
However, even with good overall registration, there are regions of the functional data in which GM is not accurately labeled. Therefore, we tested whether the depth consistency fraction could identify regions, within a given volume, where GM labeling was good enough to support subsequent laminar analyses. For all datasets, selecting only nodes for which the mask indicated significant modulation throughout the GM (75%-100% of the cortical depth, red lines, Fig. 2) produced profiles with the largest amplitudes that matched expectations from previous literature [1-3]. Using nodes for which the depth-dependent consistency fraction was low not only degraded the amplitude but also revealed a bias toward superficial layers.
Acknowledgements
NIH grants R21 EY025371, R01 MH111447, P41 EB015894, P30 NS076408, S10 RR026783 and the WM KECK FoundationReferences
[1] De Martino F, Zimmermann J, Muckli L, Ugurbil K, Yacoub E, Goebel R (2013). Cortical depth dependent functional responses in humans at 7T: improved specificity with 3D GRASE. PLoS One 8(3):e60514. doi: 10.1371/journal.pone.0060514.
[2] Markuerkiaga I, Barth M, & Norris DG. (2016). A cortical vascular model for examining the specificity of the laminar BOLD signal. Neuroimage 132:491-498. doi: 10.1016/j.neuroimage.2016.02.073.
[3] Polimeni JR, Fischl B, Greve DN, & Wald LL (2010). Laminar analysis of 7T BOLD using an imposed spatial activation pattern in human V1. Neuroimage 52(4):1334-46. doi: 10.1016/j.neuroimage.2010.05.005.
Figures