5465
Serial Correlations in fMRI Time-Series Arise from Non-Stochastic Signals Related to Brain Function1Department of Radiology, Emory University, Atlanta, GA, United States, 2VA RR&D Center of Excellence, Atlanta VAMC, Decatur, GA, United States, 3Department of Neurology, Emory University, Atlanta, GA, United States
Synopsis
In this study, we first demonstrate using resting state fMRI (rsfMRI) “null” datasets, that serial correlation in fMRI time-series arises from non-stochastic signals (e.g., coordinated activity within brain function networks unrelated to the fMRI paradigm of interest). Using this principle, we then advance a method to obtain whitened GLM first-level analysis regression residuals in task fMRI studies, by accounting for non-stochastic brain signals through principal components analysis. Importantly, the proposed methods is insensitive to the temporal resolution of fMRI time-series, unlike conventional stochastic models of serial correlation, whose parameters have to be modified depending on fMRI scan-TR.
INTRODUCTION
While stochastic modeling of serial correlation (TSCor) in fMRI time-series is an area of active research,1-5 a lot of evidence exists indicating these TSCors arise from non-stochastic brain function related signals. For instance, the highest estimated auto-regressive (AR) model orders of TSCors are generally found in default mode network regions2 that are considered hubs of functional connectivity networks6,7. Recently, we showed that accounting for non-stochastic signals (e.g., coordinated activity within brain function networks unrelated to the fMRI paradigm of interest) renders spatial auto-correlation function (sACF) of the first-level general linear model analysis (GLM-FLA) residuals Gaussian and uniform across the brain.8,9 In this study, we first demonstrate using resting state fMRI (rsfMRI) “null” datasets, that such removal of non-stochastic brain signals from fMRI data, also renders the GLM-FLA residuals (for a synthetic block fMRI paradigm), obtained through ordinary least squares regression (OLSReg), independent and identically distributed (i.i.d.) in time, without the need for pre-whitening using stochastic TSCor models. Correspondingly, we advance a principal components orthogonalized (PCO) GLM-FLA method to obtain whitened OLSReg residuals in task fMRI studies.METHODS
Twenty-one normal subjects (median age ~22 years) were scanned in a Siemens 3T MRI scanner. FMRI scans were obtained with whole-brain gradient echo EPI (TR/TE = 3000/25 ms (for rsfMRI) and 2000/24 ms for task fMRI; FA = 90°, 3x3x3 mm voxels). Standard fMRI preprocessing steps5,9 were employed for both “null” and task fMRI datasets.
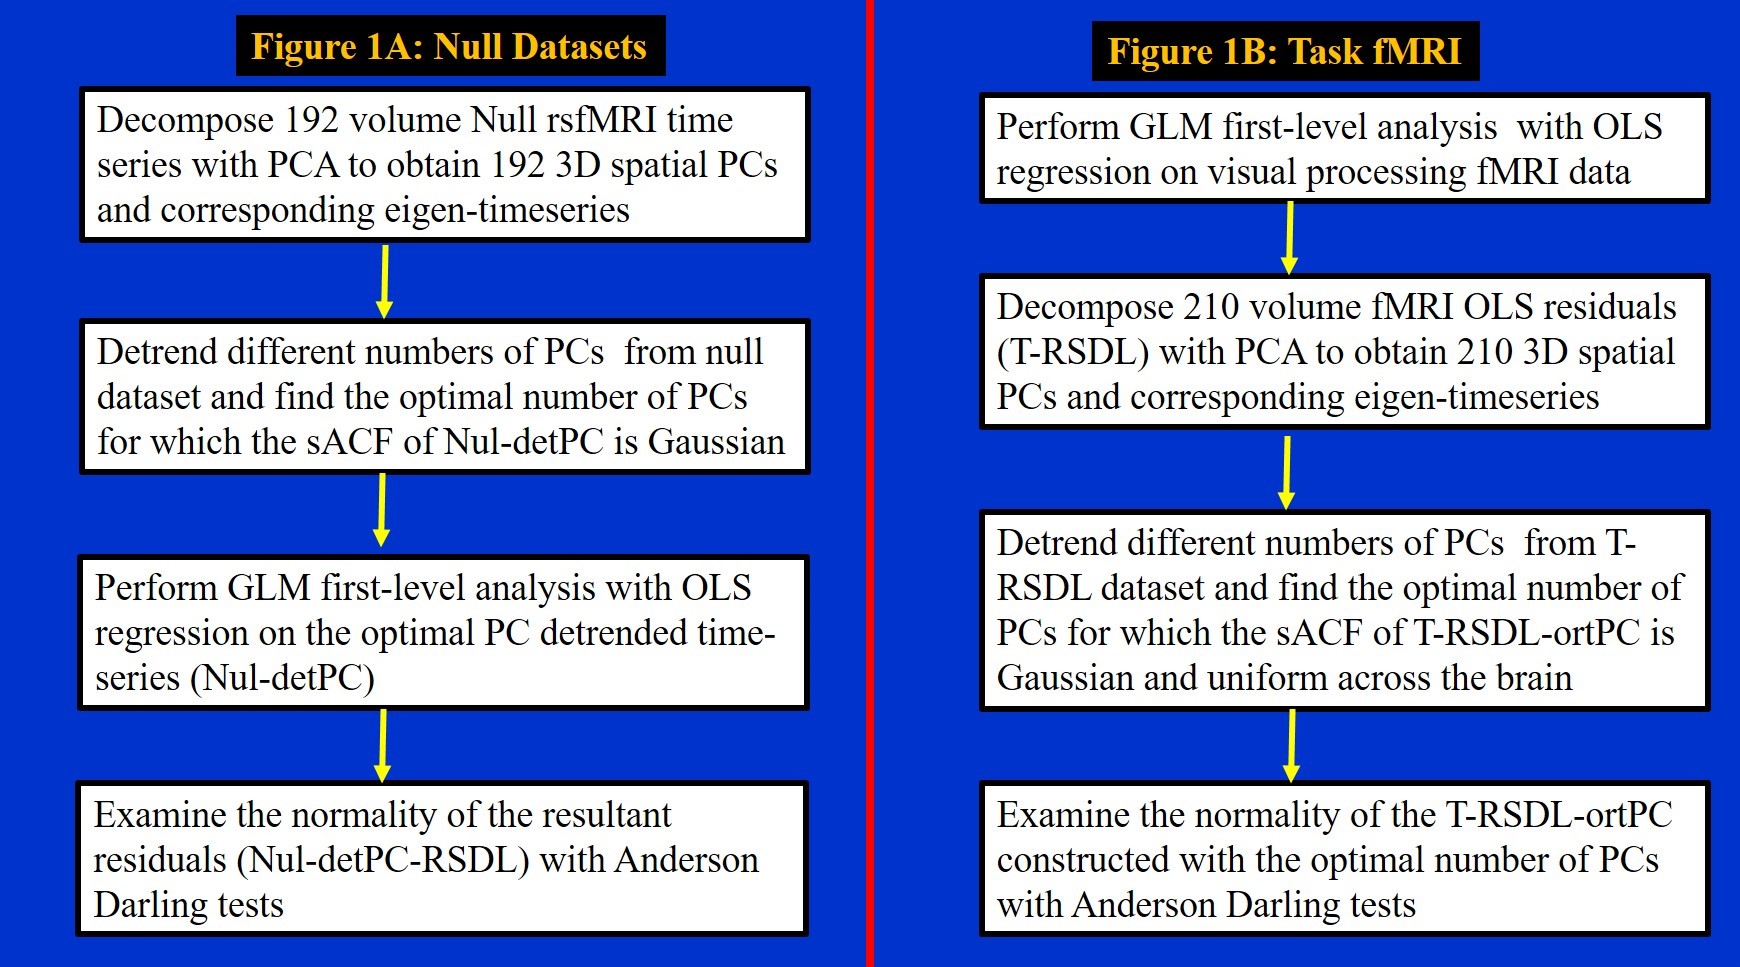
Null Datasets: The participants underwent a 10-minute rsfMRI scan. The 4D rsfMRI “null” datasets were decomposed with principal components analysis (PCA), yielding (see Figure 1A for details) PC-detrended null datasets (nul-detPC) with uniform Gaussian sACF. The nul-detPC datasets were then analyzed with OLSReg to assess activation to a synthetic block fMRI paradigm (12-sec blocks of “rest” and “task”). The normality of the resultant GLM-FLA residuals (Nul-detPC-RSDL) were examined with Anderson-Darling (AD) tests10. The normality of the AR-moving average (ARMA (1,1)) whitened residuals5 obtained with generalized least-squares regression (GLSReg) (N-RSDLGLS) on original “null” datasets were also tested.
Task fMRI: The task paradigm for 7-minute visual processing fMRI scans11 consisted of 12-sec blocks of pictures (e.g., body-parts, objects, etc.), interspersed with 14-sec periods of fixation. The fMRI data were analyzed with the PCO GLM-FLA method (see Figure 1B) to yield residuals (T-RSDL-ortPC) with uniform and Gaussian sACF.8 The normality of the T-RSDL-ortPCs were assessed with AD tests. The normality of the ARMA (1,1) whitened residuals5 obtained with GLSReg (T-RSDLGLS) on original fMRI datasets were also assessed.
RESULTS & DISCUSSION
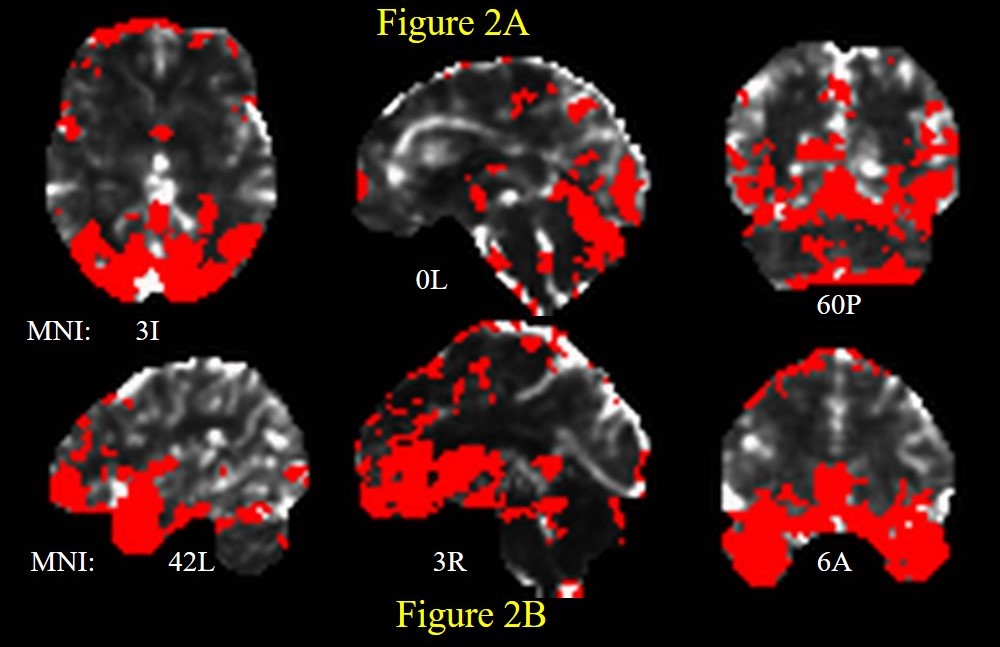
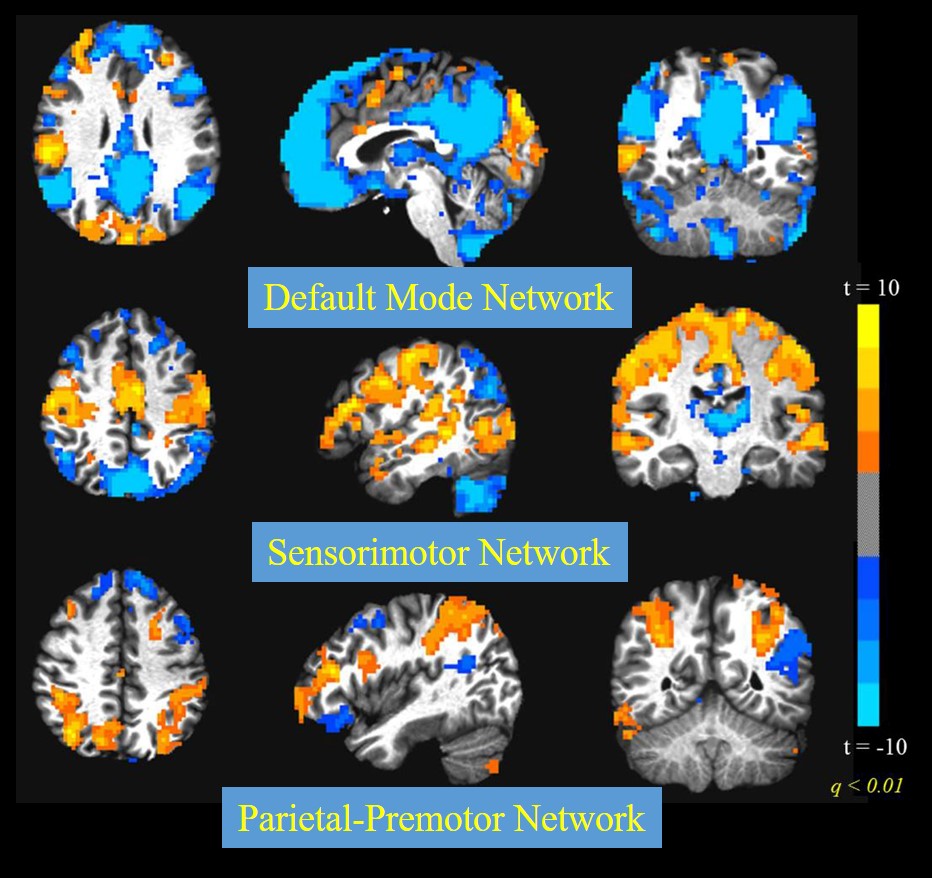
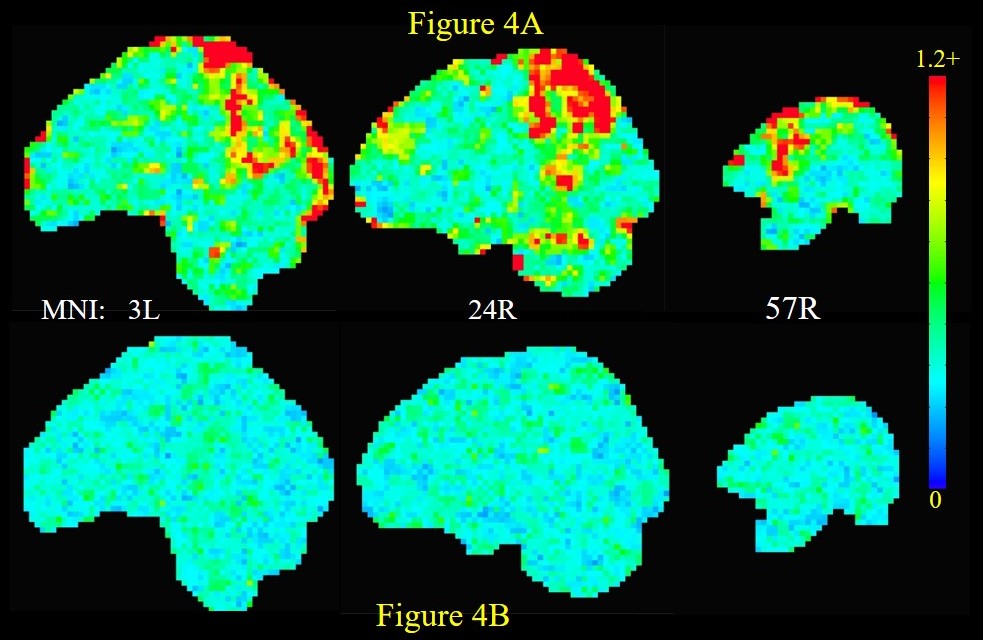
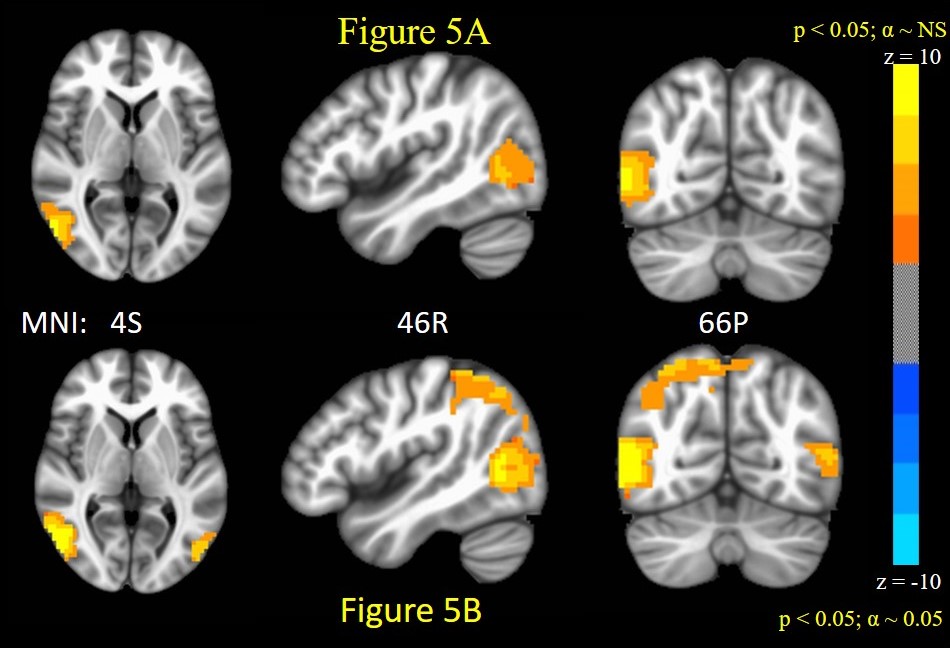
The number of ARMA-whitened N-RSDLGLS voxels which exhibited significant departure from normality (AD test voxel p < 0.05) ranged from 0 to 80% across the 21 subjects (median 1.6%). Thus, while the ARMA model is able to model the TSCor adequately in a lot of voxels, it fails strikingly in certain datasets. Figure 2 shows representative maps of N-RSDLGLS voxels which are deemed nonwhite by AD tests, from two different subjects. In general, the ARMA estimator fails to model TSCor adequately in large draining veins, which encode brain signals from many regions. The Nul-detPC-RSDL time-series were uniformly white, indicating that TSCor arises from brain signals (see Figure 3 for representative PCs exhibiting brain function networks). Having validated our hypothesis, we developed a PCO technique to obtain i.i.d. GLM-FLA residuals. The number of ARMA-whitened T-RSDLGLS voxel time-series exhibiting departures from normality varied from 0.25% to 22% (median 1.1%), across the 21 subjects. On the other hand, none of the T-RSDL-ortPC datasets exhibited non-white residuals, indicating superior performance of the PCO GLM-FLA method in accounting for TSCor in T-RSDL-ortPCs. Figure 4 shows the AD statistics for a representative subject’s T-RSDLGLS and T-RSDL-ortPC datasets. Finally, the PCO GLM-FLA method has the added advantage of increasing the significance of brain activation, since it removes non-stochastic brain signals from the residuals, thus reducing their variance, apart from rendering them white. Figure 5 shows the maps of GLM-FLA Body v Object t-contrasts (converted to z-scores and averaged across subjects) for the conventional, and PCO GLM-FLA. The PCO method yields an additional cluster of body-specific activation in parietal body area12, not observable through conventional GLM-FLA.CONCLUSION
The results from null datasets analysis indicate that TSCor in fMRI time-series arise from non-stochastic signals (e.g., from coordinated activity within brain function networks), which when accounted for, renders GLM-FLA residuals white. Based on this principle, we advanced a PCO GLM method, which yields whitened FLA residuals in task fMRI studies. Importantly, the PCO GLM-FLA method is insensitive to fMRI scan-TR, unlike conventional stochastic models of TSCor,3-5 whose parameters have to be modified depending on temporal resolution1,2.Acknowledgements
The authors would like to acknowledge Department of Radiology & Imaging Sciences, Emory University for funding support, and Center for Systems Imaging, Emory University, for assistance with MR Imaging.References
1. Bollmann S, Puckett AM, et al. Serial correlations in single-subject fMRI with sub-second TR. Neuroimage 2017.
2. Sahib AK, Mathiak K, et al. Effect of temporal resolution and serial autocorrelations in event-related functional MRI. Magn Reson Med 2016;76:1805-13.
3. Bullmore E, Brammer M, et al. Statistical methods of estimation and inference for functional MR image analysis. Magn Reson Med 1996;35:261-77.
4. Friston KJ, Glaser DE, et al. Classical and Bayesian inference in neuroimaging: applications. Neuroimage 2002;16:484-512.
5. Cox RW, Chen G, et al. FMRI Clustering in AFNI: False-Positive Rates Redux. Brain Connect 2017;7:152-71.
6. Cole MW, Pathak S, et al. Identifying the brain's most globally connected regions. Neuroimage 2010;49:3132-48.
7. Buckner RL, Sepulcre J, et al. Cortical hubs revealed by intrinsic functional connectivity: mapping, assessment of stability, and relation to Alzheimer's disease. J Neurosci 2009;29:1860-73.
8. Gopinath K, Lacey S, et al. Method to obtain residuals with Gaussian spatial auto-correlations function in fMRI analysis models. Proc Org Hum Brain Mapp 2017;22:1949.
9. Gopinath K, Krishnamurthy V, et al. Accounting for Non-Gaussian Sources of Spatial Correlation in Parametric fMRI Paradigms I: Revisiting Cluster-Based Inferences. Brain Connect 2017.
10. Stephens MA. Edf Statistics for Goodness of Fit and Some Comparisons. J Am Stat Assoc 1974;69:730-7.
11. Gopinath K, Lacey S, et al. Resting-state functional connectivity of specialized occipitotemporal cortical regions. Proc ISMRM 2013;21:2254.
12. Huang RS, Chen CF, et al. Mapping multisensory parietal face and body areas in humans. Proc Natl Acad Sci U S A 2012;109:18114-9.
Figures