5463
Improved detection of neuronal-related BOLD events of unknown timing with Multi-Echo Sparse Paradigm Free Mapping1Basque Center on Cognition, Brain and Language, San Sebastian, Spain, 2Section on Functional Imaging Methods, National Institute of Mental Health, Bethesda, MD, United States, 3FMRI Core, National Institute of Mental Health, Bethesda, MD, United States
Synopsis
This work introduces an extension of sparse paradigm free mapping (SPFM) for multiecho (ME) fMRI: ME-SPFM. Based on the ME-fMRI signal model and L1-norm regularized estimators, ME-SPFM produces voxel-wise estimates of time-varying changes in the transverse relaxation ($$$R_2^*$$$) and the net magnetization ($$$S_0$$$) without prior information about experimental paradigms. Our evaluations demonstrate that ME-SPFM significantly outperforms its SE counterpart in terms of sensitivity and specificity, nearly matching that of traditional model-based analyses. ME-SPFM’s ability to blindly detect individual events at the single-subject level makes it an ideal candidate to explore the time-varying nature of brain activity in experimentally unconstrained paradigms (naturalistic, resting-state) or clinical applications (detection of inter-ictal epileptic events).
Introduction
Multi-echo (ME) fMRI result in $$$K$$$ time-series per voxel; each acquired at different TEs. Optimal combination of echoes (OC[1,2]) or automatic ME-based denoising (MEICA[3]) improves the sensitivity of BOLD-fMRI for GLM-based analyses that require information about the timing of experimental events[4]. An alternative analytic approach is “blind event-detection” methods, which try detecting BOLD-events based solely on a hemodynamic response model (e.g., gamma variate function) and do not need event-timing information. These methods output event-wise spatial maps which can be used to decode their cognitive nature[5].
One such “blind event-detection” method is Sparse Free Paradigm Mapping (SPFM)[6]. SPFM successfully detects events, yet it lacks the sensitivity of GLM. To address this, we propose an ME-based SPFM formulation that exploits the linear dependence of neuronally-driven BOLD events with TE[3]. Using a multi-task, event-related dataset we demonstrate how ME-SPFM can reliably detect individual events—namely single-trials at the subject level—with significantly better specificity and sensitivity than its single-echo (SE) counterpart; and nearly matching traditional GLM results. This suggests that ME-SPFM can help confidently decipher the dynamic nature of brain activity in naturalistic paradigms, resting-state or clinical applications with unknown event-timing.
Methods
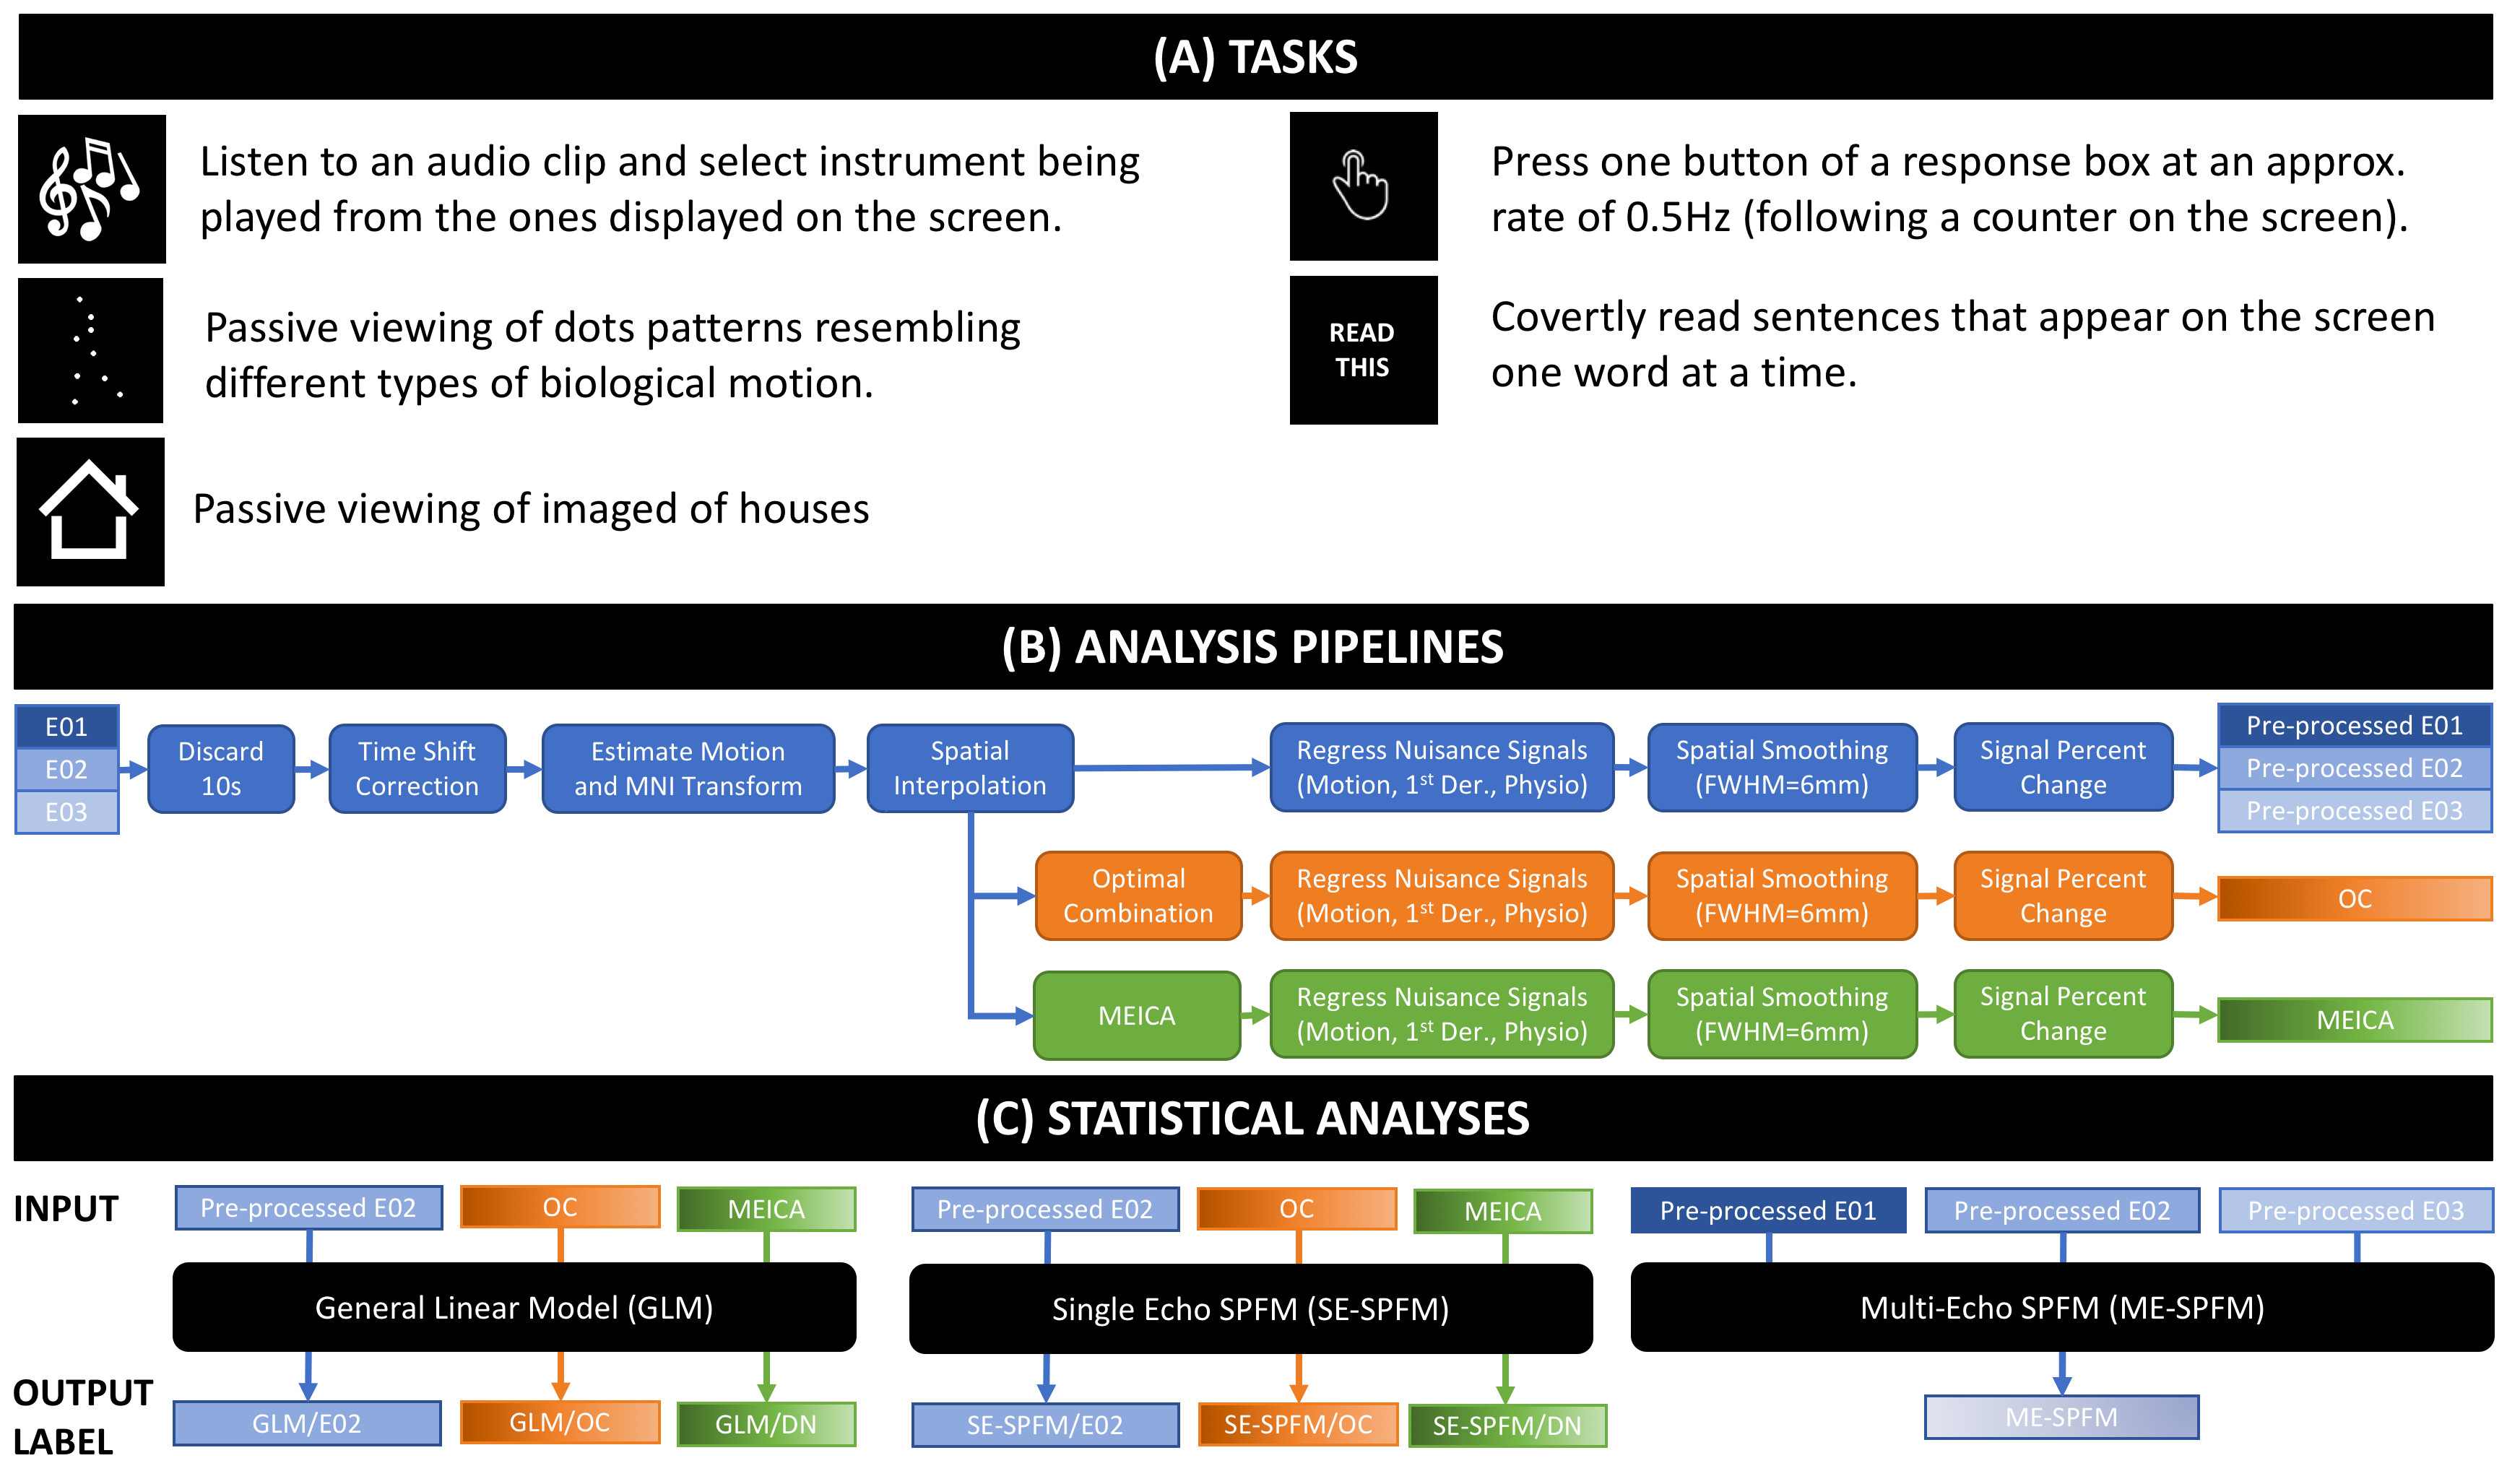
DATA: 9 healthy adults. Anatomicals were preceded by one (3 subjects) or two ME functional scans (3T, EPI, FA=70°, $$$TE$$$=16.3/32.2/48.1ms, TR=2s, Res=3x3x4mm, $$$N$$$=220 volumes, #Slices=30, ASSET=2). Each run had 30 trials of each of 6 different tasks (4s each; Figure 1.A).
PREPROCESSING: Three different pre-processing pipelines were used. They are depicted in Figures 1.B-C.
GLM: For each subject and task, two activation maps were computed with AFNI 3dREMLfit: 1) modeling all trials together (TASK-BASED), or 2) modeling trials individually (TRIAL-BASED). Maps obtained with both models were used as gold standard for computation of sensitivity, specificity and dice coefficients ($$$q=p_{FDR}\leq$$$0.05 for TASK-BASED, and $$$p_{UNC}\leq$$$0.05 for TRIAL-BASED).
SE-SPFM: SPFM performs the deconvolution of voxel times series ($$$\mathbf{y}\in\mathbb{R}^{N}$$$) based on a linear haemodynamic model ($$$\mathbf{H}\in \mathbb{R}^{N \times N}$$$) using a regularized L1-norm estimator so that the neuronal-related time-series generating the BOLD response ($$$\mathbf{s}\in\mathbb{R}^N$$$) is estimated by solving $$$\mathbf{\widehat{s}}=\min_{\mathbf{s}}\|\mathbf{y}-\mathbf{H}\mathbf{s}\|_2^2 + \lambda \|\mathbf{s}\|_1$$$ [6]. SPFM was applied on the E02, OC and MEICA pipelines (AFNI 3dPFM).
ME-SPFM: Voxel-wise SPC time-series acquired at $$$TE_k$$$ are defined as $$$\mathbf{y}_k = \frac{\bf{\Delta S}_0}{S_0} - TE_k \bf{\Delta R}_2^*$$$ [7]. As in SE-SPFM, a haemodynamic model for the neuronal-related $$$\bf{\Delta R}_2^*$$$ time-series can be defined as $$$\bf{\Delta R}_2^* = \mathbf{H}\mathbf{s}$$$. With $$$N_e$$$, it can be shown that $$\underbrace{\left[ \begin{array}{c} \mathbf{y}_1 \\ \vdots \\ \mathbf{y}_K \end{array} \right]}_{\widetilde{\mathbf{y}}} = \underbrace{\left[ \begin{array}{c} \mathbf{I} \\ \vdots \\ \mathbf{I} \\ \end{array}\right]}_{\widetilde{\mathbf{I}}} \bf{\Delta}\bf{\rho} - \underbrace{ \left[ \begin{array}{c} TE_1 \mathbf{H} \\ \vdots \\ TE_K \mathbf{H}\\ \end{array}\right]}_{\widetilde{\mathbf{H}}} \bf{\Delta s}.$$ The ME-SPFM method estimates $$$\mathbf{s}$$$ and $$$\bf{\Delta\rho}=\frac{\bf{\Delta S}_0}{S_0}$$$ by solving $$$\mathbf{\widehat{x}}=\min_{\mathbf{x}}\|\mathbf{\widetilde{y}}-\mathbf{T}\mathbf{x}\|_2^2 + \lambda \|\mathbf{x}\|_1$$$, where $$$\mathbf{x}^T=\left[\bf{\Delta}\bf{\rho}^T,\bf{\Delta s}^T\right]$$$ and $$$\mathbf{T}=\left[\widetilde{\mathbf{I}} \ \widetilde{\mathbf{H}}\right]$$$.
For both SE-SPFM and ME-SPFM, we used the SPM canonical HRF to generate the convolution matrices $$$\mathbf{H}$$$, and the Bayesian Information Criterion (BIC) to select the regularization parameter $$$\lambda$$$. Furthermore, their activation maps were computed for each trial considering the volumes of the deconvolved coefficients ($$$\mathbf{\widehat{s}}$$$) when each trial occurs (i.e. 3 TRs).
Results
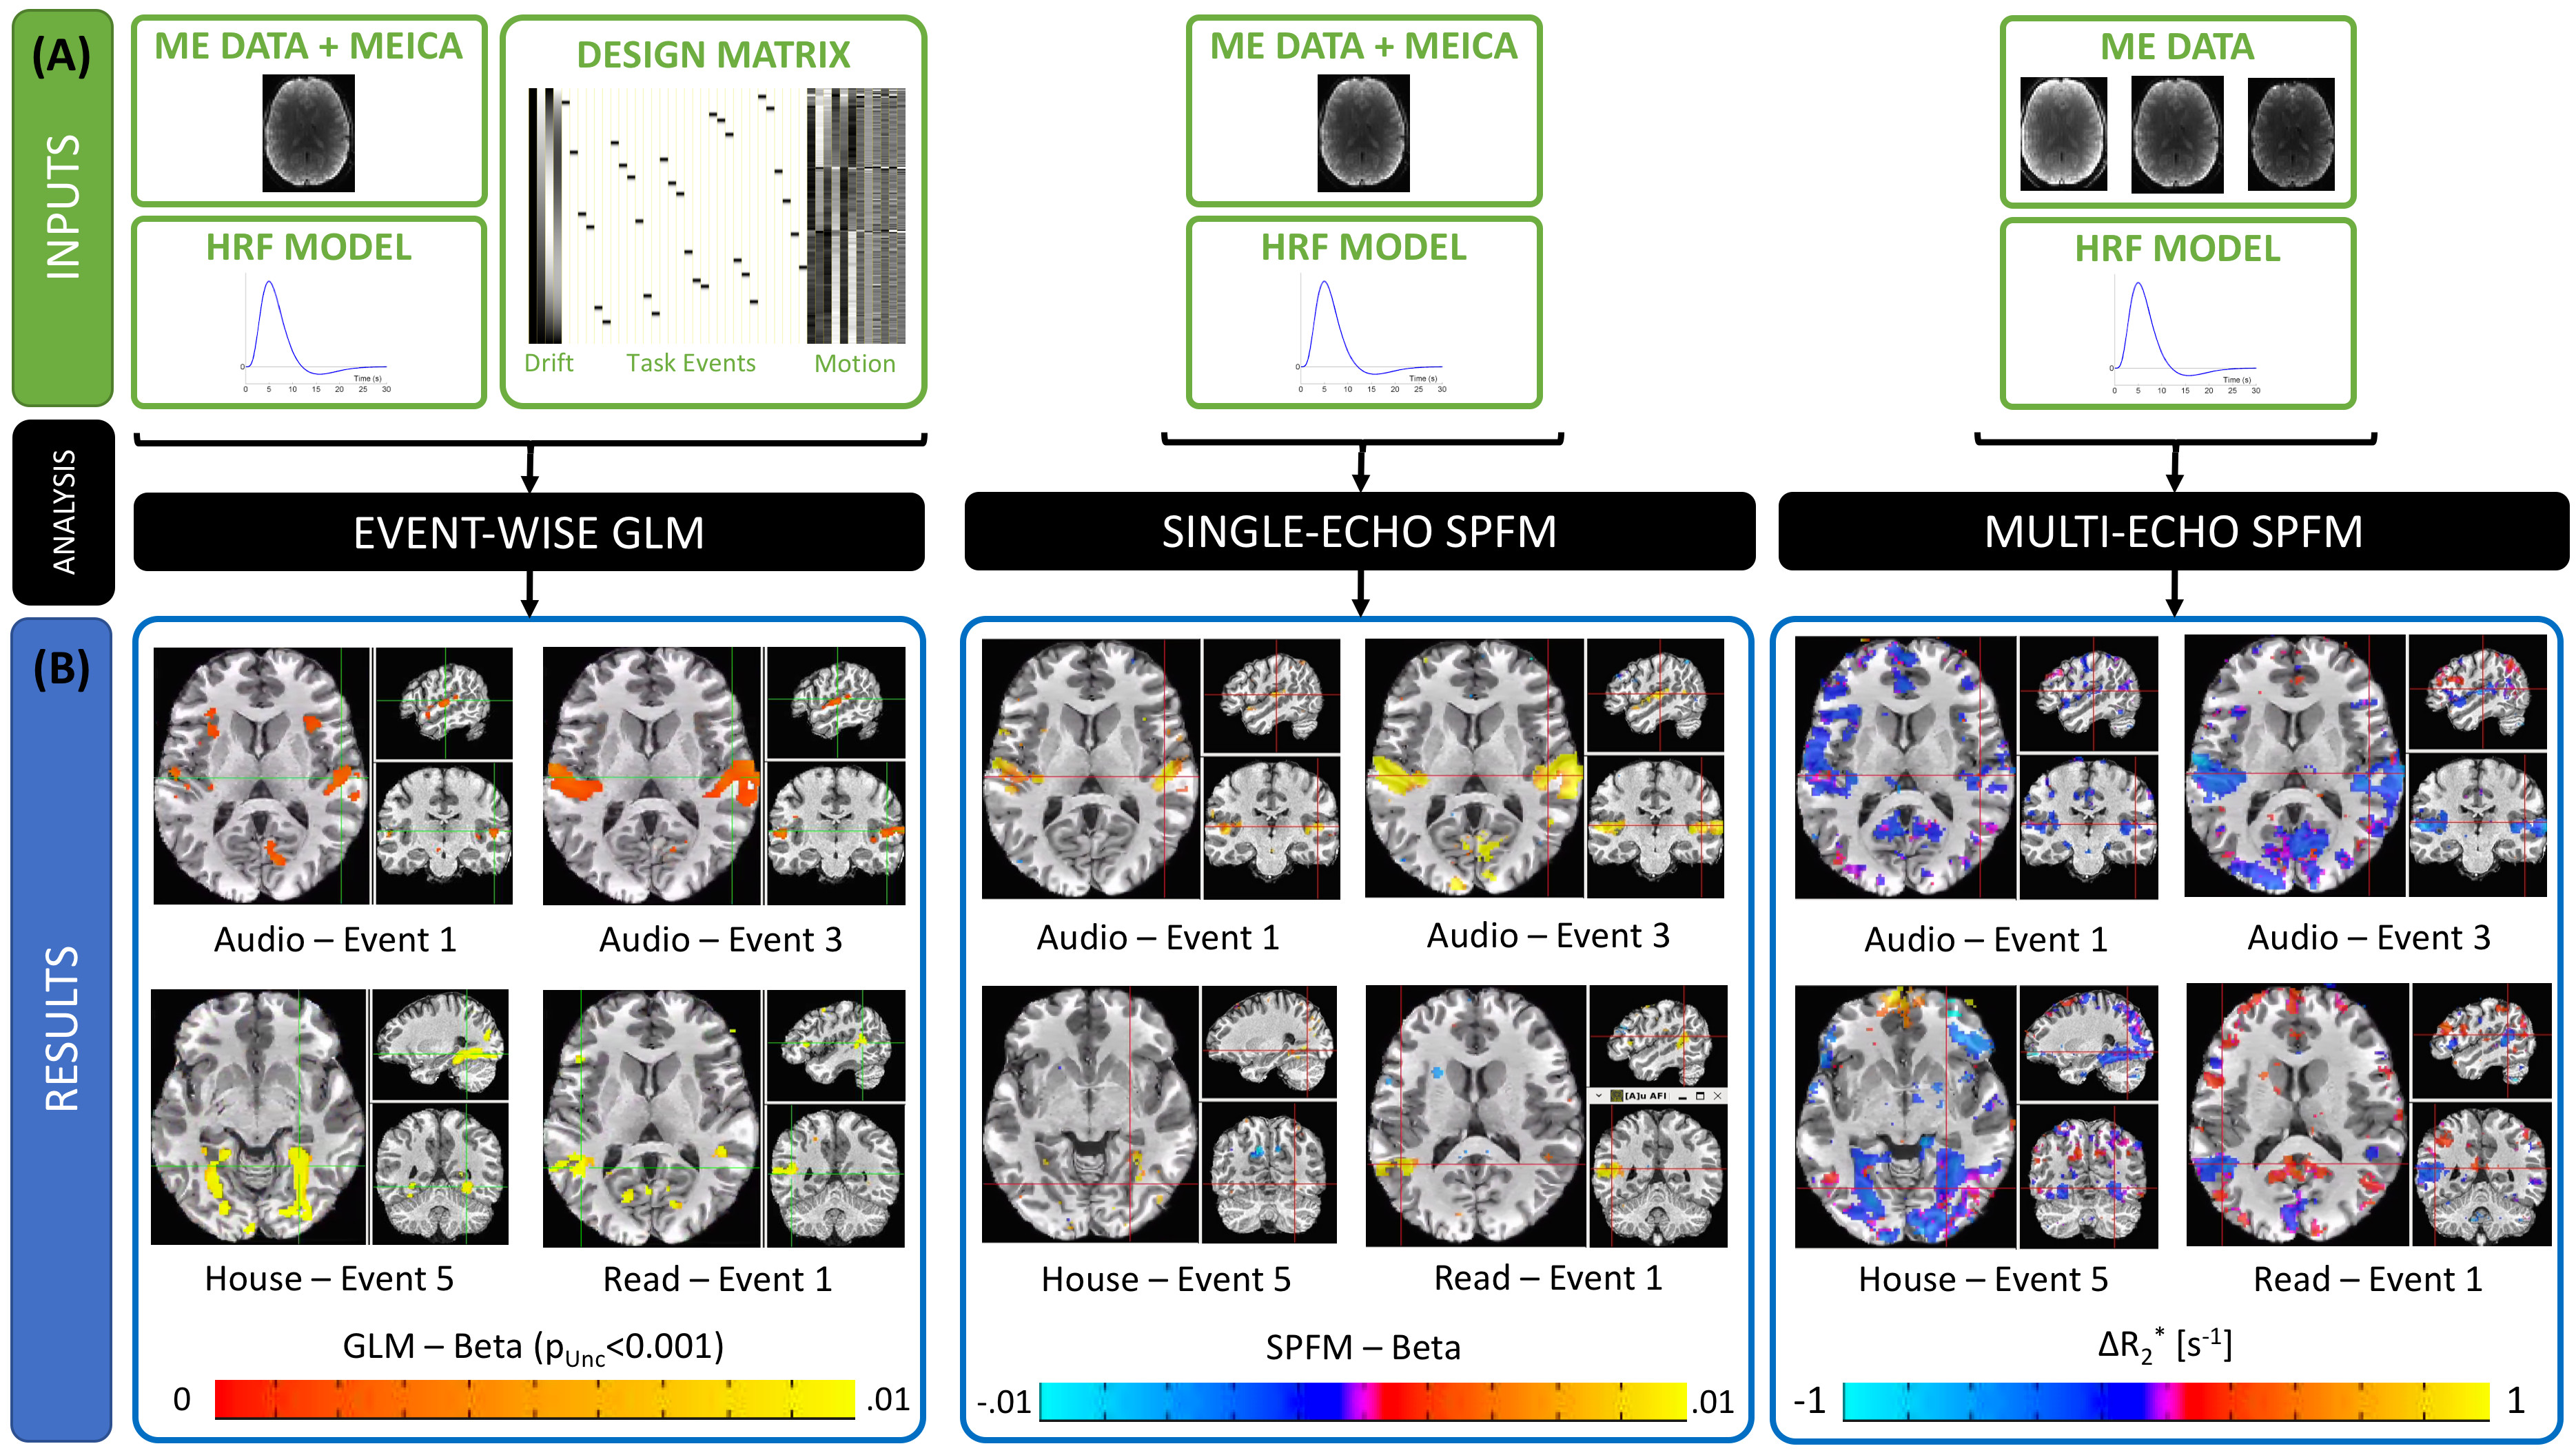
Figure 2.A depicts inputs to the three methods. Both SPFM variants lack a design matrix with event timing information. SE-SPFM uses a single time series per voxel (either middle echo, OC or MEICA); ME-SPFM uses all three echoes.
Figure 2.B shows representative activation maps for individual events in one subject. The $$$\Delta R_2^*$$$ maps from ME-SPFM more clearly resemble those from the event-based GLM approach. While SE-SPFM maps normally include the same locations as the GLM maps (i.e. high spatial specificity), they exhibit reduced sensitivity.
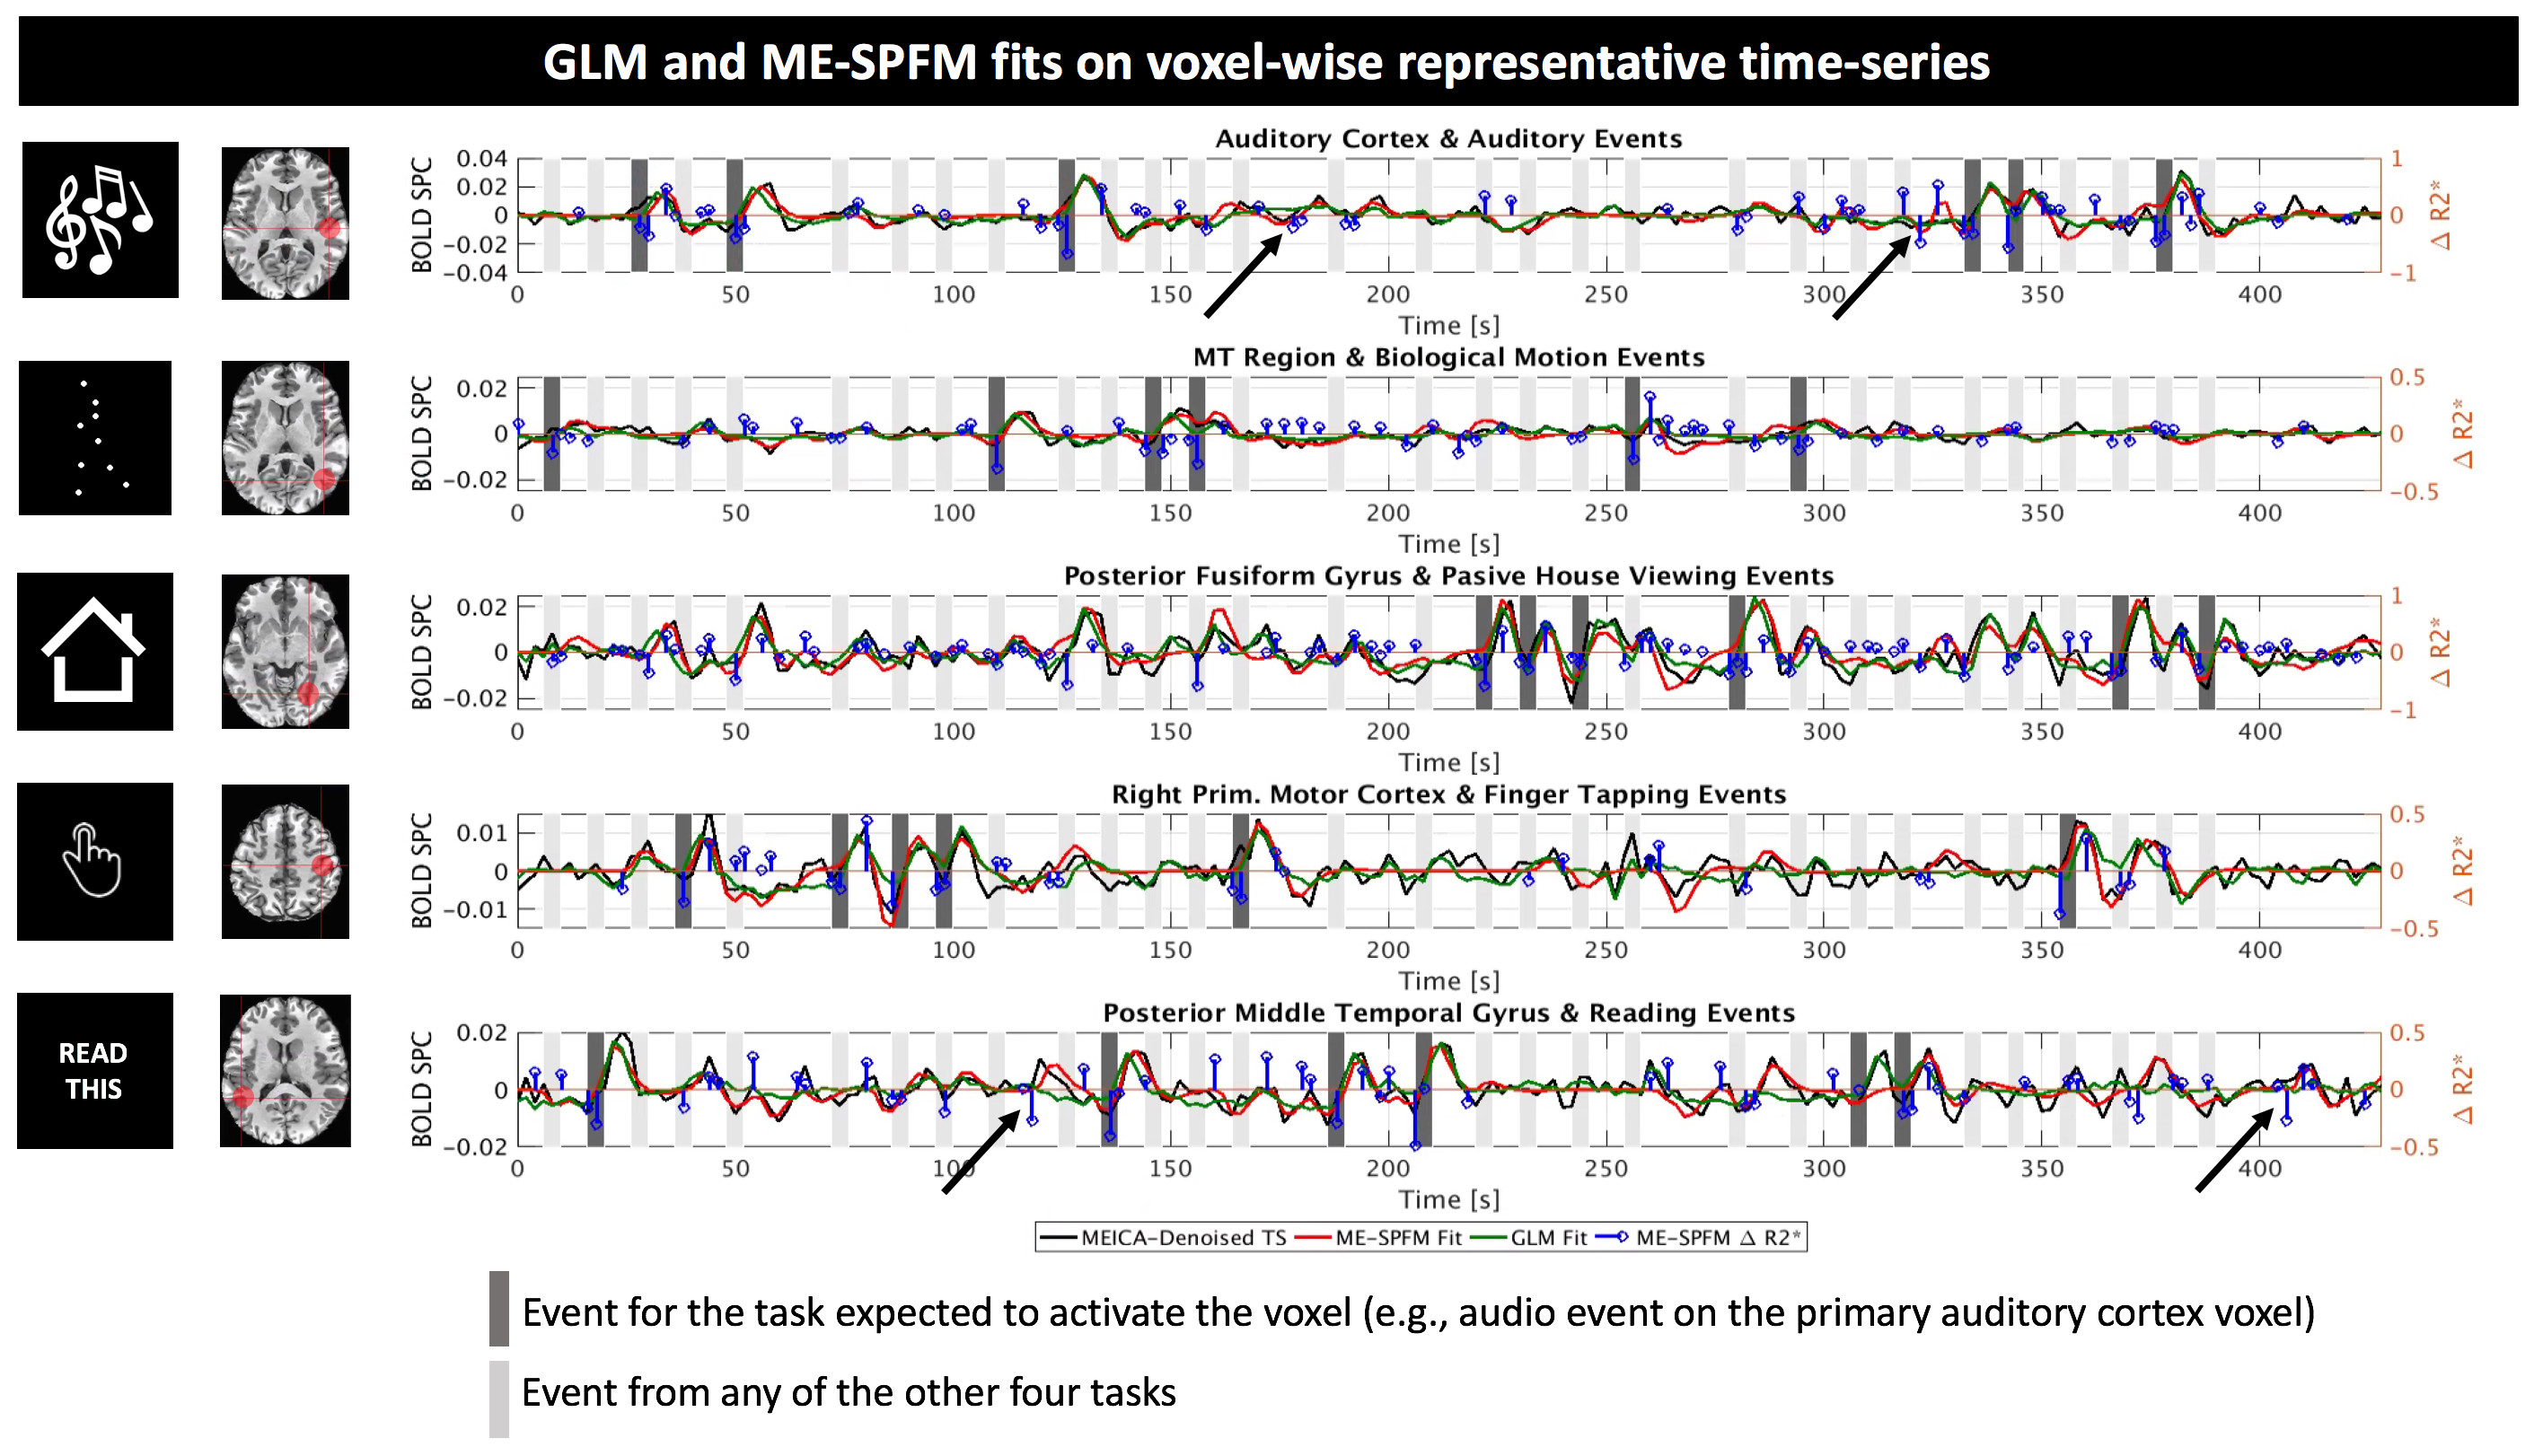
Figure 3 illustrate fits for GLM and ME-SPFM results in five representative voxels from one dataset located in areas relevant to each task. ME-SPFM reliably detected (deflection of blue trace) all experimental events (dark-grey bands). The figure also shows how ME-SPFM detects additional BOLD events that take place as scanning progresses (black arrows) but that could not be revealed by any conventional GLM approach.
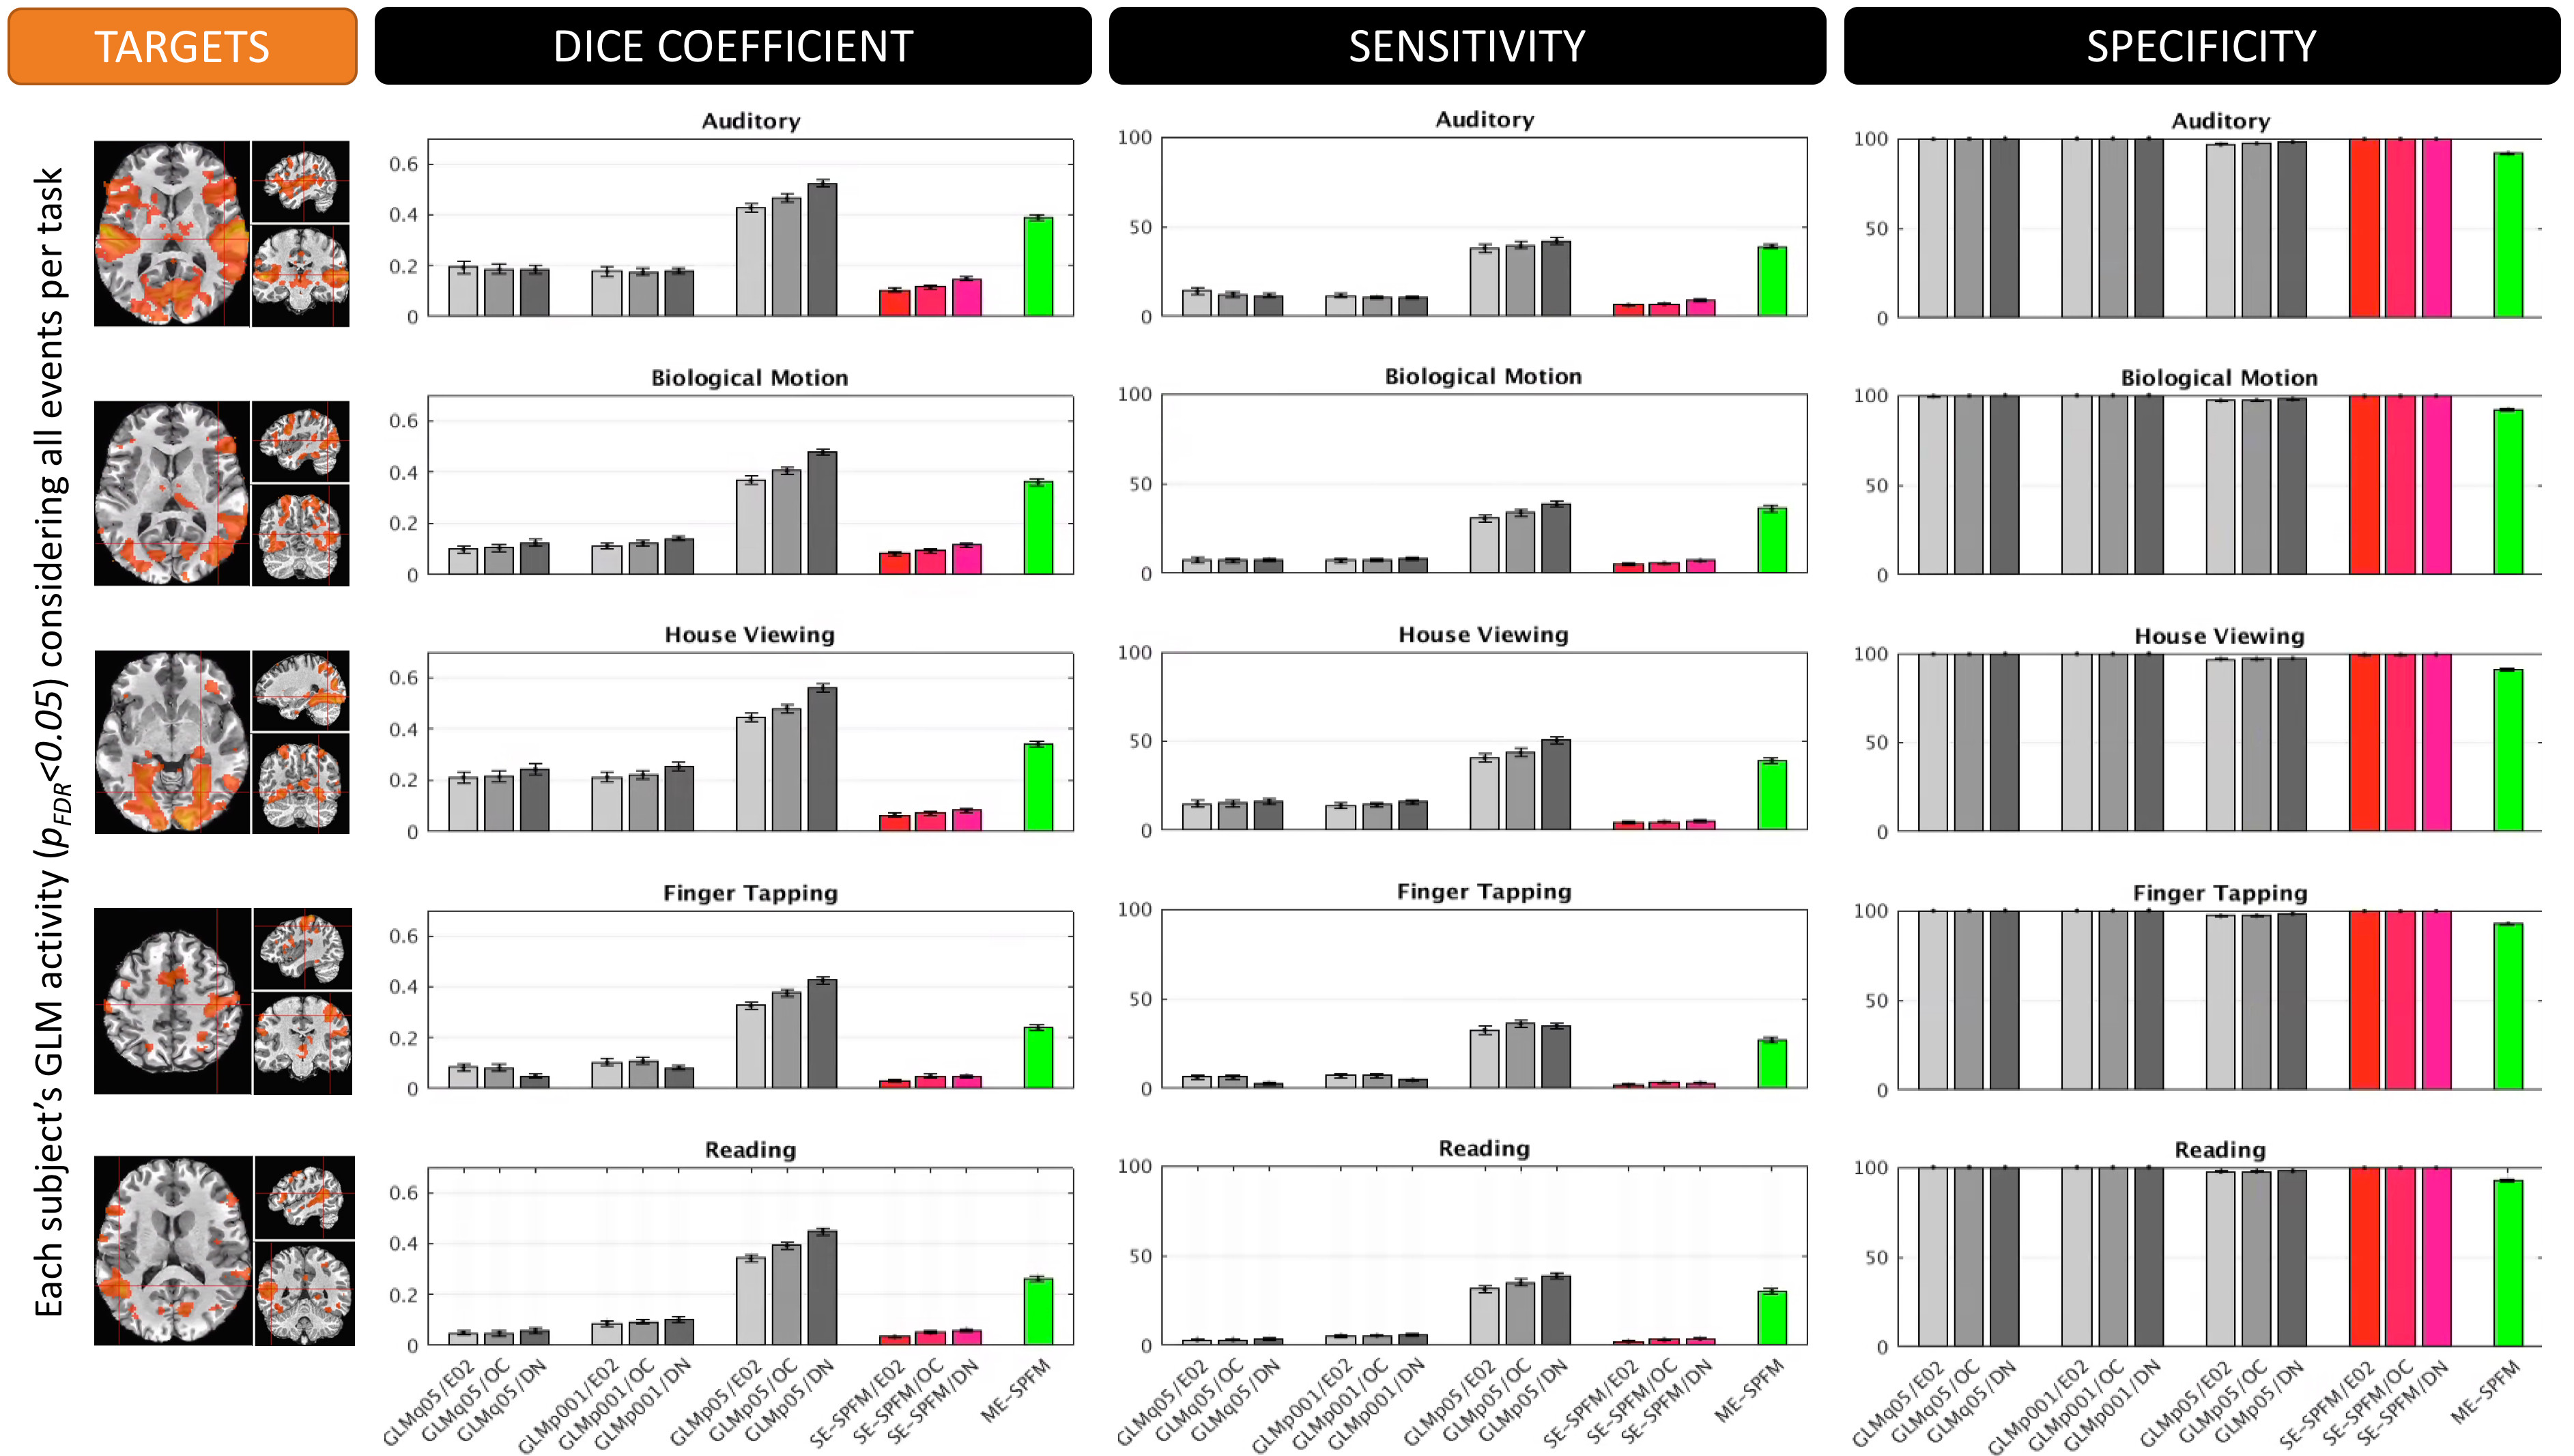
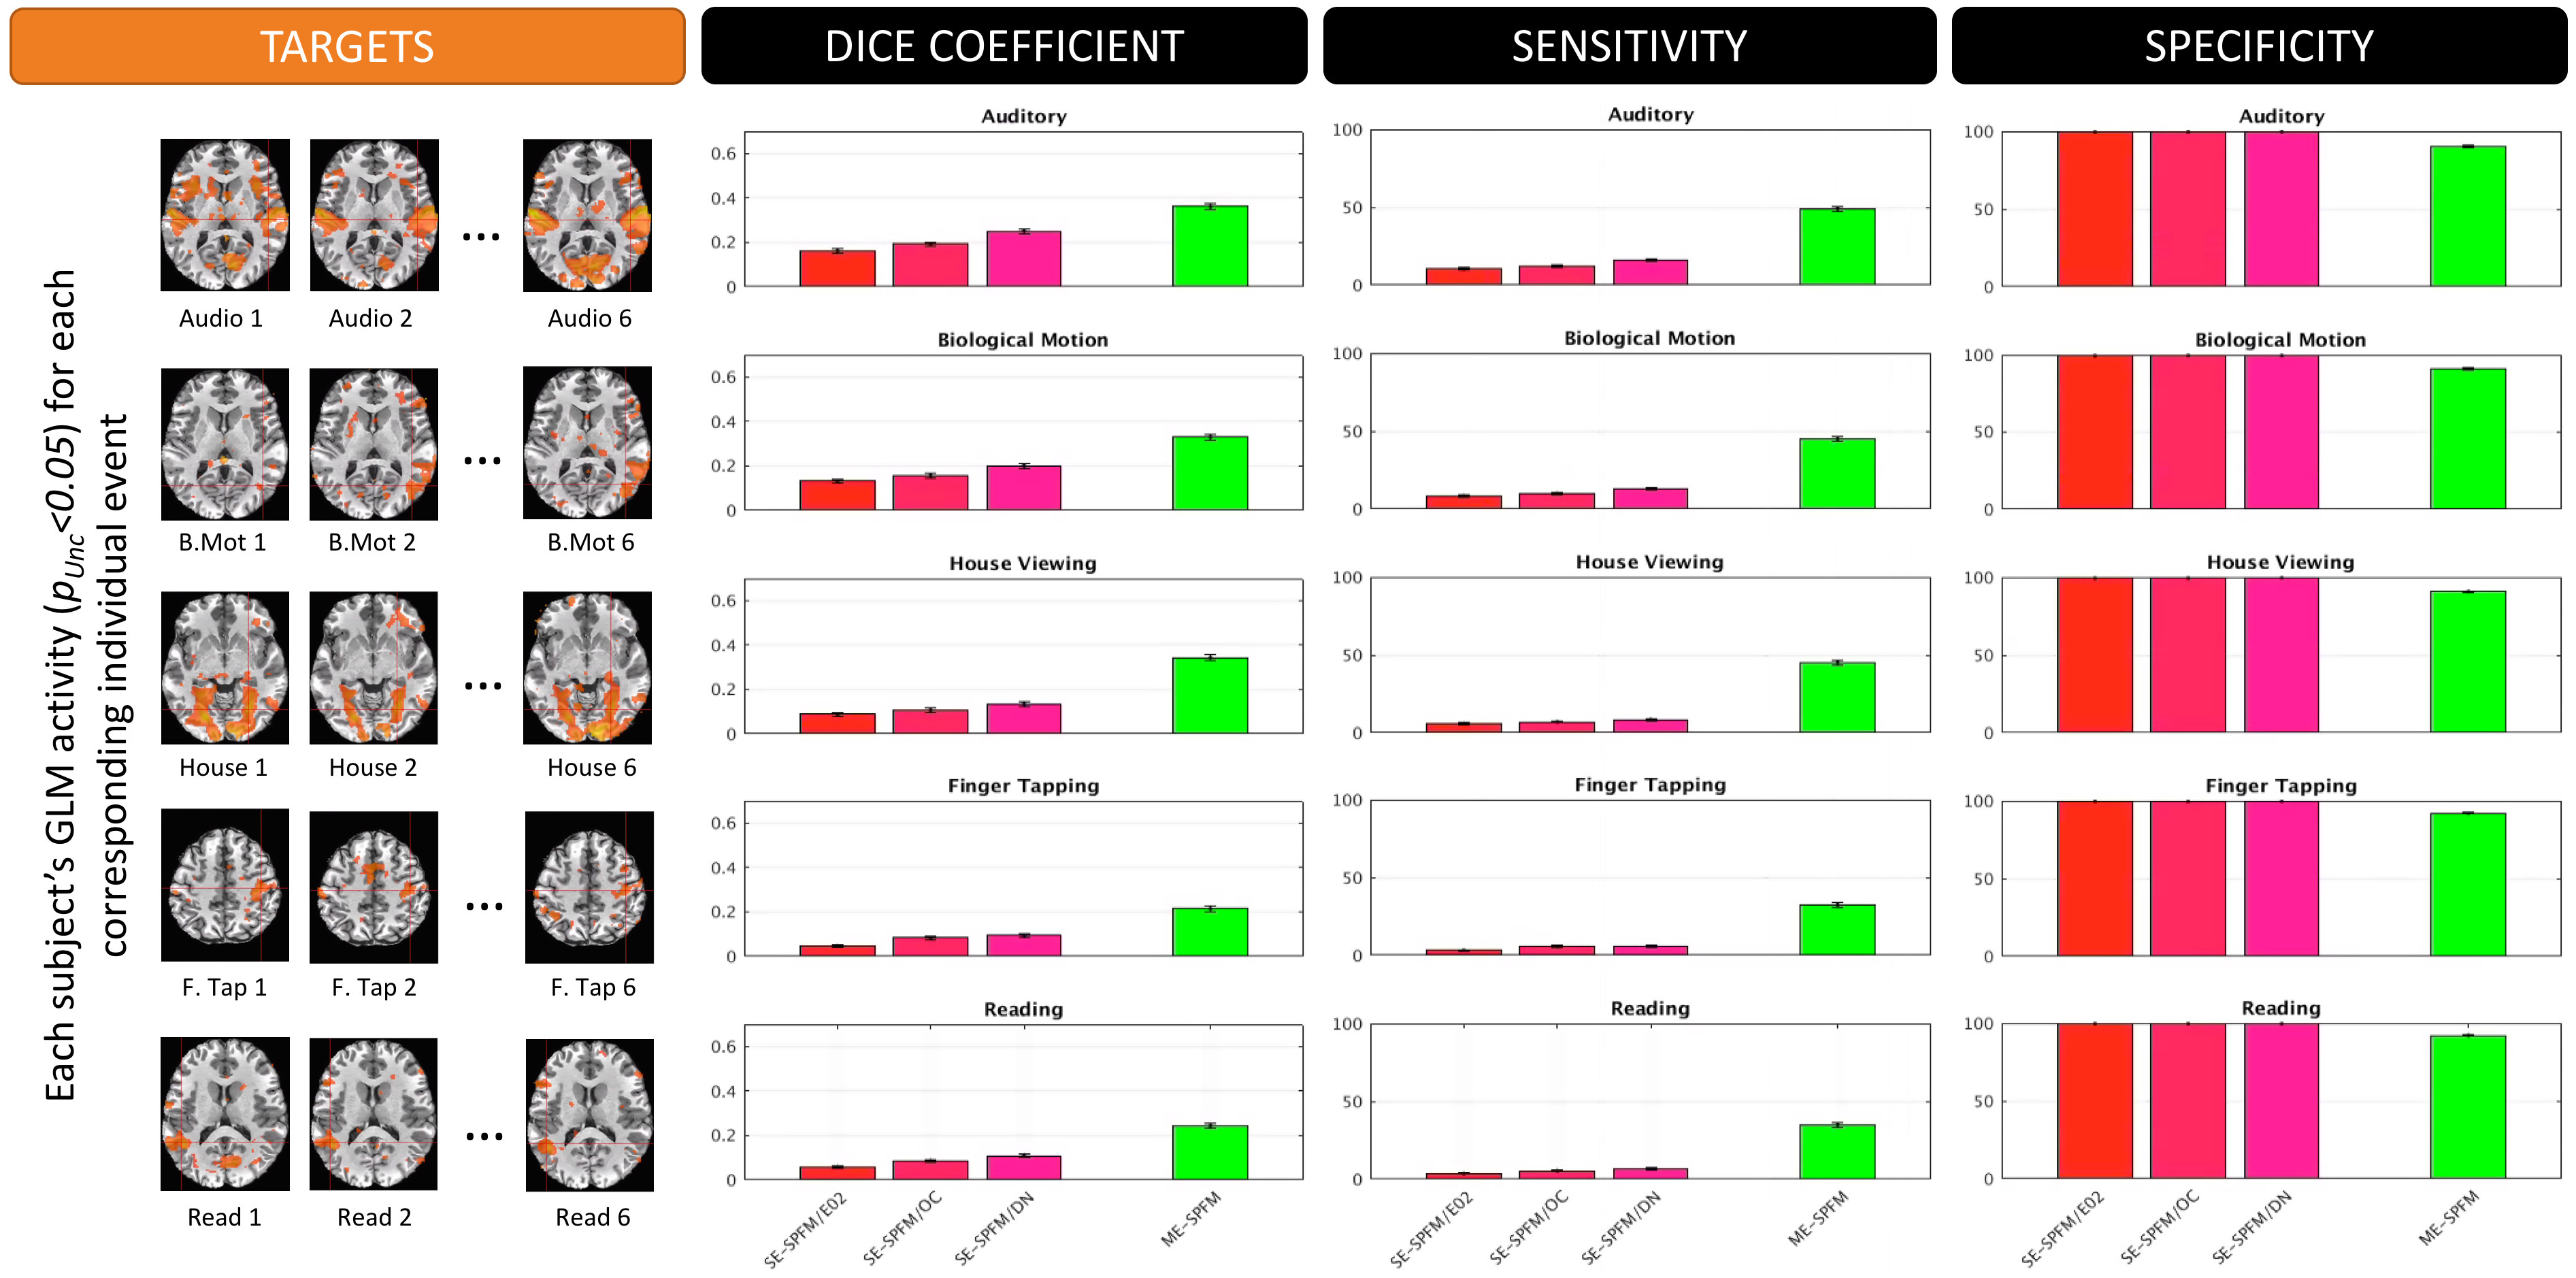
Figures 4 and 5 plot the sensitivity, specificity and dice coefficient values for the different methods using as gold standard for comparison both the task-specific (Figure 4) and trial-specific (Figure 5) GLM maps. In both instances, the ME version of the SPFM algorithm significantly outperforms its SE counterpart.
Conslusions
The ME-SPFM algorithm has significantly better specificity, sensitivity and overlap (as measured with the DICE coefficient) than its SE counterpart. Given how well ME-SPFM maps agree with traditional GLM maps, ME-SPFM can be regarded as a more reliable way to detect and explore BOLD responses beyond those linked to events with timing known by the experimenter.Acknowledgements
This research was possible thanks to the support of the National Institute of Mental Health Intramural Research Program. Portions of this study used the high-performance computational capabilities of the Biowulf Linux cluster at the National Institutes of Health, Bethesda, MD (biowulf.nih.gov). This study is part of NIH clinical protocol number NCT00001360, protocol ID 93-M-0170 and annual report ZIAMH002783-14. Dr. Caballero-Gaudes was supported by the Spanish Ministry of Economy and Competitiveness, through grant PSI 2013-42343 Neuroimagen Multimodal and the Severo Ochoa Programme for Centres/Units of Excellence in R&D (SEV-2015-490).References
[1] Posse S, Wiese S, Gembris D, Mathiak K, Kessler C, Grosse-Ruyken ML, Elghahwagi B, Richards T, Dager SR, Kiselev VG. (1999). Enhancement of BOLD-contrast sensitivity by single-shot multi-echo functional MR imaging. Magn. Reson. Med. 42, 87–97.
[2] Gowland PA, Bowtell R. (2007). Theoretical optimization of multi-echo fMRI data acquisition. Phys. Med. Biol. 52(7), 1801-1813.
[3] Kundu P, Inati SJ, Evans JW, Luh WM, Bandettini PA. (2012). Differentiating BOLD and non-BOLD signals in fMRI time series using multi-echo EPI. NeuroImage. 60, 1759-1770.
[4] Gonzalez-Castillo J, Panwar P, Buchanan LC, Caballero-Gaudes C, Handwerker DA, Jangraw DC, Zachariou V, Inati S, Roopchansingh V, Derbyshire JA, Bandettini PA. (2016). Evaluation of multi-echo ICA denoising for task based fMRI studies: block designs, rapid event-related designs, and cardiac-gated fMRI. NeuroImage 141, 452-468.
[5] Tan FM, Caballero-Gaudes C, Mullinger KJ, Cho SY, Zhang Y, Dryden IL, Francis ST, Gowland PA. (2017). Decoding fMRI events in sensorimotor network using sparse paradigm free mapping and activation likelihood estimates. Hum. Brain Mapp. 38 (11), 5778-5794.
[6] Caballero Gaudes C, Petridou N, Francis ST, Dryden IL, Gowland PA. (2013). Paradigm free mapping with sparse regression automatically detects single-trial functional magnetic resonance imaging blood oxygenation level dependent responses. Hum. Brain Mapp. 34(3), 501-518.
[7] Kundu P, Voon V, Balchandani P, Lombardo MV, Poser BA, Bandettini PA. (2017). Multi-echo fMRI: A review of applications in fMRI denoising and analysis of BOLD signals. Neuroimage 154, 59-80.
Figures