5459
Inter-site MRI scanner resolution and stability variance revealed by EPI fMRI phantom scans: a multi-site Canadian study1Rotman Research Institute, University of Toronto, Toronto, ON, Canada, 2Robarts Research Institute, Western University, London, ON, Canada, 3Medical Biophysics, Western University, London, ON, Canada, 4Sunnybrook Research Institute, Toronto, ON, Canada, 5The Mathis Centre for Mental Health Research and Education, University of Calgary, Calgary, AB, Canada, 6Department of Psychology, Behaviour and Neuroscience, McMaster University, Hamilton, ON, Canada, 7School of Life and Health Sciences, Aston University, Birmingham, United Kingdom, 8Medical Biophysics, University of Toronto, Toronto, ON, Canada
Synopsis
The Ontario Neurodegenerative Disease Research Initiative (ONDRI) and the Canadian Biomarker Integration Network in Depression (CAN-BIND) are multisite longitudinal studies that employ 12 MRI scanners across Canada (6 in CAN-BIND) to collect neuroimaging data. To ensure comparability of neuroimaging data collected at different sites, fBIRN (functional Biomedical Informatics Research Network) phantoms have been scanned approximately monthly at each site for more than two years to obtain quality assurance (QA) measures from the fBIRN pipeline. In this abstract we present our investigations into within- and between-site variations due primarily to differences in full-width-at-half-maximum (FWHM) measures of imaging resolution.
Introduction
The Ontario Neurodegenerative Disease Research Initiative (ONDRI)1 and the Canadian Biomarker Integration Network in Depression (CAN-BIND)2 are multisite longitudinal studies that employ 12 MRI scanners across Canada (6 in CAN-BIND) to collect neuroimaging data. To ensure comparability of neuroimaging data collected at different sites, fBIRN (functional Biomedical Informatics Research Network) phantoms have been scanned approximately monthly at each site for more than two years to obtain quality assurance (QA) measures from the fBIRN pipeline (http://www.nitrc.org/projects/bxh_xcede_tools).These measures have been used to assess inter- and intra-scanner variability and the impact of preprocessing choices to reduce such variability.Methods
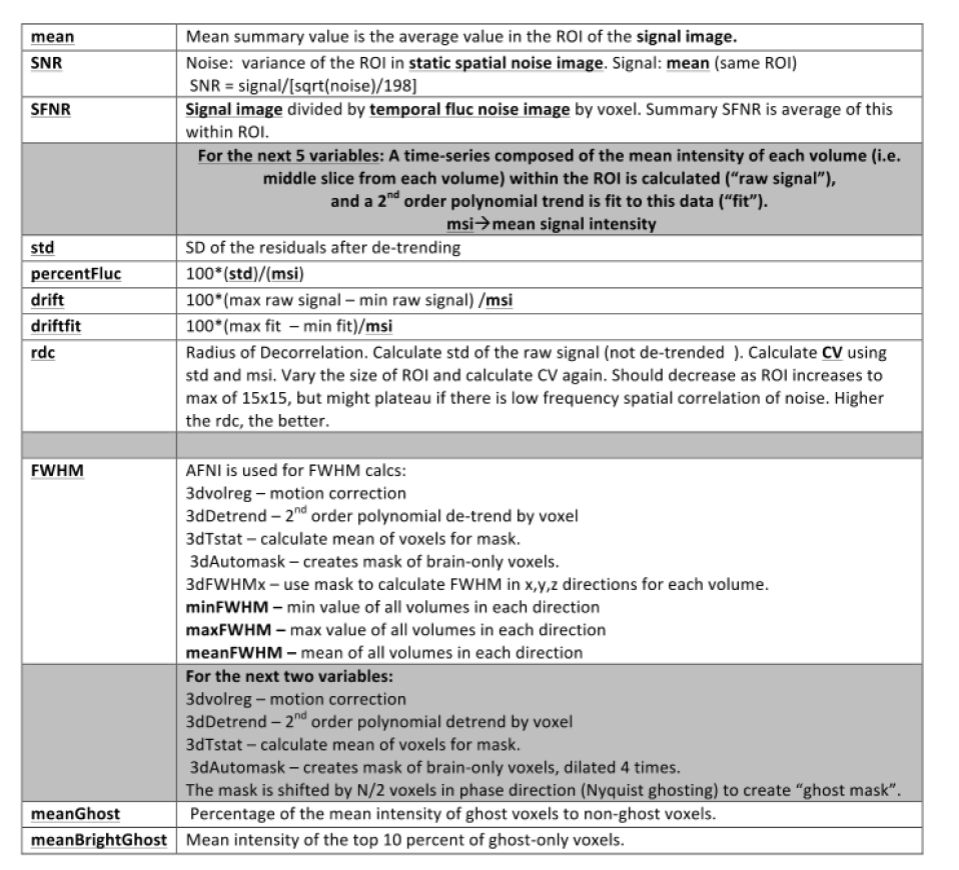
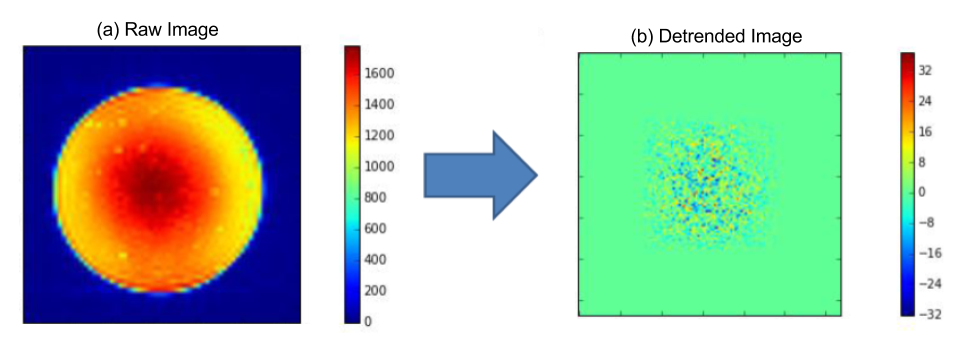
fBIRN phantoms were scanned using fMRI EPI sequences using 3T MRIs (GE Discoveries at CAMH Toronto (CAM), Hamilton (HAM), Sunnybrook Hospital Toronto (SBH), Toronto Western Hospital (TWH), University of Calgary (UCA); Siemens at Baycrest Toronto (BYC)-Trio, London, Ontario (LDN)-Prisma, Queen's University (QNS)-Trio, St. Michael’s Hospital Toronto (SMH)-Skyra, The Ottawa Hospital (TOH)-Trio; Phillips Achievas at Thunder Bay Regional Health (TBR), University of British Columbia (UBC)). 16 fBIRN quality assurance (QA) pipeline parameters (Table 1) from 353 scans were analysed using principal component analysis (PCA). To reduce inter-scanner variance caused by differences in imaging resolution, all scans were also smoothed to FWHM = 7 mm using AFNI’s 3dBlurToFWHM3, and the fBIRN QA pipeline was rerun and QA measures again analysed using PCA. To further investigate the effect of spatial resolution on within- and between-site variance at the slice level per TR volume, we implemented a measure of resolution based on the noise autocorrelation function (ACF) per slice by: (1) detrending each voxel time series with Legendre polynomials of up to second order to remove spatial structure of the phantom (Figure 2), and (2) assuming the detrended image is a wide-sense stationary random process, ACF was computed per slice as the inverse Fourier transform of the power spectrum of the detrended image (Wiener-Khinchin theorem). Spatial resolution was consequently quantified in terms of the FWHM of the ACF along the x, y, +45°, and -45° axes for each slice. In each scan session, outliers per slice were detected if the FWHM, in each of the 4 directions, exceeded 2x median FWHM in that direction. Finally, to assess the efficacy of fMRI preprocessing pipelines for removing spatial non-uniformities and outliers, we preprocessed the images using a tool for Optimization of Preprocessing Pipelines for NeuroImaging (OPPNI)4, including motion correction, censoring, and second-order detrending. ACF analyses were consequently performed on the preprocessed images and compared with those of unpreprocessed images.Results
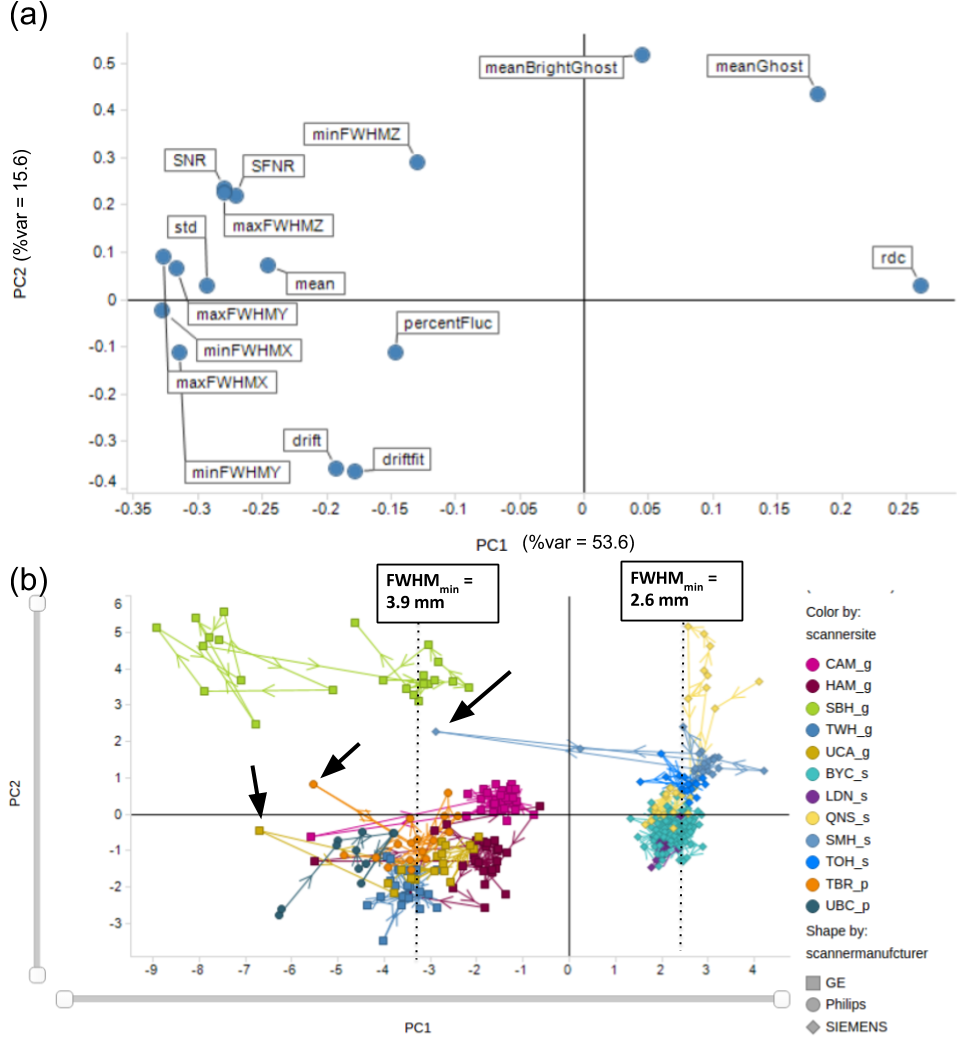
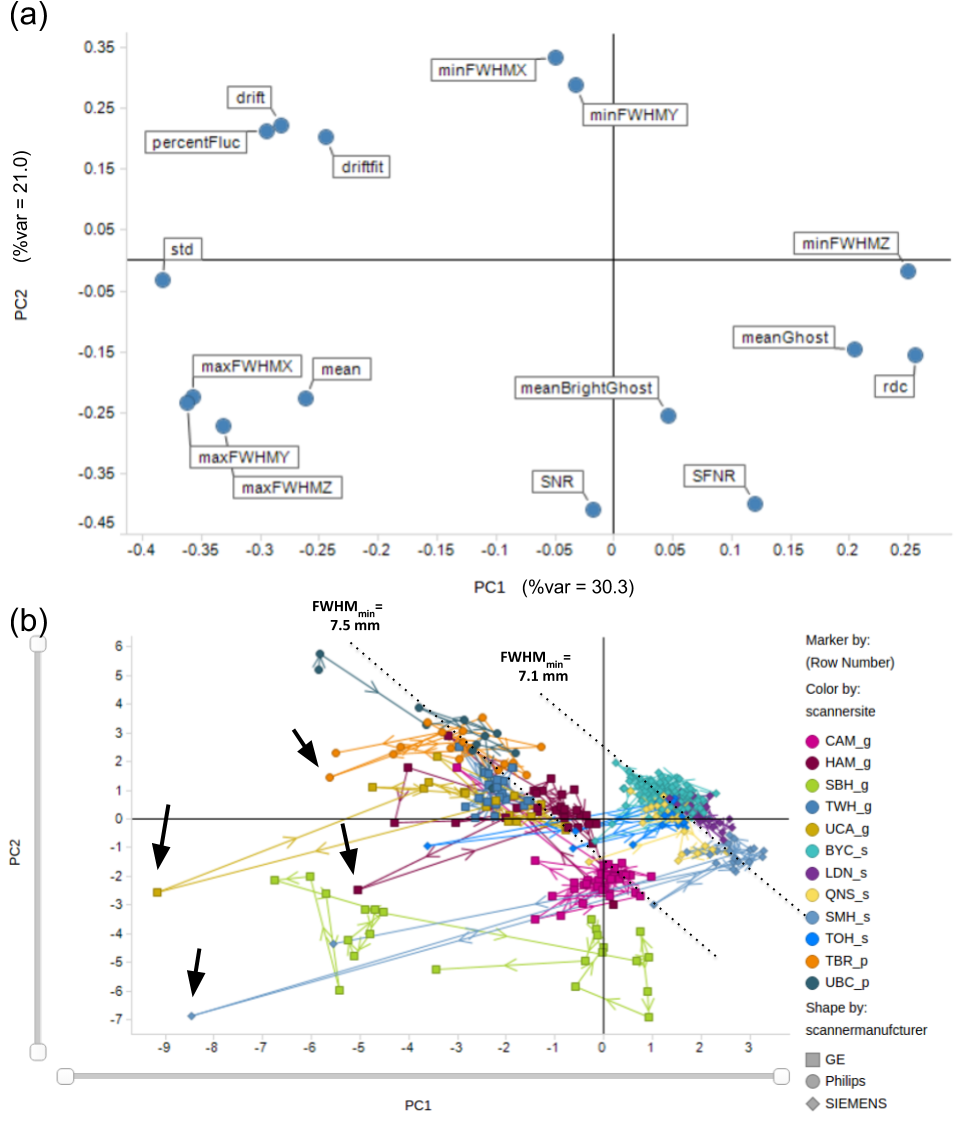
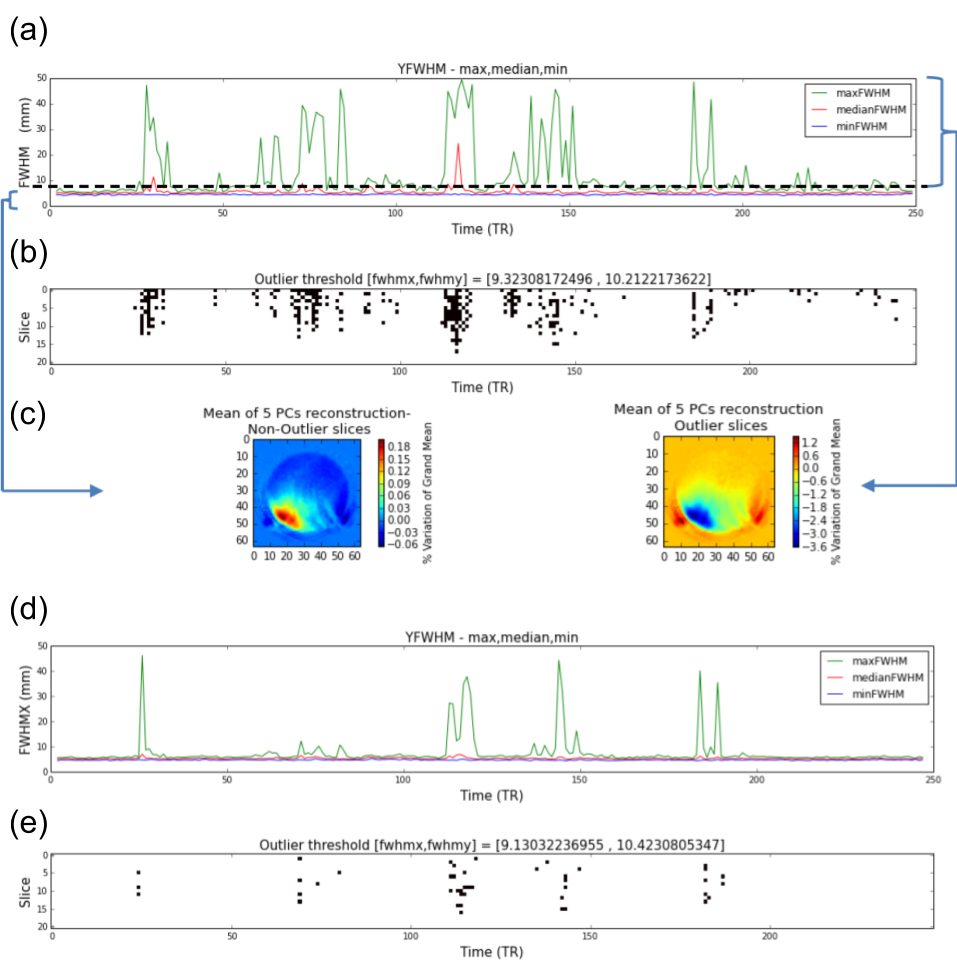
The results of PCA analysis of unfiltered (non-smoothed) images are shown in Figure 1. PC1 is primarily driven by measures of FWHM and radius of decorrelation (RDC) (which is highly anticorrelated with FWHM measures), while ghosting and drift appear to be the primary factors driving PC2 (Figure 1(a)). There is a prominent inter-scanner separation along PC1, with Siemens scanners on one side and GE and Philips scanners on the other (Figure 1(b)). While within-site variance is generally smaller than between-site variance, several sites show prominent within-site outlier sessions. Figure 3 summarizes PCA results after spatial smoothing. Spatial smoothing is manifested in reduced %variance of the first two PCs. PC loadings show correlations between FWHM measures and PC1 and PC2, resulting in vendor-based inter-scanner separation along both PC1 and PC2 after spatial smoothing (Figure 3(b)). Outlier detection based on ACF FWHM is illustrated for a UCA scan in Figure 4 (a-c). Figure 4 (d,e) illustrate the extent to which OPPNI preprocessing is capable of removing outliers for this scan. Similar analyses revealed per-slice outliers in several scans from SBH, TBR, UBC, and UCA, which may be reduced, but not completely eliminated, by fMRI preprocessing.Discussion
Scanner vendor (i.e., GE, Siemens, Philips) appears to be a major source of inter-scanner variance, primarily due to FWHM differences, which is attributed to different image reconstruction techniques employed by different vendors. While spatial smoothing to some extent reduces inter-scanner FWHM differences, within-site outlier sessions are exacerbated by spatial smoothing (Compare Figure 1(b) and Figure 3(b)). This prompted further investigations through per-slice ACF analysis, which resulted in identification of several scan sessions over a number of study sites with severe per-slice outliers and non-uniformities. These non-uniformities presumably account for a significant proportion of the variability in fMRI time series. We are currently investigating these instabilities and their impact on human resting-state scans, as well as improved preprocessing pipelines that further reduce scanner variability.Acknowledgements
No acknowledgement found.References
1. Farhan SMK, Bartha R, Black SE, et al.: The Ontario Neurodegenerative Disease Research Initiative (ONDRI). Can J Neurol Sci 2017; 44:196–202.
2. Lam RW, Milev R, Rotzinger S, et al.: Discovering biomarkers for antidepressant response: protocol from the Canadian biomarker integration network in depression (CAN-BIND) and clinical characteristics of the first patient cohort. BMC Psychiatry 2016; 16:105.
3. Cox RW: AFNI: software for analysis and visualization of functional magnetic resonance neuroimages. Comput Biomed Res 1996; 29:162–173.
4. Churchill NW, Spring R, Afshin-Pour B, Dong F, Strother SC: An Automated, Adaptive Framework for Optimizing Preprocessing Pipelines in Task-Based Functional MRI. PLoS One 2015; 10:e0131520.
Figures