5458
Velocity Selective Inversion improves the sensitivity and speed of perfusion weighted FMRI1FMRI laboratory, University of Michigan, Ann Arbor, MI, United States
Synopsis
This work compares the performance of pseudo-continuous ASL (PCASL) and velocity selective inversion ASL (VSI) for functional MRI using a simple, robust visual motor task. VSI showed increased sensitivity and allowed faster temporal resolution, resulting in further increases in sensitivity.
Introduction
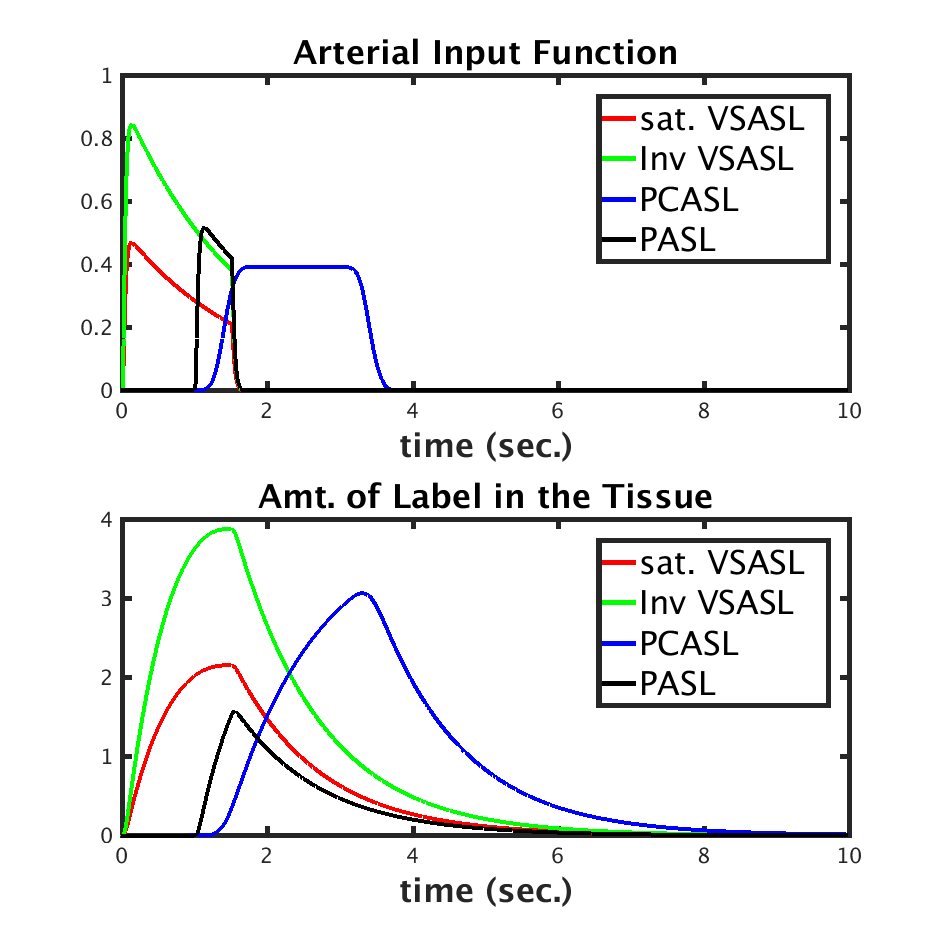
Velocity Selective Inversion (VSI) pulses have been recently demonstrated as an attractive option for Arterial Spin Labeling (ASL) perfusion imaging because of potential gains in signal to noise ratio (SNR) and decreased sensitivity to bolus arrival time variations. Figure 1 shows simulations of the input function and observed ASL signal for several ASL labeling schemes. These simulations suggest that significant gains can be expected using VSI relative to PASL and PCASL techniques. Here, we explore the utility of VSI for ASL in terms of its SNR and sensitivity to brain activity. We also explore potential gains in temporal resolution relative to (pseudo) continuous ASL, currently the most popular and efficient ASL technique.
Methods
Subjects (N=6) were scanned using a 3.0T MR750 scanner (GE, Waukesha, WI). The subjects were instructed to tap their fingers of their right hand for 20 seconds while being stimulated with an 8Hz flashing checkerboard pattern. The stimulus was repeated 5 times, preceded by 40 seconds of inactivity (total time = 300sec).
This experimental paradigm was repeated four times while the subjectswere scanned with the following four ASL sequences. (1) PCASL labeling for 1600ms, followed by 1800 ms PLD, TR = 4000 (2) VSI label followed by 1800 ms Post Labeling Delay (PLD), TR = 4000 (3) VSI label followed by 1800 md PLD, TR = 3000 ms and (4) VSI label followed by 1200 ms, TR = 2000 ms.
Acquisition in all four cases was done with a 3D stack of spirals sequence (64 x64 x 16 matrix, 3.44 x 3.44 x 6 mm voxel size). No background or arterial suppression pulses were used. VSI pulses were generated using the method described by Qin et al [Qin 2016]. Off resonance correction for the PCASL pulses was calibrated and applied, as recommended in [Jahanian 2011 ].
The time series was reconstructed, motion corrected, smoothed with 6 mm Gaussian kernel and surround subtracted. Linear regression was used to detect and estimate stimulus related activation, including nuisance regressors identified using the compCor technique. Z score maps corresponding to the activation were calculated from the resulting estimates. The number of voxels with a Z score greater than 3 within the brain were tabulated for each case. Spatial noise was defined as the standard deviation of the temporal mean magnitude of pixels outside the brain. Temporal noise was defined as the temporal standard deviation averaged over all the pixels inside the brain. Spatial and temporal SNR were defined as the mean ASL signal inside the brain divided by the temporal and spatial noise, respectively.
Results
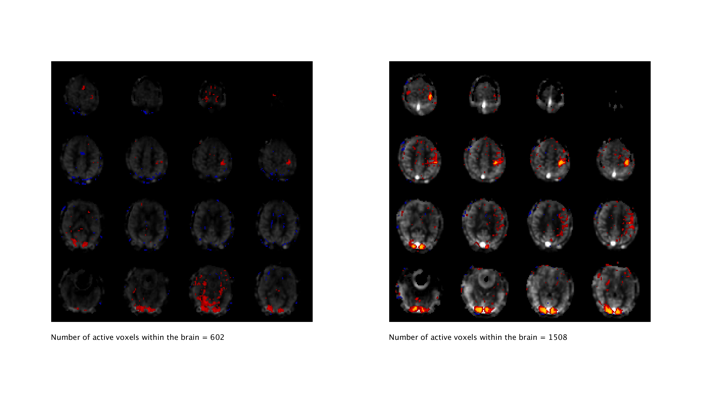
Activation maps (thresholded at Z>3) from a representative subject collected with the PCASL sequence (TR = 4 sec) and with the VSI sequence (TR=3) are shown in figures 2 and 3, overlaid on their corresponding perfusion weighted image. Table 1 shows the temporal and spatial SNR of the VSI acquisitions, as well as the number of active voxels and their mean z score, expressed as a percentage relative to PCASL and averaged over subjects.
Perfusion weighted images collected using the VSI labeling scheme showed significant improvement in temporal and spatial SNR relative to PCASL. VSI acquisition with the same TR as PCASL did not yield significantly higher Z scores within the regions commonly activated by all four acquisitions. However, faster VSI acquisitions increased the Z scores significantly. The number of voxels activated also increased significantly in reduced TR acquisitions. We observed that, when the post label delay was reduced to 1.2 sec (TR=2 sec), significant contribution from the vasculature was evident in the images.
Discussion
VSI timing parameters were chosen based on measurements of the label uptake curves (data not shown). We hypothesize that the VSI sequence has superior SNR, relative to PCASL, because of the reduced transit time between labeling and arrival at the tissue. We also hypothesize that the inversion process also reduces the contribution of physiological fluctuations by reducing the contribution of stationary spins. We also found that the VSI sequence was more sensitive to activation than PCASL. Furthermore, VSI permits reduction of TR, which in turn allows for faster sampling of the perfusion time series, and thus further SNR and sensitivity gains. When the post labeling delay is reduced along with TR, the contribution of the vasculature to the ASL signal increases, but this also increases the sensitivity to brain activity, consistent with previous work [Jahanian 2015]Conclusion
This work compares the performance of PCASL and velocity selective inversion ASL for functional MRI using a simple, robust, visual-motor task. VSI showed increased sensitivity and allowed faster temporal resolution, resulting in further increases in sensitivity.Acknowledgements
National Institutes of Health (R21EB021562)References
Nielsen (2013). Magnetic Resonance in Medicine, 69(2).
Qin (2016). Magnetic Resonance in Medicine, 76(4), 1136–1148.
Jahanian (2015) Magnetic Resonance in Medicine, 73(3), 1053-1064
Jahanian (2011) NMR in Biomedicine, 24(10), 1202–1209.
Figures