5456
A comprehensive investigation of physiologic noise modeling in resting state fMRI; phase shifted cardiac response function in EPI1Radilogy, Cleveland Clinic, Cleveland, OH, United States
Synopsis
The cardiac and respiratory response functions derived from RETROICOR have substantial variation. In this study, we investigate the source of this variation. We found the cardiac response function is phase or time shifted across the brain while the respiratory function has a fixed phase, but changes polarity across the brain. We further investigated the efficacy of physiologic noise correction accounting for this with a single response function model.
Purpose
To investigate the observed large variation of the physiologic response functions in rs-fMRI.Method
Twelve healthy controls were scanned at 3T using single band EPI with pulse oximeter and respiratory belt recording (TR=2.8s, 128x128 matrix, 31 slices, 132 repetitions). After the first 4 volumes were removed, the voxelwise time series signals were detrended with the 3rd order polynomial fitting and normalized. RETROICOR [1] was conducted using the second harmonic Fourier model (M=2). From voxels with the top 5% of F values of each cardiac and respiratory model, coefficients of the first and the second harmonic sine and cosine terms were stored, and the voxelwise cardiac and respiratory response functions were reconstructed over phases across subjects.
Physiological noise correction was conducted with the single response function assumption; the average cardiac and respiratory response functions were calculated from voxels with in the top 5% of F values of each RETROICOR model as described above. Using the defined average response functions and phase at each slice acquisition timing, the corresponding cardiac and respiratory signals were calculated at each slice and volume. Then, cardiac and respiratory signals from each response function were regressed out in voxelwise time series EPI data. Note that RETROICOR has 8 regressors ( or degrees of freedom; DOF) with first and second harmonic cosine and sine terms from cardiac and respiratory phases, while the single response function model has 2 DOF from each averaged cardiac and respiratory response function.
Result and Discussion
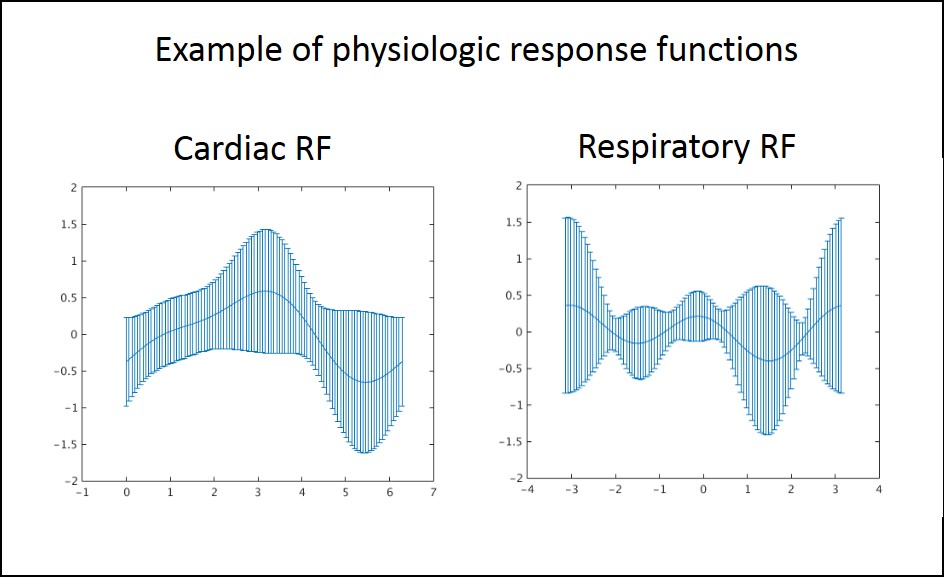
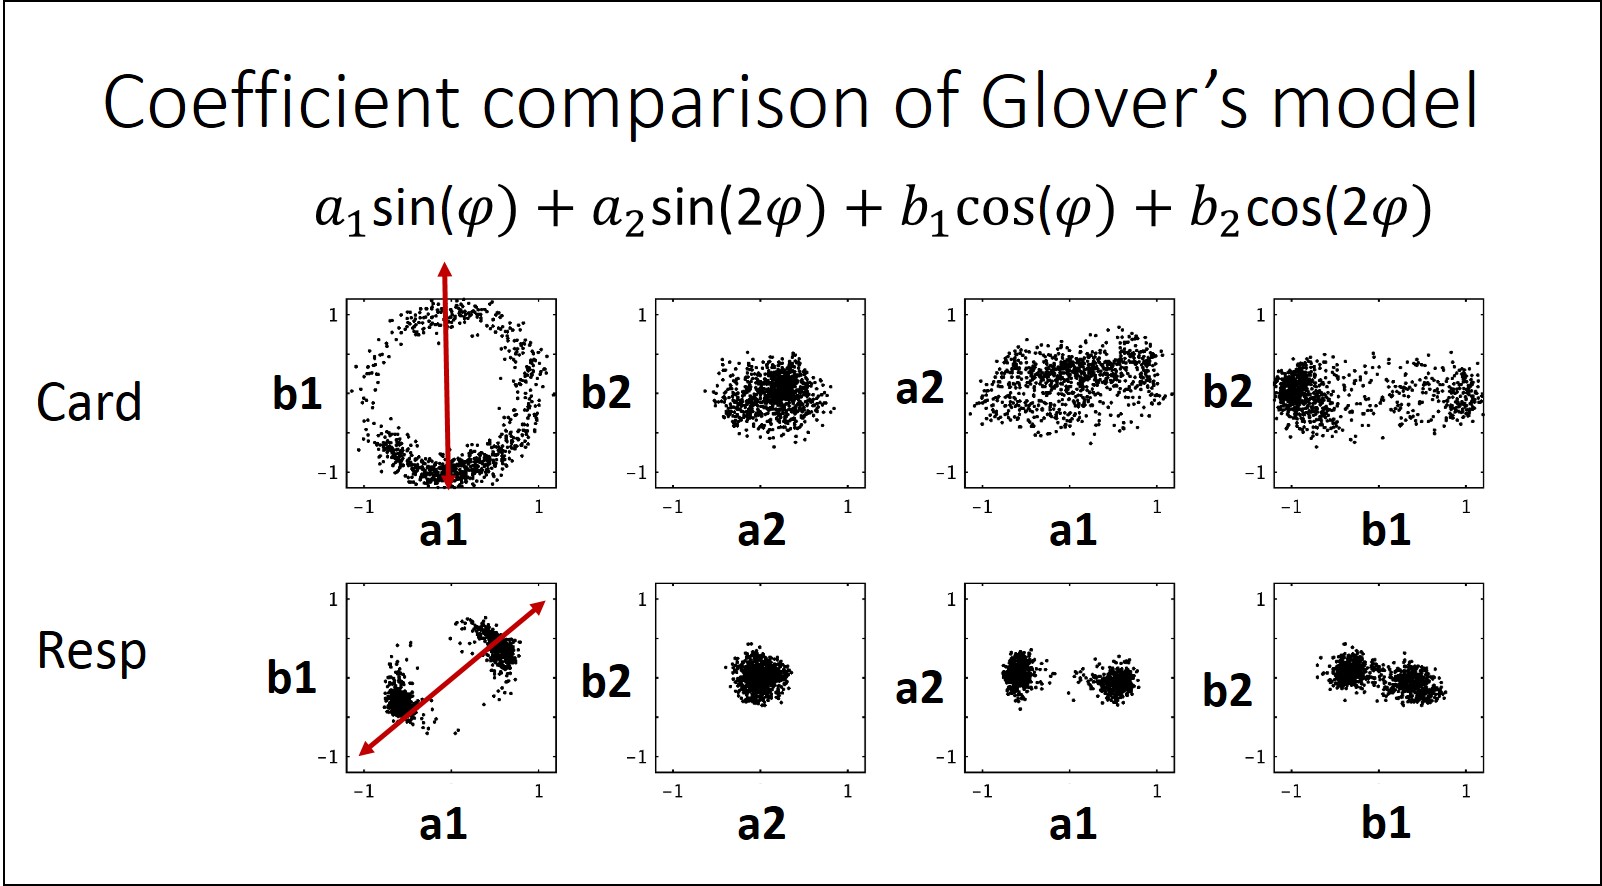
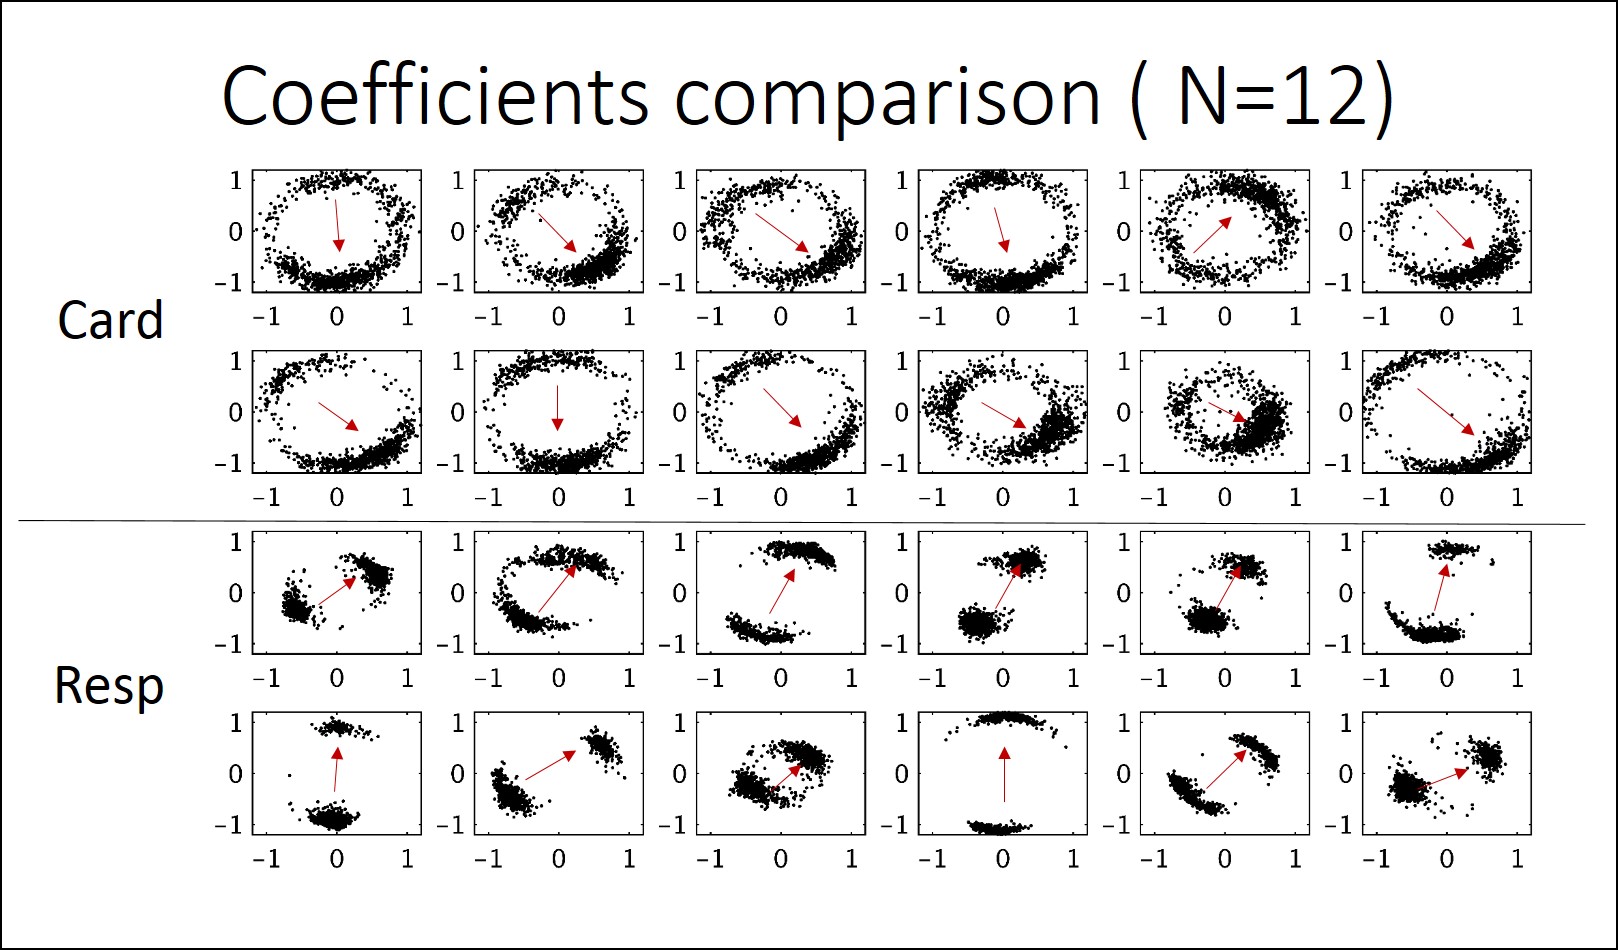
We found the large variation of the response functions and the strange banding error bars, as shown in Fig1. To understand this large and non-uniform variation in the response function, coefficients of the first and the second harmonic sine and cosine terms were plotted, as shown in Fig2. The relationship between the first harmonic coefficients of cosine and sine terms indicates that a) the average cardiac and respiratory response functions exist, shown by the main direction (red arrows), and b) the phase of cardiac response function varies while respiratory response function has a constant phase with fixed polarity. To test if this finding is consistently observed in all subjects, all the subjects were investigated, visualized in Fig3.
To correct the polarity, average cardiac and respiratory response functions were calculated and voxelwise response functions were polarity (±) corrected to consider the correlation with average response function. To correct the phase, the arctangent between coefficients of the first harmonic cosine to sine terms in the voxelwise response function were calculated and the calculated phase was added in the response function.
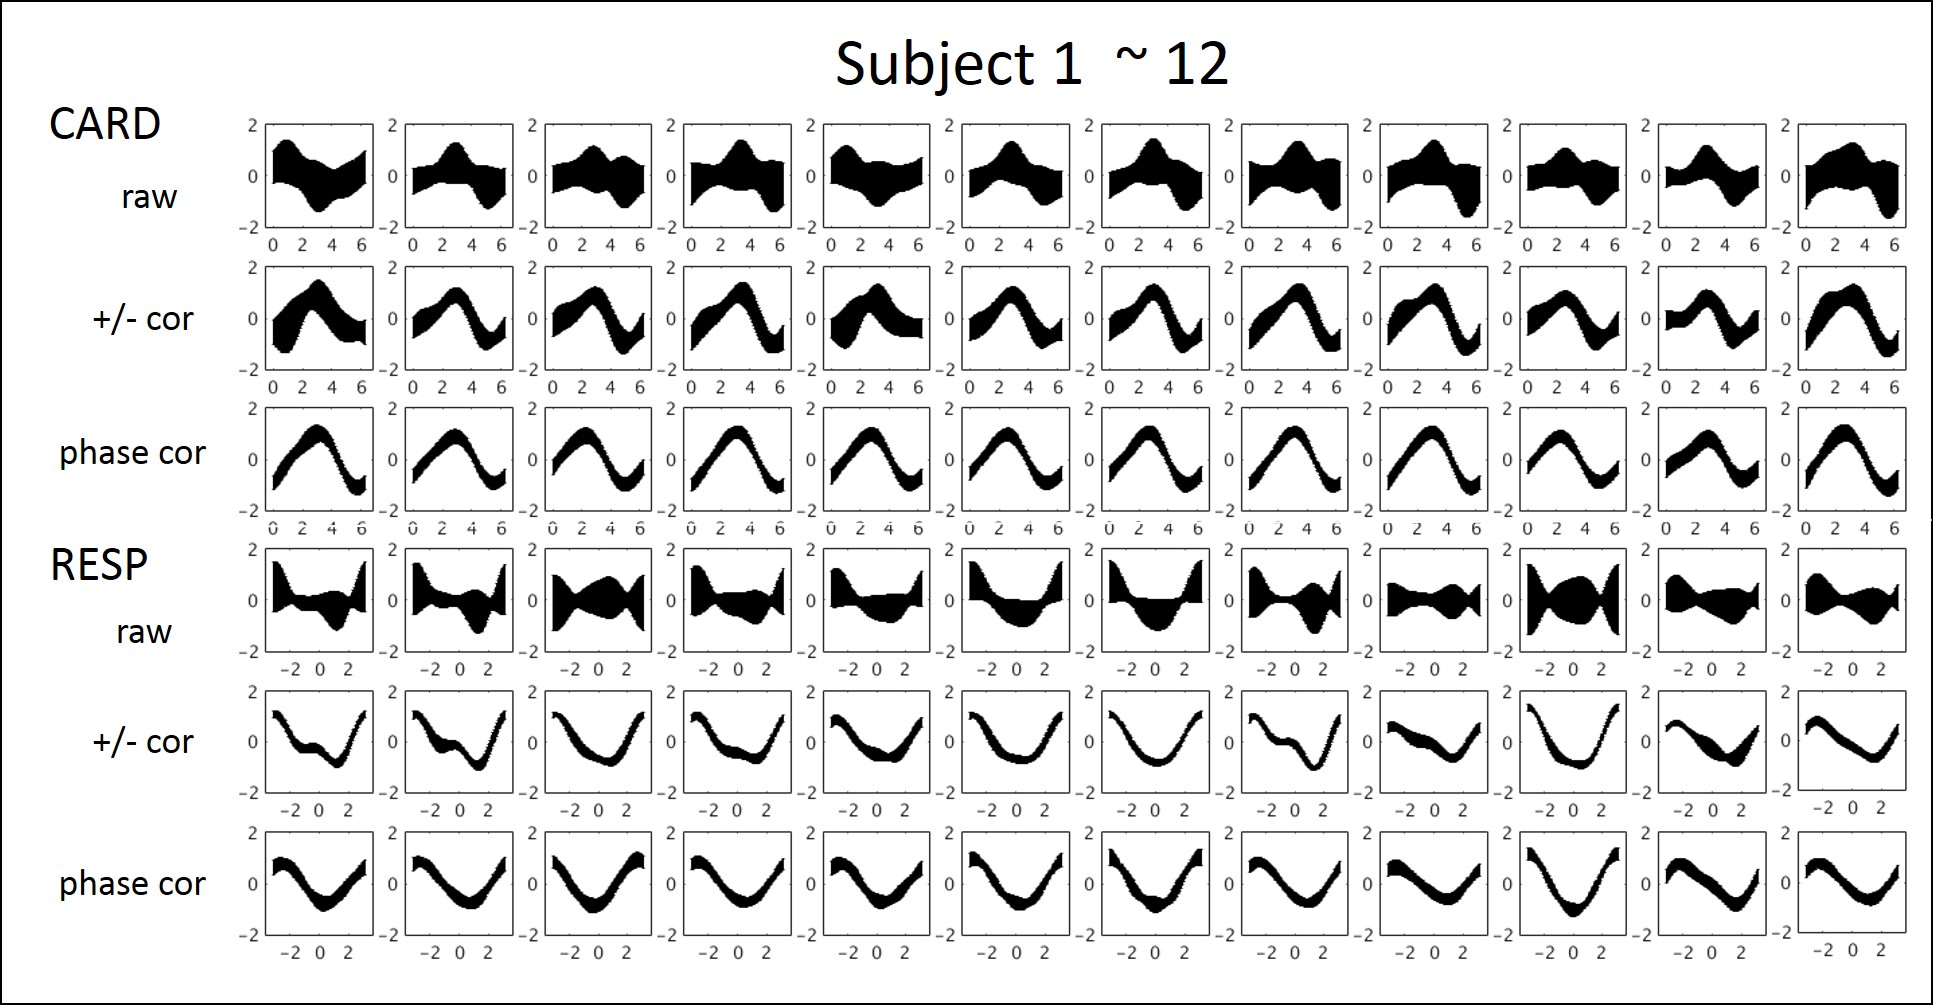
Figure 4 shows the response function without a correction, with polarity correction and with phase correction. As expected, respiratory function shows no significant difference between the polarity and phase corrections. However, the error of cardiac response functions was dramatically reduced when the phase correction was applied.
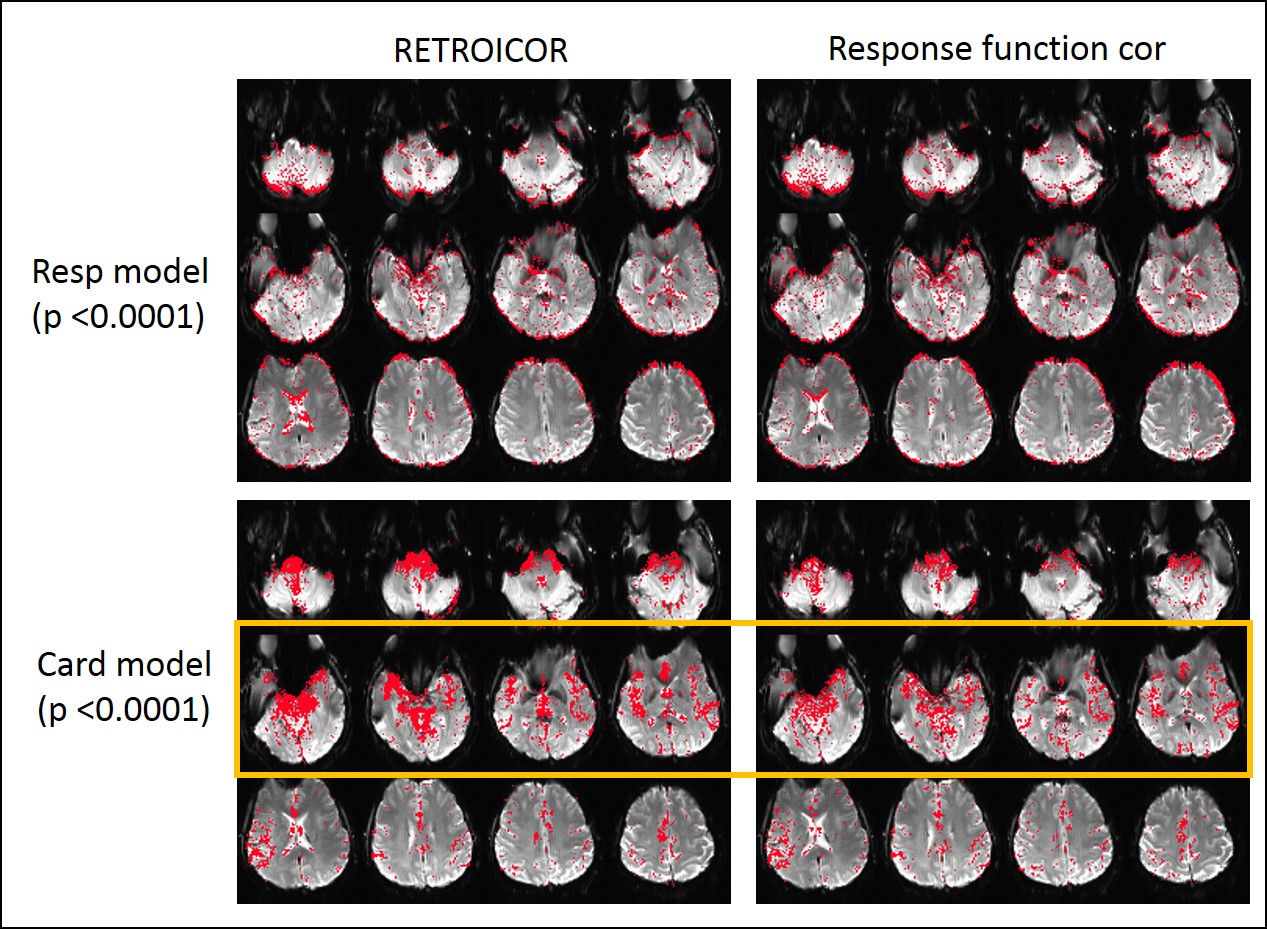
Fig 5 shows the consistent finding. Since the respiratory response function only has a polarity, the linear regress of single response function shows the compatible result with 4 regressor of respiratory Fourier series model. However, since the cardiac response function is phase–shifted, the single response function model regression is limited to find the phase shifted cardiac response function, which is fully considered in a RETROICOR model. This finding shows the good agreement with a recent study which presents the cardiac cycle induced phase or time shifted fluctuation in EPI scan [2].
Conclusion
We found the cardiac response function is phase shifted. This result indicates that the physiological noise correction with single response function assumption is valid for the respiratory noise but limited for the cardiac noise [3], and supports the cardiac noise signal removal requires more than single DOF [4]. This finding also explains the limited physiological noise removal using ICA, which assumes the constant phase of physiological noise across slices [5].Acknowledgements
This work was supported by Cleveland Clinic. Authors gratefully acknowledge technical support by Siemens Medical Solutions.References
1. Glover GH, Li TQ, Ress D. Image-based method for retrospective correction of physiological motion effects in fMRI: RETROICOR. Magn Reson Med. 2000;44(1):162-7. Epub 2000/07/14. doi: 10.1002/1522-2594(200007)44:1<162::AID-MRM23>3.0.CO;2-E [pii]. PubMed PMID: 10893535.
2. Viessmann O, Moller HE, and Jezzard P. Cardiac cycle-induced EPI time series fluctuations in the brain: Their temporal shifts, inflow effects and T2∗fluctuations, Neuroimage, 2017 Vol 162; 93-105
3. Beall EB, Lowe MJ. Isolating physiologic noise sources with independently determined spatial measures. Neuroimage. 2007;37(4):1286-300. Epub 2007/08/11. doi: S1053-8119(07)00585-X [pii]
4. Beall EB. Adaptive cyclic physiologic noise modeling and correction in functional MRI. Journal of neuroscience methods. 2010;187(2):216-28. PubMed PMID: 20096307.
5. Beall EB and Lowe MJ. The non-separability of physiologic noise in functional connectivity MRI with spatial ICA at 3 T. Journal of Neuroscience Methods. 2010;191:263-76
Figures