5455
Regional-specific echo-time optimization in spin-echo EPI at 3 Tesla1Rotman Research Institute, Toronto, ON, Canada, 2Medical Biophysics, University of Toronto, Toronto, ON, Canada
Synopsis
Spin-echo (SE) echo-planar imaging (EPI) is less prone to signal dropouts in brain regions of high susceptibility. Such regions are important for the study of memory and language, and have been traditionally difficult to image using the conventional gradient-echo BOLD fMRI. To maximize the contrast-to-noise of SE EPI, echo-time (TE) optimization is critical, and currently, the optimal TE is assumed to be equal to tissue T2. In this work, we use a comprehensive BOLD signal and noise model to characterize the TE dependence of SE-EPI at 3 T. We show that the optimal TE is significantly shorter than the commonly assumed tissue T2.
Introduction
Spin echo (SE) echo-planar imaging (EPI) is a method of measuring brain activity in blood oxygen level dependent (BOLD) functional MRI (fMRI). Compared to other methods, SE-EPI is less prone to signal dropouts in regions of high susceptibility (HSR), such as those near air-tissue interfaces [1]. Additionally, it is more specific to BOLD effects in smaller vessels, which are more abundantly found in white matter [2]. In this project, we aim to maximize sensitivity in SE-EPI by identifying the echo time (TE) at which maximum contrast-to-noise ratio (CNR) is observed. Currently, the optimal TE is assumed to be equal to tissue T2, but has never been experimentally verified, especially in light of the current understanding of BOLD-like behaviour in physiological noise and its impact on BOLD CNR [3]. This work may improve research in white matter and in susceptibility-affected regions, both of which are involved in important brain functions, such as memory and language.Methods
Task Design: Hypercapnia was induced in 7 healthy young adults (mean age = 24.2 years) by increasing end tidal CO2 pressure (PETCO2) 5 mmHg from the baseline [4]. Image acquisition: MR imaging was performed on a Siemens 3T system. Whole-brain SE-EPI data was collected over a range of TEs (35, 45, 55, 65, and 75 ms), with TR = 2 s, 192 time points, voxel size = 3.4 x 3.4 x 5.8 mm3. Furthermore, to quantify intravascular (venous) signal and relaxation rates, we imaged 5 of the subjects using a modified SE-EPI sequence, in which the refocusing pulse was rendered non-selective spatially, and a single slice was imaged perpendicular to the superior sagittal sinus. The same TEs and hypercapnic challenge were used for these single-slice SE-EPI scans.
Data analysis: Tissue segmentation was performed using Freesurfer, extracting individual cortical and subcortical regions as well as whole-brain GM and WM regions of interest (ROIS.
CNR is defined as [5]:
$$CNR=ΔS/S∙tSNR$$
where tSNR is the temporal signal to noise ratio [5], defined by
$$tSNR=SNR_0/\sqrt{1+\lambda^2\cdot SNR_0^2}$$
where $$$SNR_0=S/\sigma_0$$$, \sigma_0 being the noise standard deviation. SNR_0 is the image SNR, measured from the data along with CNR and tSNR. By fitting SNR0 to tSNR, we can estimate $$$\lambda$$$, which provides a measure of the physiological-noise amplitude.
The task-related BOLD effect, ΔS/S [6], where
$$S=V\cdot exp(-TE\cdot R_{2,b}+\kappa\cdot exp(-TE\cdot R_{2,t})$$
and
$$\Delta S=[(V+\Delta V)\cdot exp(-TE\cdot \Delta R_{2,b})-V]\cdot exp(-TE\cdot R_{2,b}) + \kappa\cdot [(1-V-\Delta V)\cdot exp(-TE\cdot \Delta R_{2,t})-(1-V)]\cdot exp(-TE\cdot R_{2,t})$$
where V is the baseline cerebral blood volume (CBV), $$$\Delta V$$$ is the task-related CBV change (in this case ~ 1.5% [7], $$$R_2$$$ is the transverse relaxation rate (b = blood, t = tissue), $$$\Delta R_2$$$ is the task-related $$$R_2$$$ change and $$$\kappa$$$ is the blood-tissue water fraction ratio. By fitting for ΔS/S across all TEs, we obtain $$$\Delta R_{2,t}$$$ and $$$\Delta R_{2,b}$$$.
We fit the measured CNR to the theoretical CNR model using nonlinear least-squares fitting. The resulting curve was used to identify the optimal TE, i.e. the time which maximum CNR was observed, for grey (GM) and white matter (WM).
Results
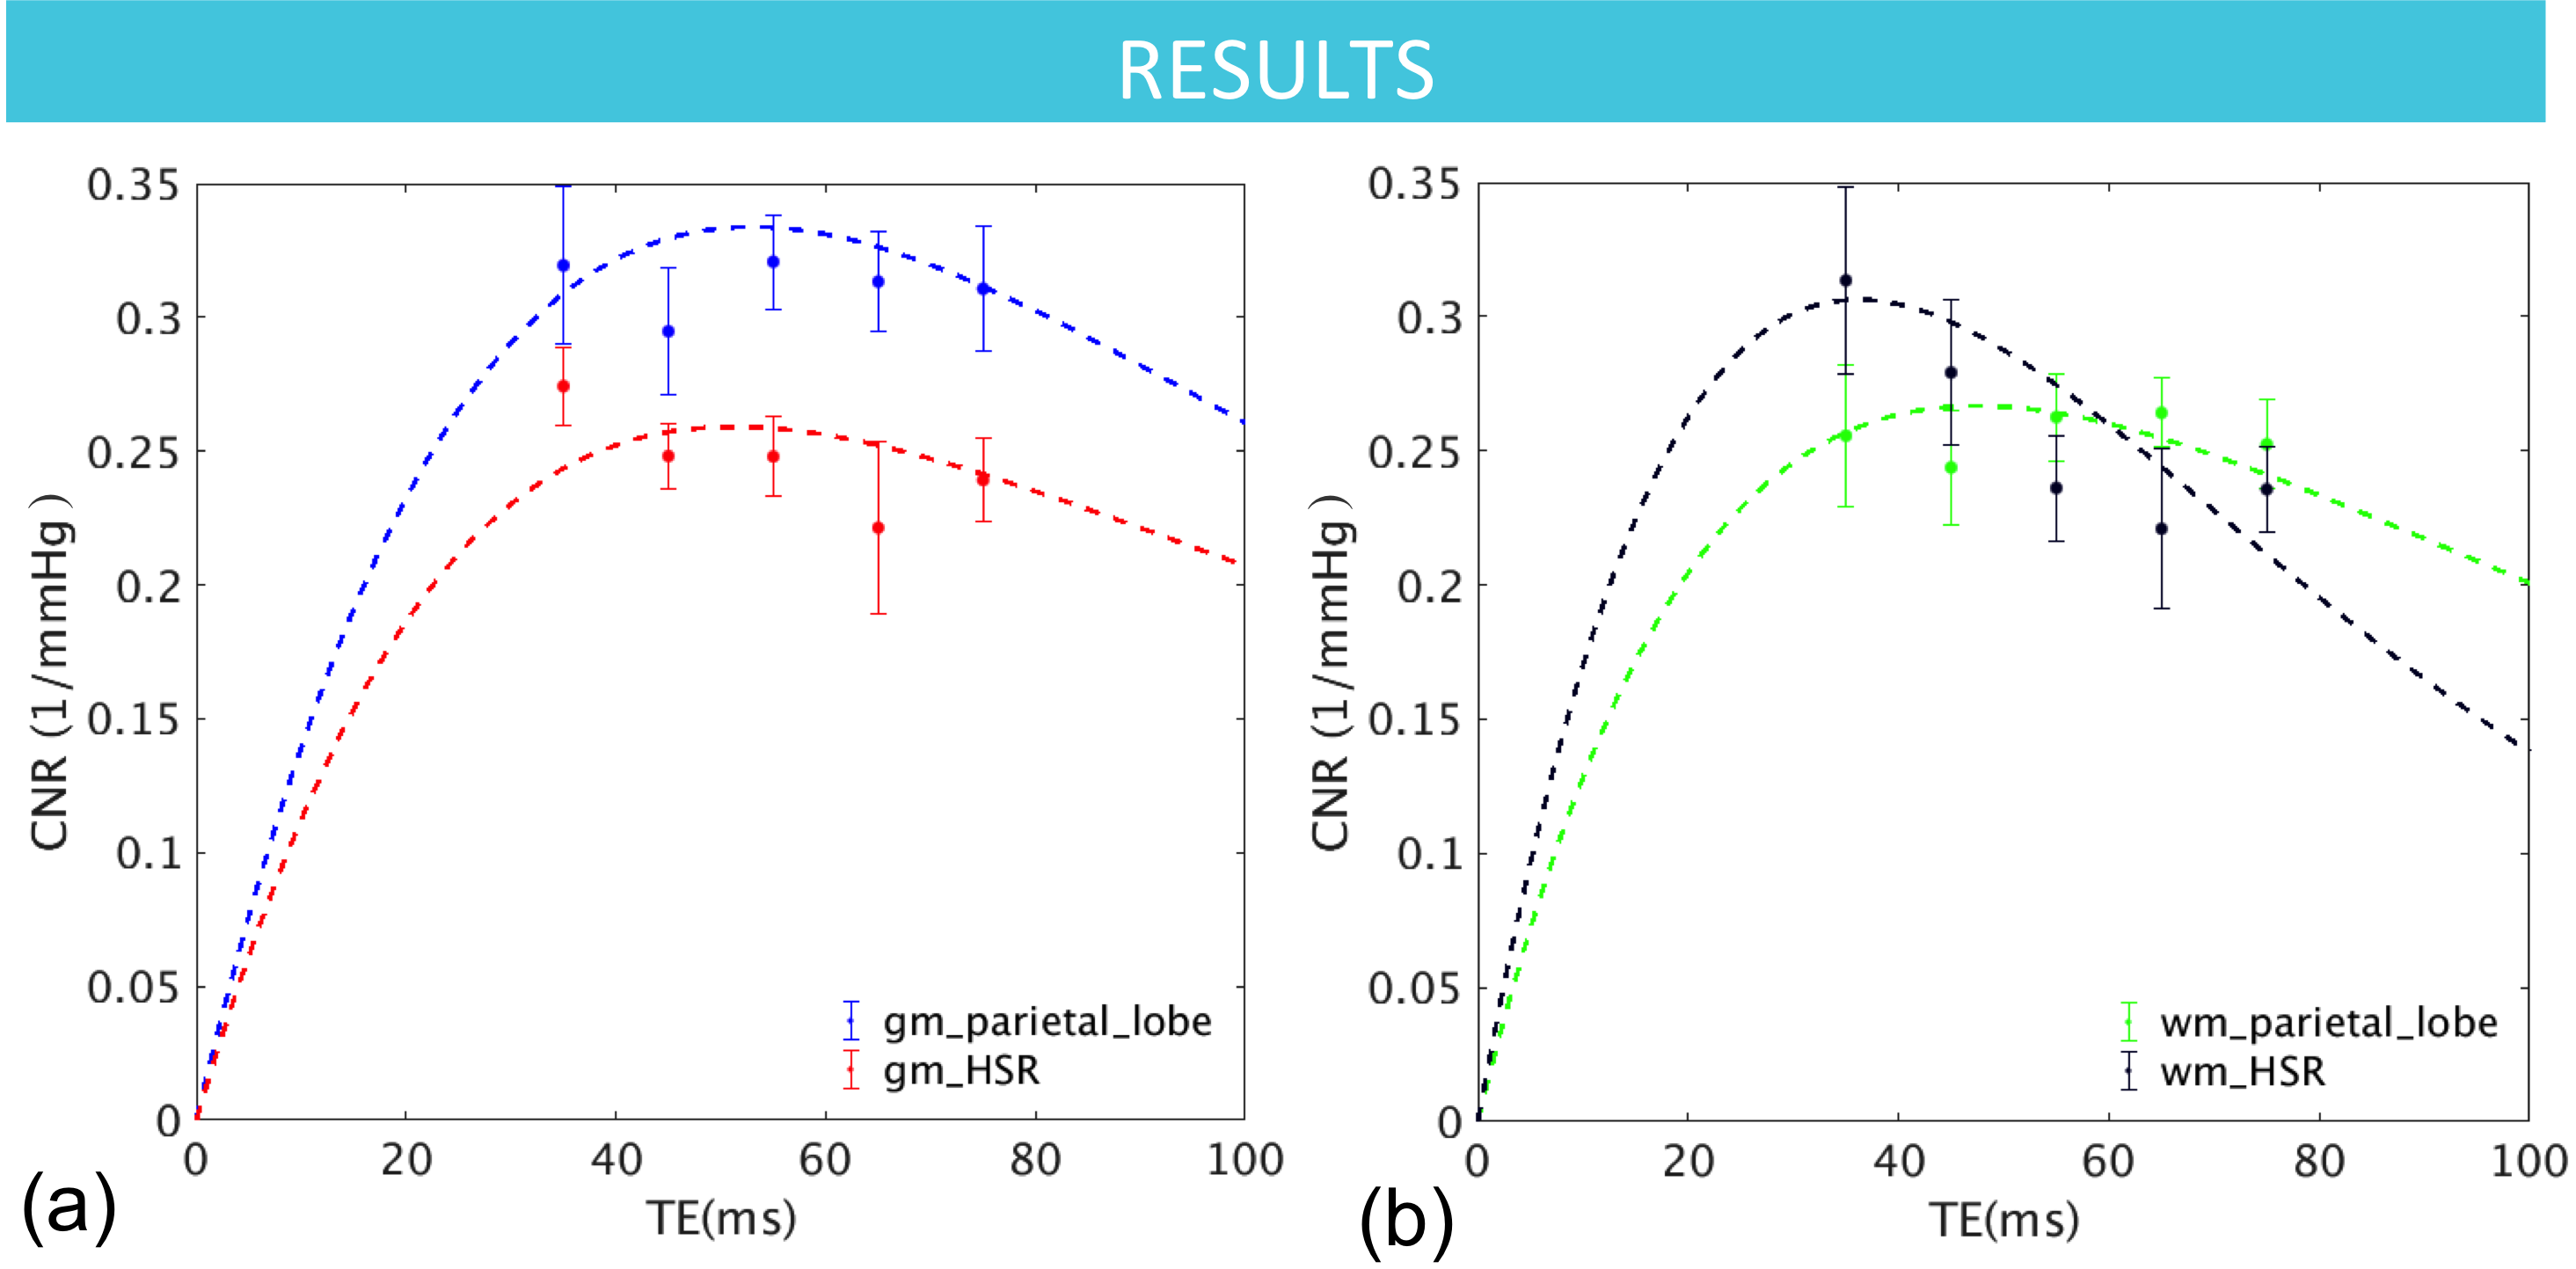
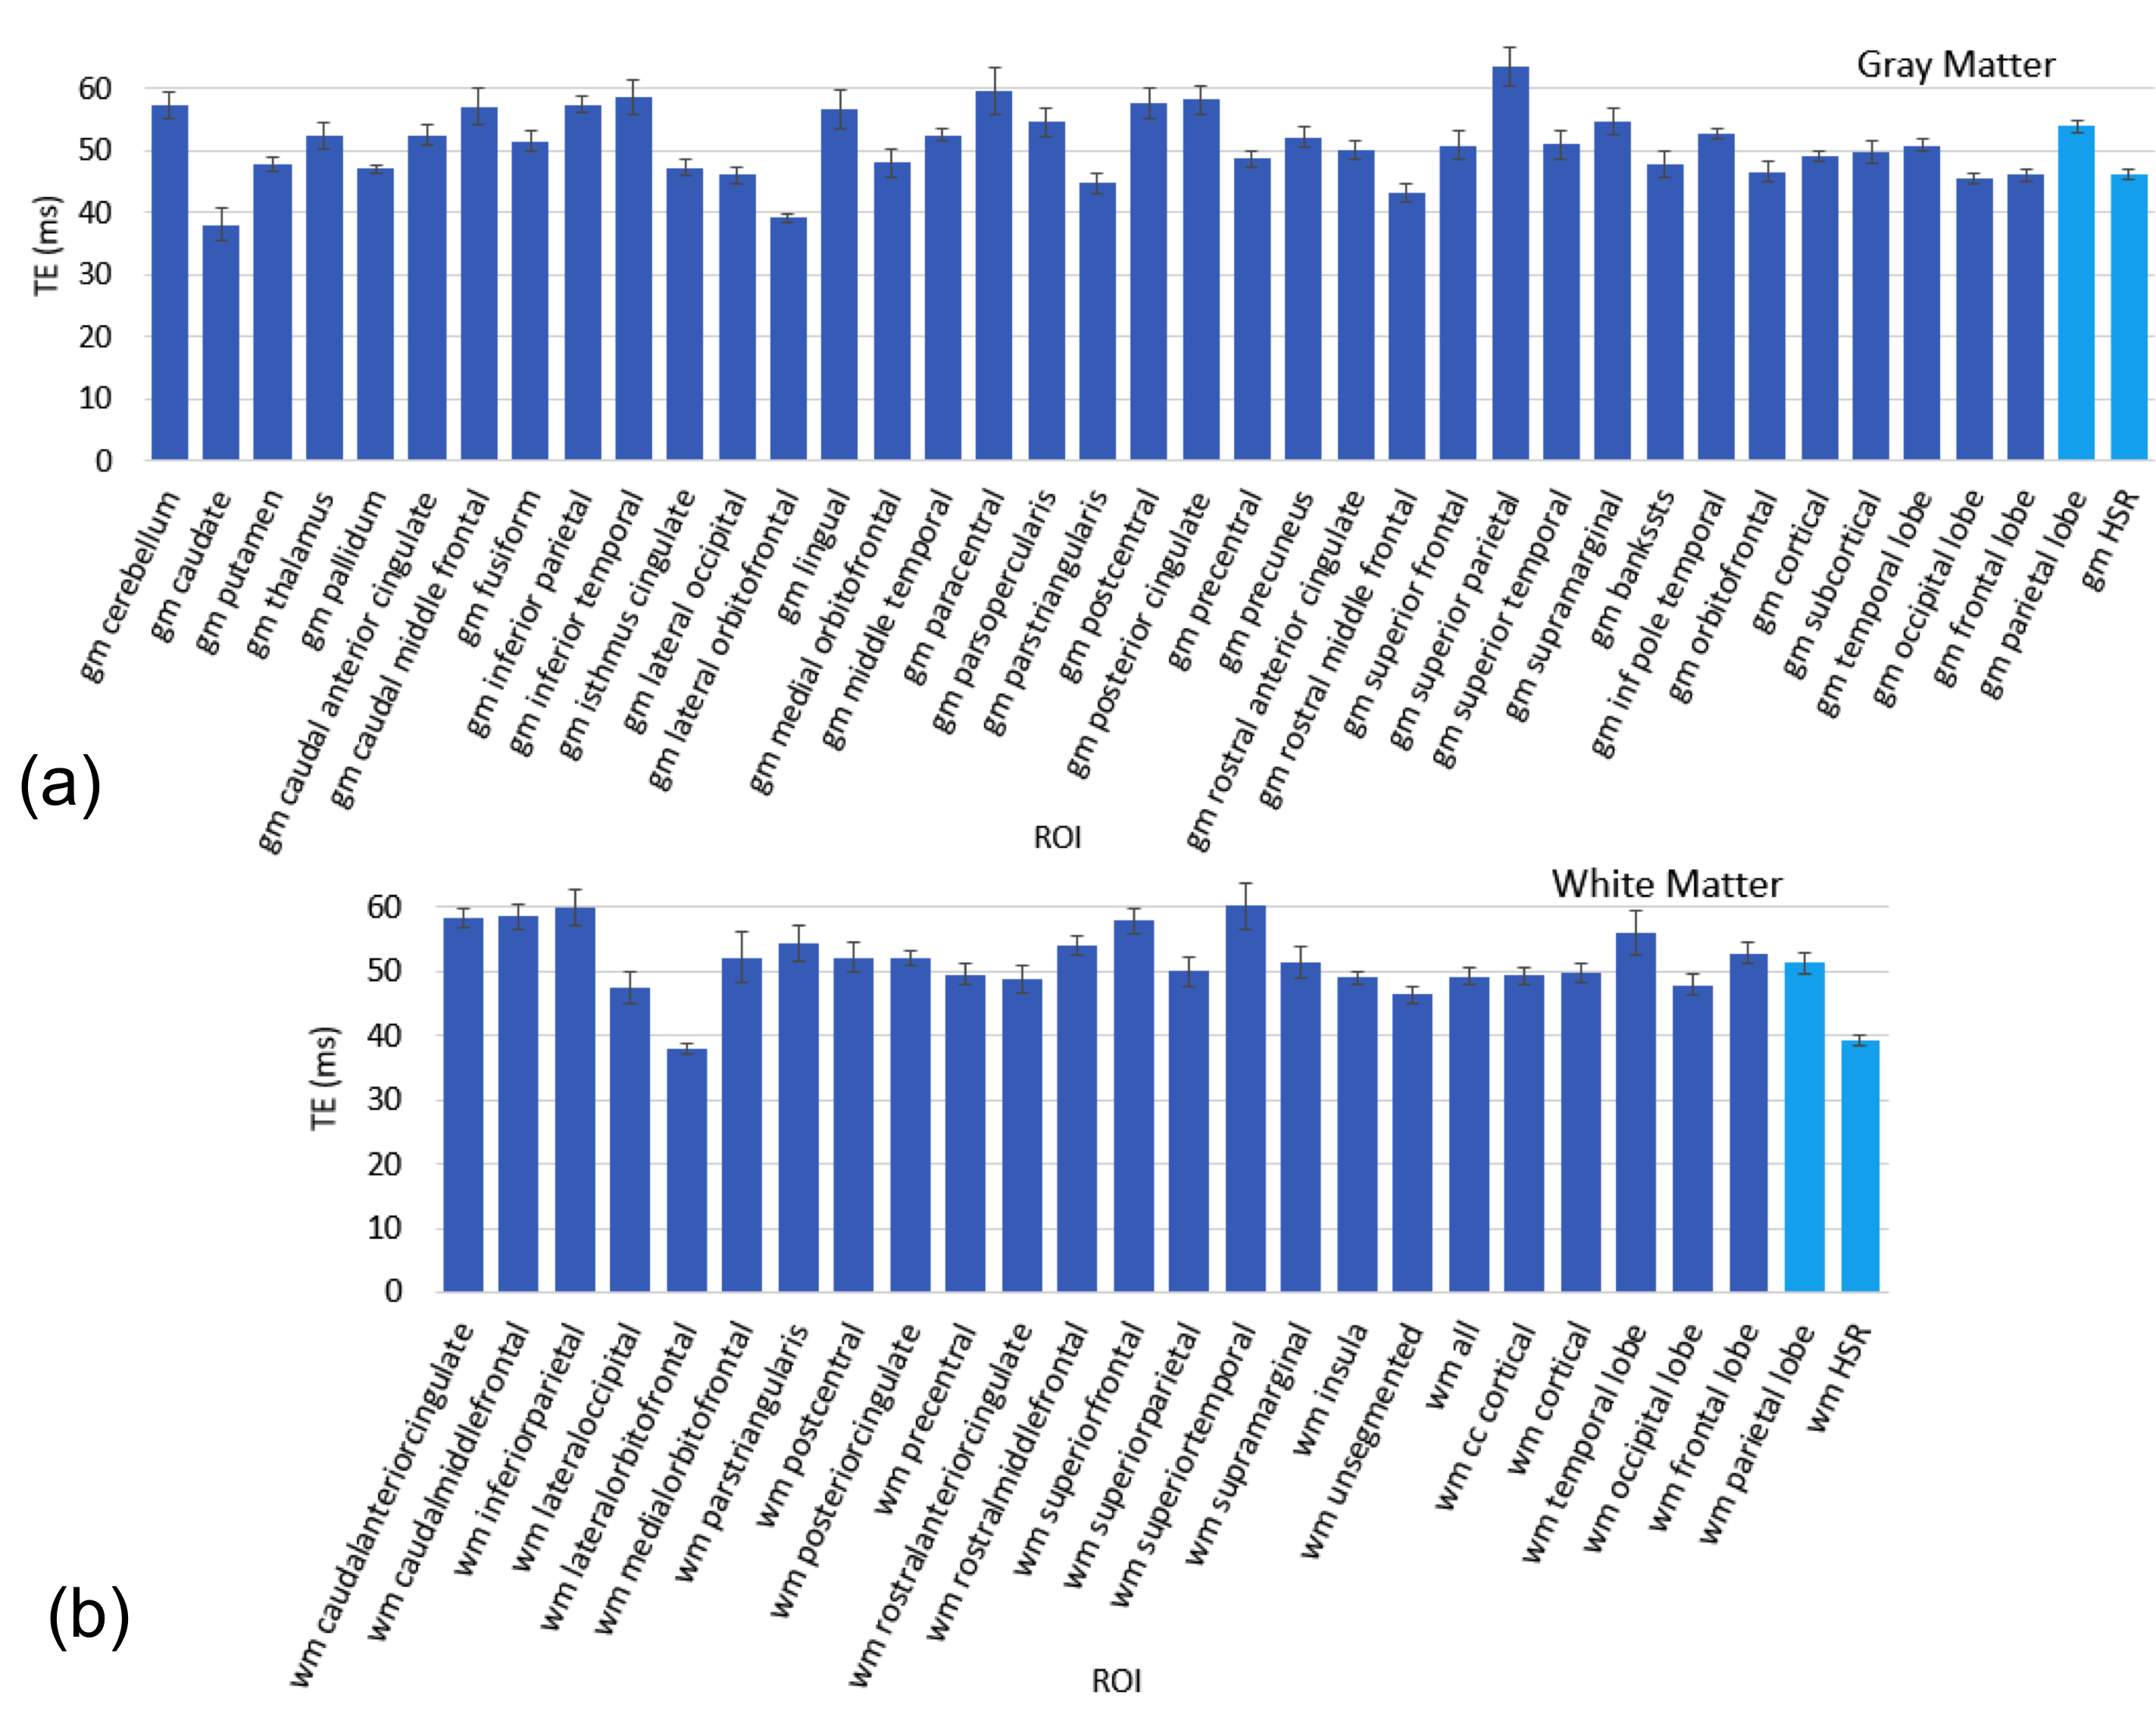
The CNR model fits for GM and WM ROIs for a representative subject are shown in Figure 1. Averaging across the group of subjects, the maximum CNR occurred between 45-55 ms for majority of the ROIs, producing an average optimal TE of 50.9 ± 1.8 ms in GM and 51.3 ± 2.0 ms in WM. These are much shorter than tissue T2 (the presumed optimal TE) likely due to the role of physiological noise (i.e. ~ 75 ms for GM at 3 T). Moreover, as shown in Figure 2, while most GM and WM areas exhibit comparable optimal TEs, the optimal TE was shortest in high susceptibility regions (HSR) compared to regions of low susceptibility (e.g. parietal lobe) for both GM and WM. Additionally, HSR required shorter optimal TE in WM than in GM.Discussion
In this work, we use a comprehensive BOLD signal and noise model to characterize the TE dependence of the SE EPI BOLD signal. For the first time, we show that the TE to optimize CNR in spin-echo EPI is significantly shorter than the commonly assumed tissue-T2 values. This is likely due to the presence of TE-dependent physiological noise. Overall, other GM and WM regions did not have significantly different optimal TEs. Results suggest BOLD signals are weak in HSR, especially for WM, and require a shorter TE for maximizing BOLD sensitivity. Short optimal TE was also observed for deep-brain structures, which are known sites of ferritin deposition.Acknowledgements
This research was supported by the Canadian Institutes for Health Research.References
[1] Khatamian, Y. B. et al. Spin-Echo Resting-State Functional Connectivity in High-Susceptibility Regions: Accuracy, Reliability, and the Impact of Physiological Noise. Brain Connectivity, 2016; 6, 283–297.
[2] McWhinney, S. R. et al. Comparing gray and white matter fMRI activation using asymmetric spin echo spiral. J Neurosci Meth, 2012; 209(2012), 351-356.
[3] Kruger G. et al. Neuroimaging at 1.5 T and 3.0 T: Comparison of oxygenation-sensitive magnetic resonance imaging. Magn Reson Med 2001; 45: 595-604.
[4] Triantafyllou, C. et al. Echo-Time and Field Strength Dependence of BOLD Reactivity in Veins and Parenchyma Using Flow-Normalized Hypercapnic Manipulation. PLoS ONE 2011; 6, e24519.
[5] Kruger, G. and Glover, G. H. Physiological noise in oxygenation-sensitive magnetic resonance imaging. Magn Reson Med 2001; 46: 631-637.
[6] Jin, T. et al., Source of nonlinearity in echo-time-dependent BOLD fMRI. Magn Reson Med 2006; 1281-1290.
[7] Chen, J. J. and Pike, G. B.. MRI measurement of the BOLD-specific flow-volume relationship during hypercapnia and hypocapnia. NeuroImage 2010; 383-391.
Figures