5449
Optimising the detection of subcortical auditory function using fMRI1Sir Peter Mansfield Imaging Centre, School of Physics and Astronomy, University of Nottingham, Nottingham, United Kingdom, 2National Institute for Health Research (NIHR) Nottingham Biomedical Research Centre, Nottingham, United Kingdom, 3Otology and Hearing Group, Division of Clinical Neuroscience, School of Medicine, University of Nottingham, Nottingham, United Kingdom, 4Manchester Centre for Audiology and Deafness (ManCAD), University of Manchester, Manchester, United Kingdom, 5Department of Psychology, Lancaster University, Lancaster, United Kingdom
Synopsis
We explore the effects of EPI distortion correction and retrospective correction of cardiac and respiratory artefacts on fMRI data quality. Further, we assess the suitability of this data to provide robust detection of subcortical sound-evoked responses for inter-group and subgroup analyses. We report an optimum acquisition, pre-processing and analysis protocol for subcortical fMRI of the ascending auditory pathway.
Introduction
A current focus of auditory neuroscience concerns the physiological mechanisms behind “hidden” hearing loss [1]; hearing impairments that cannot be detected using conventional diagnostic techniques such as pure tone audiometry. Permanent noise-induced damage, apparent as a change in the ascending auditory pathway, has been demonstrated following noise exposure in mammalian species [2]. Crucially, this damage affects sensitivity to supra-threshold sounds, needed for interpreting speech in noisy environments [3], but not sensitivity to quiet sounds. Subcortical fMRI of the ascending auditory pathway requires high spatial resolution, and is sensitive to EPI distortions and physiological (cardiac and respiratory) noise. Here, we report optimised acquisition and analysis methods for subcortical fMRI at 3.0 T for future assessment of the link between lifetime noise exposure and sound-evoked responses. A secondary question concerns the group size necessary to robustly detect subcortical activation.Methods
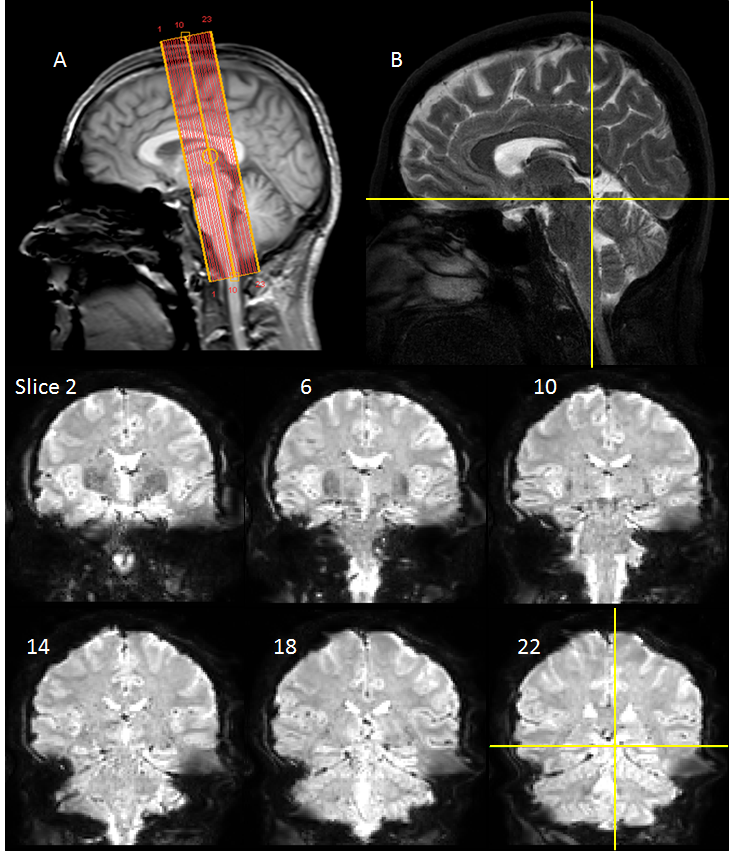
25 subjects with low to moderate noise exposure had no history of audiological problems and gave informed written consent. Functional and structural data were acquired on a Philips Ingenia 3.0 T MR scanner with a 32-channel head coil. fMRI data was collected using a gradient echo (GE) EPI scheme (TE=35ms, FOV=34.5×34.5mm, 1.5mm isotropic resolution, SENSE=2.5, 23 slices with equidistant temporal slice spacing, TR=2 s). Slices were near-coronal to provide coverage of the brainstem and Heschl’s gyrus (Figure 1). Each fMRI run comprised 8 cycles of 24-s of broadband noise (1.4-4.1 kHz; 85 dB-SPL) and 42-s rest presented using the OptoACTIVE Optical MRI Communication System (Optoacoustics Ltd., Israel) during active noise cancellation. Four fMRI runs were collected on each individual. In addition, 2 EPI dynamics were collected echo shifted (37ms) and with reversed phase-encoding gradient. Structural data were collected using a FLASH and high resolution 3D T2-weighted TSE (turbo-spin-echo). Image pre-processing and analysis was performed using FSL, SPM12 and in-house Matlab scripts. fMRI data were motion corrected. To optimise the analysis pipeline, distortion correction using FSL’s TOPUP algorithm [4,5] and physiological noise correction using RETROICOR [6] were performed, with the impact of these pre-processing stages assessed. All data were then spatially smoothed (2mm Gaussian kernel). Binarised masks of white matter (WM) and CSF were used to generate mean timecourses for use as regressors in the general linear model (GLM). Statistical analyses were performed in SPM12 using a GLM of onset, duration and offset of auditory stimulation as regressors of interest, with motion parameters, WM and CSF as nuisance regressors. The FLASH image was co-registered to a standard template [7], the resulting transformation matrix applied to individual statistical parameter maps (SPMs), and random-effects group analysis performed. To assess the resulting SPMs, ROI analyses were performed using spherical 6-mm subcortical ROIs centred on co-ordinates defined by Gutschalk et al. [8]. We evaluate the impact of optimised pre-processing (distortion and physiological noise correction) on beta estimates of the fMRI response. To further evaluate this impact, a subgroup analysis was performed, reducing the number of participants in the group [n=20, 15, 10], comparing different levels of pre-processing, to determine the group size necessary to robustly detect subcortical activation.Results
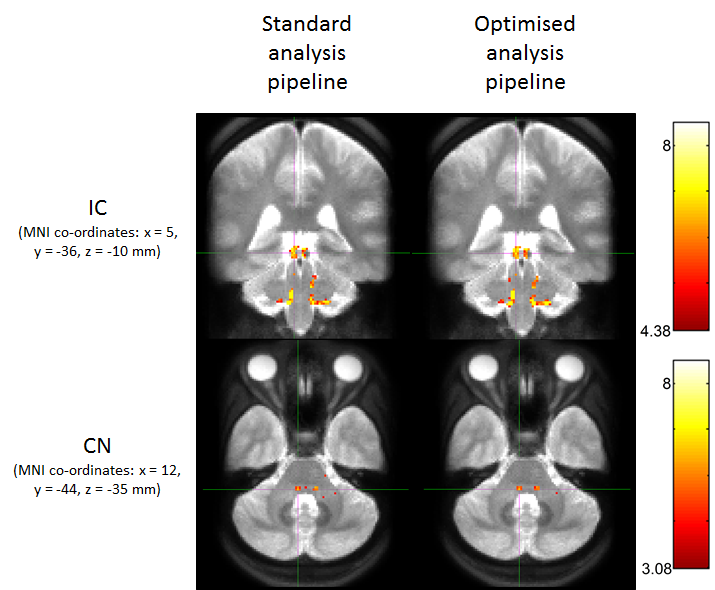
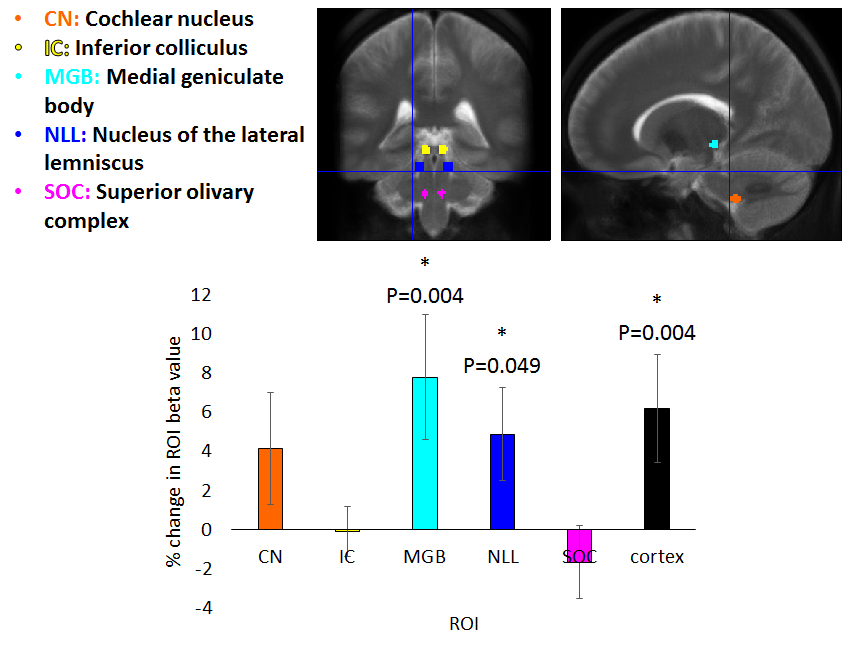
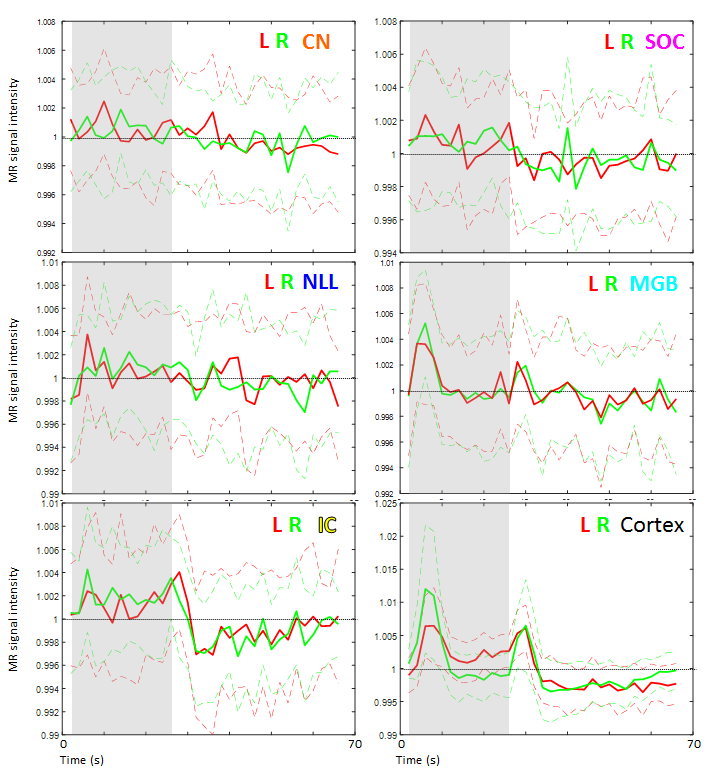
Figure 2 shows group activation maps of the ascending auditory pathway, highlighting strong inferior colliculus (IC) and cochlear nucleus (CN) activity for both standard and optimised pre-processing pipelines. Figure 3 shows subcortical ROI locations and group mean percentage difference (± standard error) in beta values resulting from optimised, compared to standard, pre-processing within these ROIs and the auditory cortex, highlighting a significant improvement in beta values using the optimised analysis method for the medial geniculate body (MGB) and nucleus of the lateral lemniscus (NLL). Subcortical regions namely the CN, superior olivary complex (SOC); NLL and IC respond continually to a sustained auditory stimulus, whereas the MGB and auditory cortex respond more to the onset and offset of the stimulus, as shown in the mean timecourses (Figure 4). Subgroup analyses showed that sound-evoked responses could be detected bilaterally in the CN and SOC (and other ROIs) in a group size of n=20 provided EPI distortion correction was used (independent of performing physiological noise correction), whilst a group size (n>=25) was required to detect bilateral CN or SOC responses without EPI distortion correction.Discussion
This study has demonstrated robust subcortical sound-evoked fMRI responses at 3.0 T, which are improved using EPI distortion and physiological noise correction.Conclusion
This optimised fMRI protocol allows the robust study of the human auditory system. In this ongoing study, behavioural and neuroimaging techniques will be combined to assess changes in the auditory pathway associated with hidden hearing loss in individuals with varying cumulative lifetime noise exposures (subgroups of n=30).Acknowledgements
This work is supported by Medical Research Council (MRC) reference MR/L003589/1 awarded to the University of Manchester.References
1. Plack CJ, Barker D, Prendergast G, Perceptual consequences of "hidden" hearing loss. Trends Hear. 2014;18:1-11.
2. Kujawa SG and Liberman MC. Adding Insult to Injury: Cochlear Nerve Degeneration after “Temporary” Noise-Induced Hearing Loss. J Neurosci. 2009;29(45):14077–14085.
3. Liberman MC, Epstein MJ, Cleveland SS, Wang H, Maison SF. “Toward a Differential Diagnosis of Hidden Hearing Loss in Humans”. PLoS ONE. 2016;11(9): e0162726.
4. Smith SM., et al., Advances in functional and structural MR image analysis and implementation as FSL. NeuroImage. 2004;23:S208-S219.
5. Andersson JL., Skare S, and Ashburner J, How to correct susceptibility distortions in spin-echo echo-planar images: application to diffusion tensor imaging. Neuroimage. 2003;20(2):870-88.
6. Glover GH, Li TQ, Ress D. Image-based method for retrospective correction of physiological motion effects in fMRI: RETROICOR. Mag Reson Med. 2000; 44:162–167.
7. Montreal Neurological Institute (MNI) Template. Montreal Neurological Institute, Montreal, Canada.
8. Gutschalk A and Steinmann I, Stimulus Dependence of Contralateral Dominance in Human Auditory Cortex. Hum. Brain Mapp. 2015;36:883–896.
Figures