5446
Dual reconstructions of SLIDER-XD for high spatial and temporal resolution resting state fMRI at 7TAn Thanh Vu1,2, Alexander Beckett3,4, David Feinberg3,4, and Pratik Mukherjee1,2
1Radiology, San Francisco VA Health Care System, San Francisco, CA, United States, 2Center for Imaging of Neurodegenerative Diseases, University of California at San Francisco, San Francisco, CA, United States, 3Helen Wills Neuroscience Institute, University of California at Berkeley, Berkeley, CA, United States, 4Advanced MRI Technologies, Sebastopol, CA, United States
Synopsis
Here we assert that the individual dithers of a SLIDER-XD dataset can be utilized in a dual fashion to reconstruct not only a high spatial resolution dataset but also a high temporal resolution dataset (termed SLIDER-XDT) suitable for fMRI experiments requiring faster TRs. While analogous to spatial smoothing where spatial resolution is traded for statistical power in post-processing, SLIDER-XDT not only provides additional statistical power but also additional temporal resolution which can be used to support detection of additional resting state networks or to temporally un-alias signals of interest.
Purpose
SLIce Dithered Enhanced Resolution without Debluring (SLIDER-XD) together with Simultaneous Multi-Slice (SMS) technology has been shown to greatly improve the SNR efficiency of high-resolution fMRI, enabling 0.65 mm and 0.45 mm nominally isotropic acquisitions at 3T and 7T, respectively (1,2). However, whole brain, high isotropic resolution fMRI remains challenging due to long image acquisition times. For example, even when utilizing both in-plane and slice acceleration (IPAT-3 MB-3), a 0.8 mm whole brain fMRI dataset requires a TR of ~4-5 s which is prohibitive for most fMRI experiments – particularly resting state. Here we assert that the individual dithers of a SLIDER-XD dataset can be utilized in a dual fashion to reconstruct not only a high spatial resolution dataset but also a high temporal resolution dataset (termed SLIDER-XDT) suitable for fMRI experiments requiring faster TRs.Methods
Data were acquired in two healthy volunteers on a Siemens 7T MAGNETOM scanner and a 32 ch head array. During the 2D gradient echo EPI fMRI scans, subjects were scanned for one 5 min resting state scan per scan protocol: “Traditional” MB-3 and SLIDER-XD MB-3. Imaging parameters were: 0.8 mm iso (nominal; 1.6 mm excitation thickness for SLIDER-XD); FOV = 192x192x120 mm; PF = 6/8; IPAT = 3, TE = 27 ms; TR = 4000 ms (2000 ms per dithered volume); Flip angle = 84o (70o for SLIDER-XD); PE direction= AP; axial oblique slices. To reconstruct the SLIDER-XDT dataset with double the temporal resolution (TR = 2000 ms), individual dithers of the SLIDER-XD dataset (red vs blue slices in Fig 1) were utilized as independent time points. The spatial offset between dithers was corrected via motion correction to the temporal mean in the MELODIC resting state analysis pipeline of FSL.Results
Fig 1 depicts SLIDER-XD slice order strategies for a 16 slice, MB-2 (n = 8 shots) acquisition. Although the two dithers are temporally distinct, spin history effects are problematic for slices at the interface of the two bands in the traditional ascending order acquisition (e.g. the bottom half of the slice outlined in green will be immediately excited again in the first shot of the subsequent acquisition). To mitigate this, we implemented the centric slice order shown in Fig 1B. Fig 2 shows the tSNR maps in a representative axial slice for the traditional 0.8 mm, SLIDER-XD and SLIDER-XDT datasets (after decimating to a common TR of 4000 ms). Fig 4A quantifies the improvements in tSNR as the mean across the entire masked brain with SLIDER-XD and SLIDER-XDT showing 50% and 100% higher tSNR than the Traditional 0.8 mm acquisition. Fig 3A shows the z-statistics of an exemplary resting state network for the Traditional 0.8 mm dataset overlaid onto the corresponding mean EPI image. Fig 3B shows the stark improvements in the size and strength of the detected network with SLIDER-XD. Fig 3C shows how SLIDER-XDT trades spatial resolution for additional improvements in statistical power. Fig 4B shows how the number of Indepedent Components (ICs) supported by MELODIC increases dramatically by 40% for SLIDER-XDT, stressing the importance of temporal resolution in resting state analysis. Fig 5 shows how SLIDER-XDT can un-alias and enable interpretation of resting state network components (e.g. a physiological noise component at the respiratory frequency of ~0.22 Hz) which would otherwise be difficult to interpret with a 4000 ms TR and a Nyquist frequency limit of only 0.125 Hz.Conclusions
We find that dual reconstructions of a single SLIDER-XD dataset conveniently enables both high spatial and temporal resolution resting state fMRI at 7T. While analogous to spatial smoothing where spatial resolution is traded for statistical power in post-processing, SLIDER-XDT not only provides additional statistical power but also additional temporal resolution which can be used to support detection of additional resting state networks or to temporally un-alias signals of interest. Future development of advanced resolution fusion techniques, analogous to those used in diffusion MRI (3,4), will be critical for making the most of the spatial-temporal information inherently available in techniques like SLIDER-XD.Acknowledgements
NIH BRAIN Initiative grants: 1R24MH106096, 5R01MH111444, and 1U01EB025162-01.References
1. Vu et al, Neuroimage 2017
2. Feinberg et al, Neuroimage 2017
3. Sotiropoulos
et al, IEEE 2013
4. Sotiropoulos
et al, Neuroimage 2016
Figures
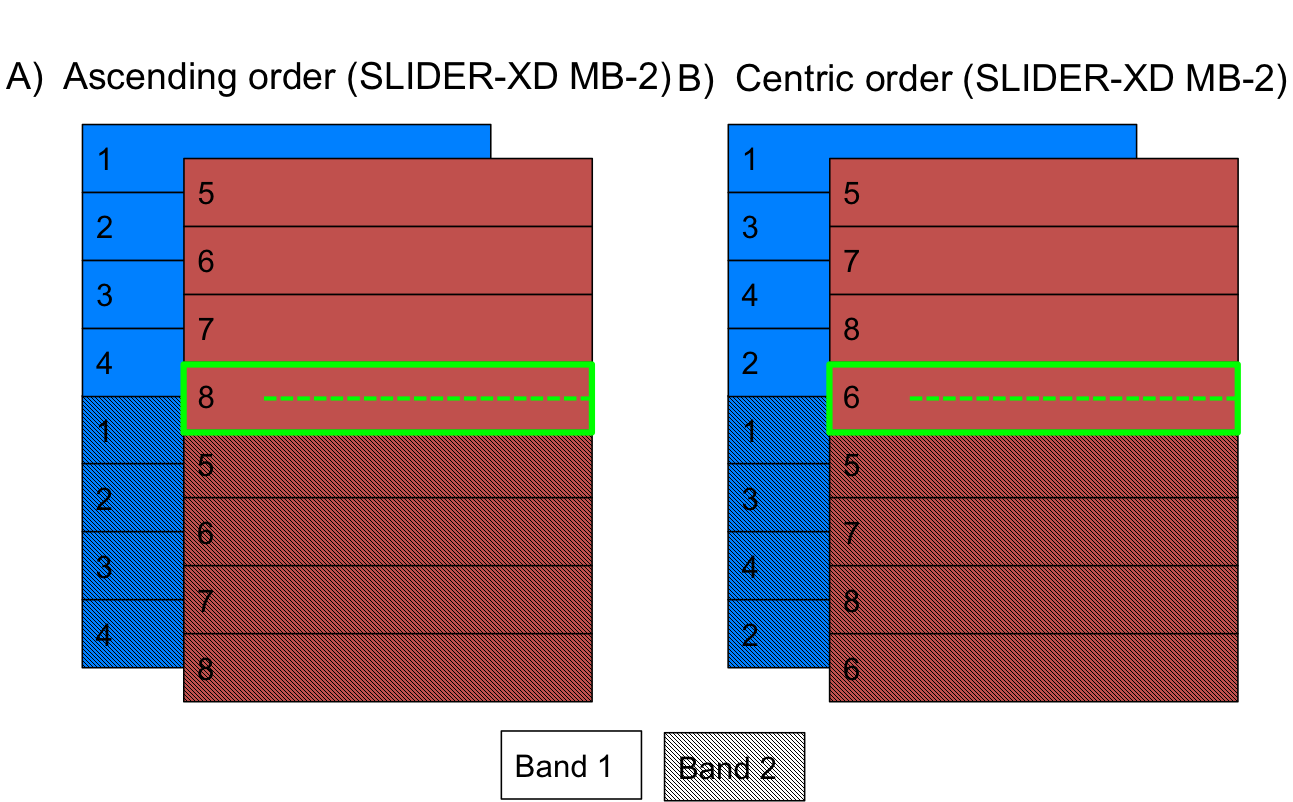
Figure 1. SLIDER-XD slice order strategies for an MB-2 example. A) Ascending order. B) Centric order.
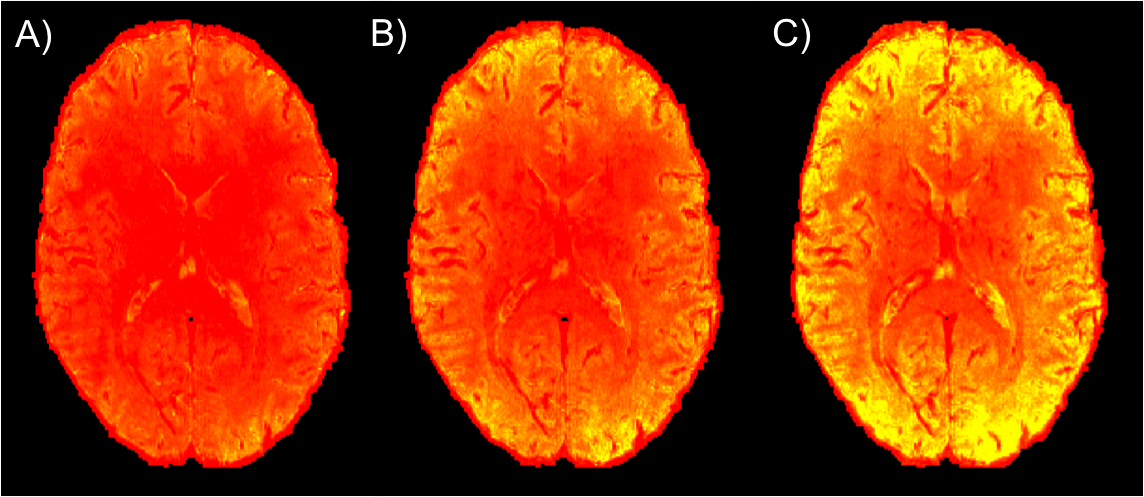
Figure 2. tSNR maps in a representative axial slice for the A) traditional 0.8
mm, B) SLIDER-XD and C) SLIDER-XDT datasets (after decimating to a common TR of 4000
ms).
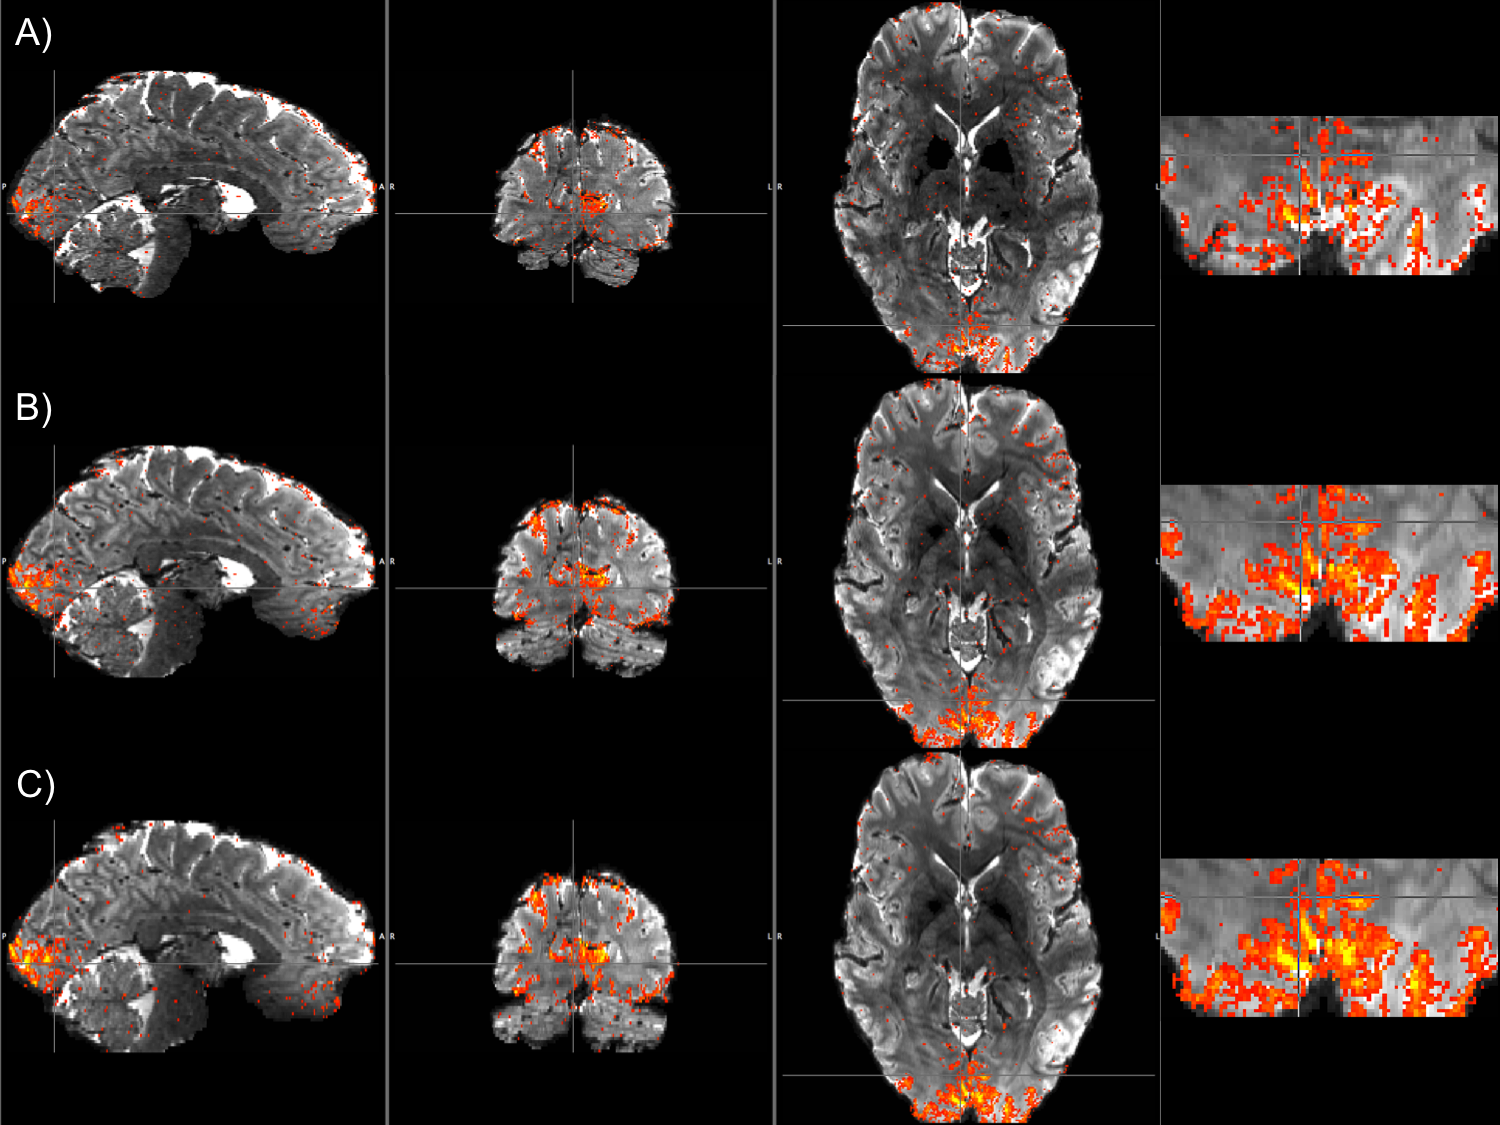
Figure 3. Thresholded z-statistics for an example IC overlaid onto the corresponding mean EPI image for A) traditional 0.8 mm, B) SLIDER-XD and C) SLIDER-XDT (color scale: red z = 0, yellow z = 15).
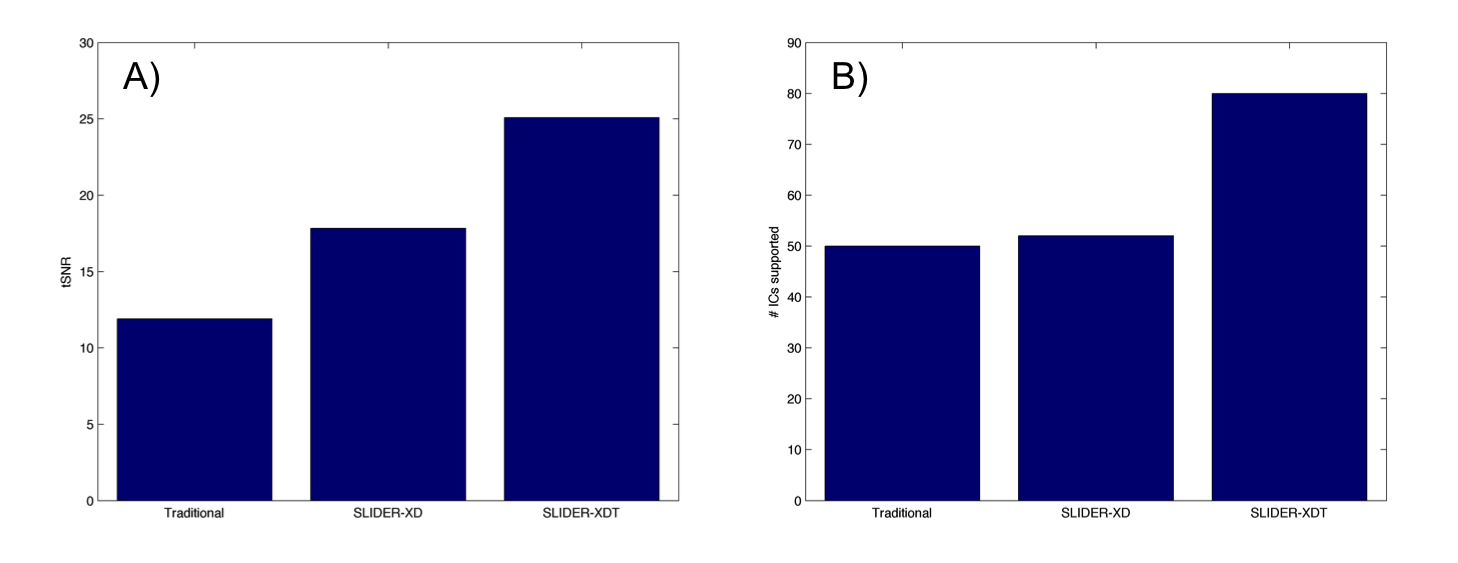
Figure 4. Quantification of A) tSNR and B) Number of supported Independent Components as determined by MELODIC in FSL.
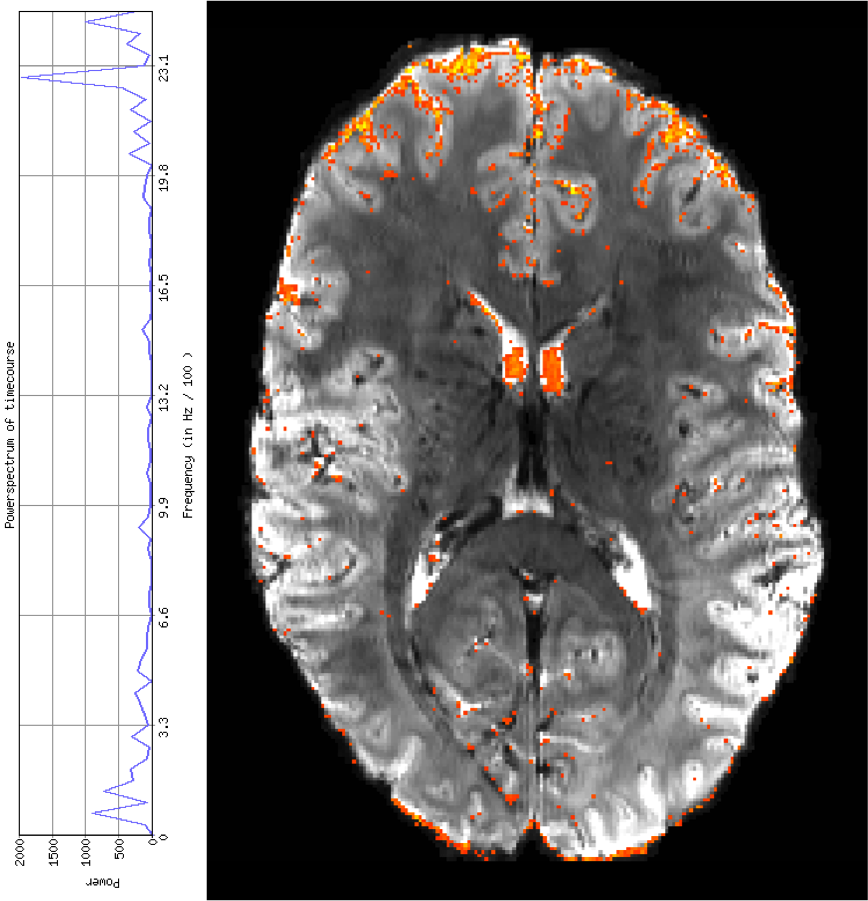
Figure 5. A example physiological noise component at a respiratory frequency of ~0.22 Hz detected by SLIDER-XDT. Power spectrum is shown on the left and thresholded z-statistics of the IC overlaid onto the corresponding mean EPI image on the right (color scale: red z = 0, yellow z = 10).