5444
Enhanced fMRI Using a Novel 3D Ultrafast Gradient-echo-based Sequence Using Spatiotemporal Encoding.1Center for Neuroscience Imaging Research, Institute for Basic Science, Suwon, Republic of Korea, 2Department of Biomedical Engineering, Sungkyunkwan University, Suwon, Republic of Korea
Synopsis
We recently introduced a novel ultrafast 3D gradient-echo-based imaging technique using spatiotemporal encoding (SPEN), which was dubbed RASE (Rapid Acquisition with Sequential Excitation). RASE has less sensitivity to field inhomogeneities and susceptibility differences compared to conventional multi-slice GE-EPI, sharing the advantages of 3D imaging such as high signal-to-noise ratio and high spatial resolution. In this preliminary study, we present very promising results of RASE-II fMRI, i.e., better t-scores, tSNR, and BOLD percent-signal-changes than conventional multi-slice GE-EPI, on a 9.4-T animal scanner.
Purpose
We recently introduced a novel ultrafast 3D gradient-echo-based imaging technique using spatiotemporal encoding (SPEN)1,2, which was dubbed RASE (Rapid Acquisition with Sequential Excitation). RASE not only provides high immunity to image artifacts due to field inhomogeneities and susceptibility differences, but also shares the advantages of 3D imaging such as high signal-to-noise-ratio (SNR) with high spatial resolution. Between two types of RASE-I and II, we previously reported that RASE-II could be applied to BOLD-fMRI with better tSNR than conventional GE-EPI2. Here, RASE-II fMRI was further investigated presenting t-score maps and BLOD percent-signal-change as well as tSNR in comparison with GE-EPI on a 9.4-T animal scanner (Bruker-BioSpec, 94/30 US/R).Method
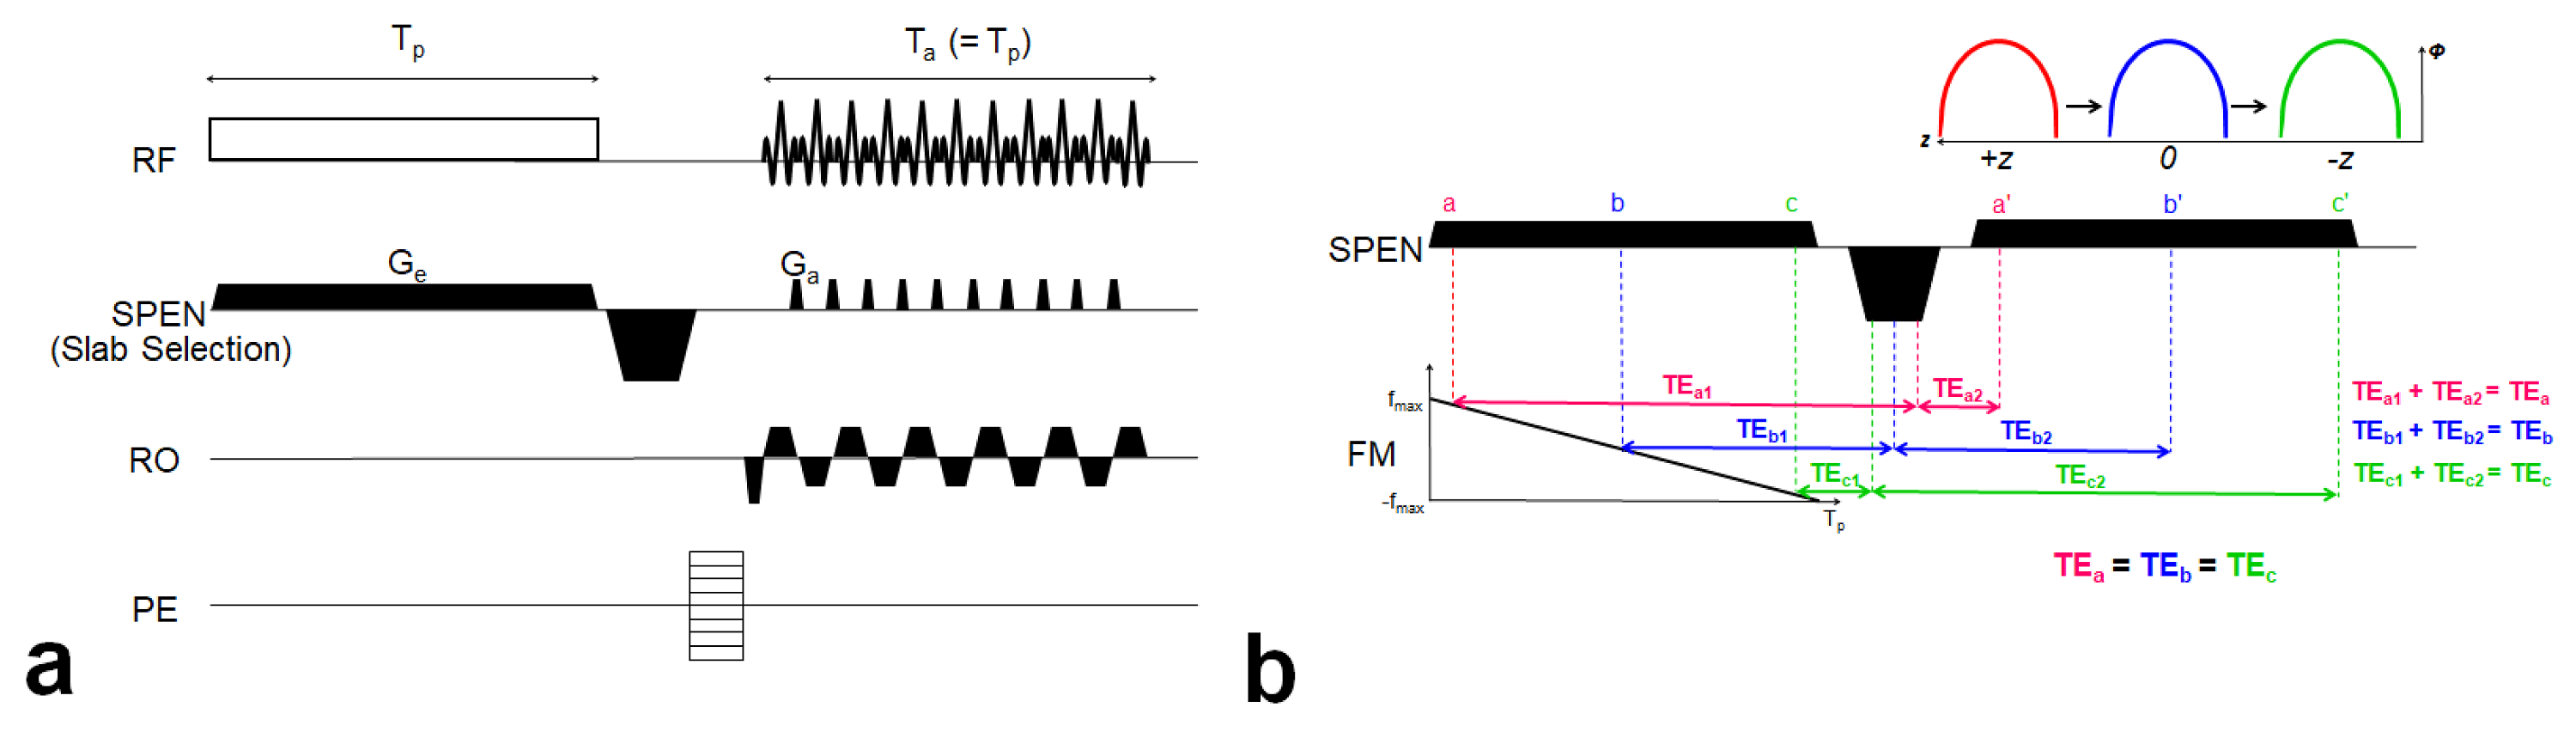
Sequence: Figure1 illustrates the RASE-II sequence diagram (a) and schematic description of its sequential and local excitation and rephasing mechanism in SPEN direction (b). A frequency-swept chirp pulse is used for spin excitation producing a quadratic phase that sequentially localizes a signal in both time and space. In RASE-II, spin excitation and data acquisition are performed with the same duration and, between them, a rephasing gradient is applied to make all the spins experience constant TE. Also note that SPEN is applied for slab encoding3.
Experiment: BOLD responses to electrical forepaw-stimulation were measured using a male Sprague-Dawley (SD) rat, aged 7-8 weeks, and weighing 270g. Rat was initially anesthetized with 4% isoflurane in a mixture of oxygen and air gases (1:9) and 2.5% during surgical preparation. After surgery, isoflurane anesthesia was discontinued and a-chloralose was injected (40mg/kg/90min). Two-needle electrodes were inserted into a left forepaw of the rat under the plantar skin between the second and the fourth digits to induce the electrical-stimulus pulses (333.0-ms pulse width and 1.5-mA current) at a frequency of 3 Hz. Each trial consisted of three consecutive periods: resting(49.92s; 20volumes)-stimulation(19.97s; 8volumes)-resting(49.92s; 20volumes). Common scan parameters were: volume-TR/TE = 2,496/25 ms, FOV = 30×15mm2, matrix = 96×48, number-of-slices = 48, slice-thickness = 0.31mm, FA(Ernst angle) = 75°(for GE-EPI), 14°(for RASE-II). For RASE-II imaging specifically, shot-TR = 52ms, pulse-length(Tp) = 18.43ms, R-value of the chirp pulse (=Tp×Bandwidth) = 64. Images were reconstructed offline with MATLAB(ver.8.2.0; R2013b) using the superresolution algorithm in SPEN direction4.
Results
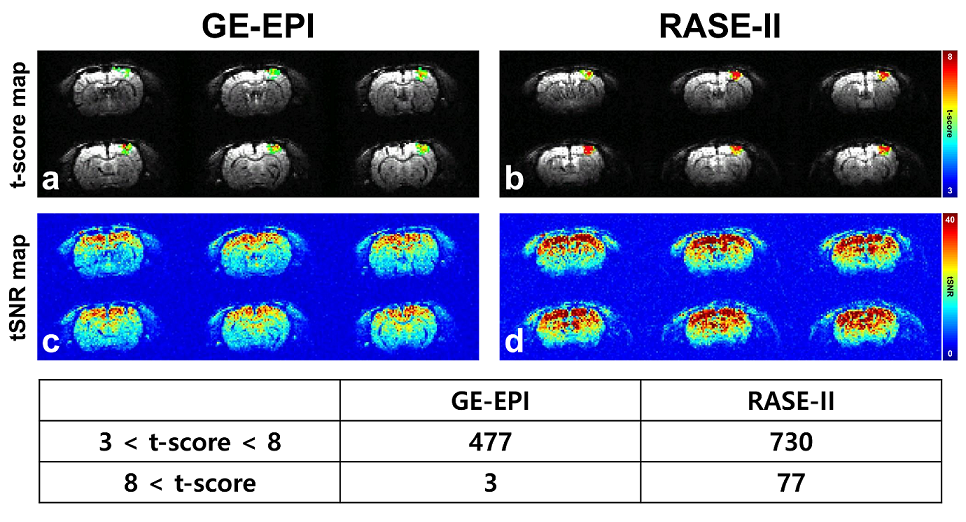
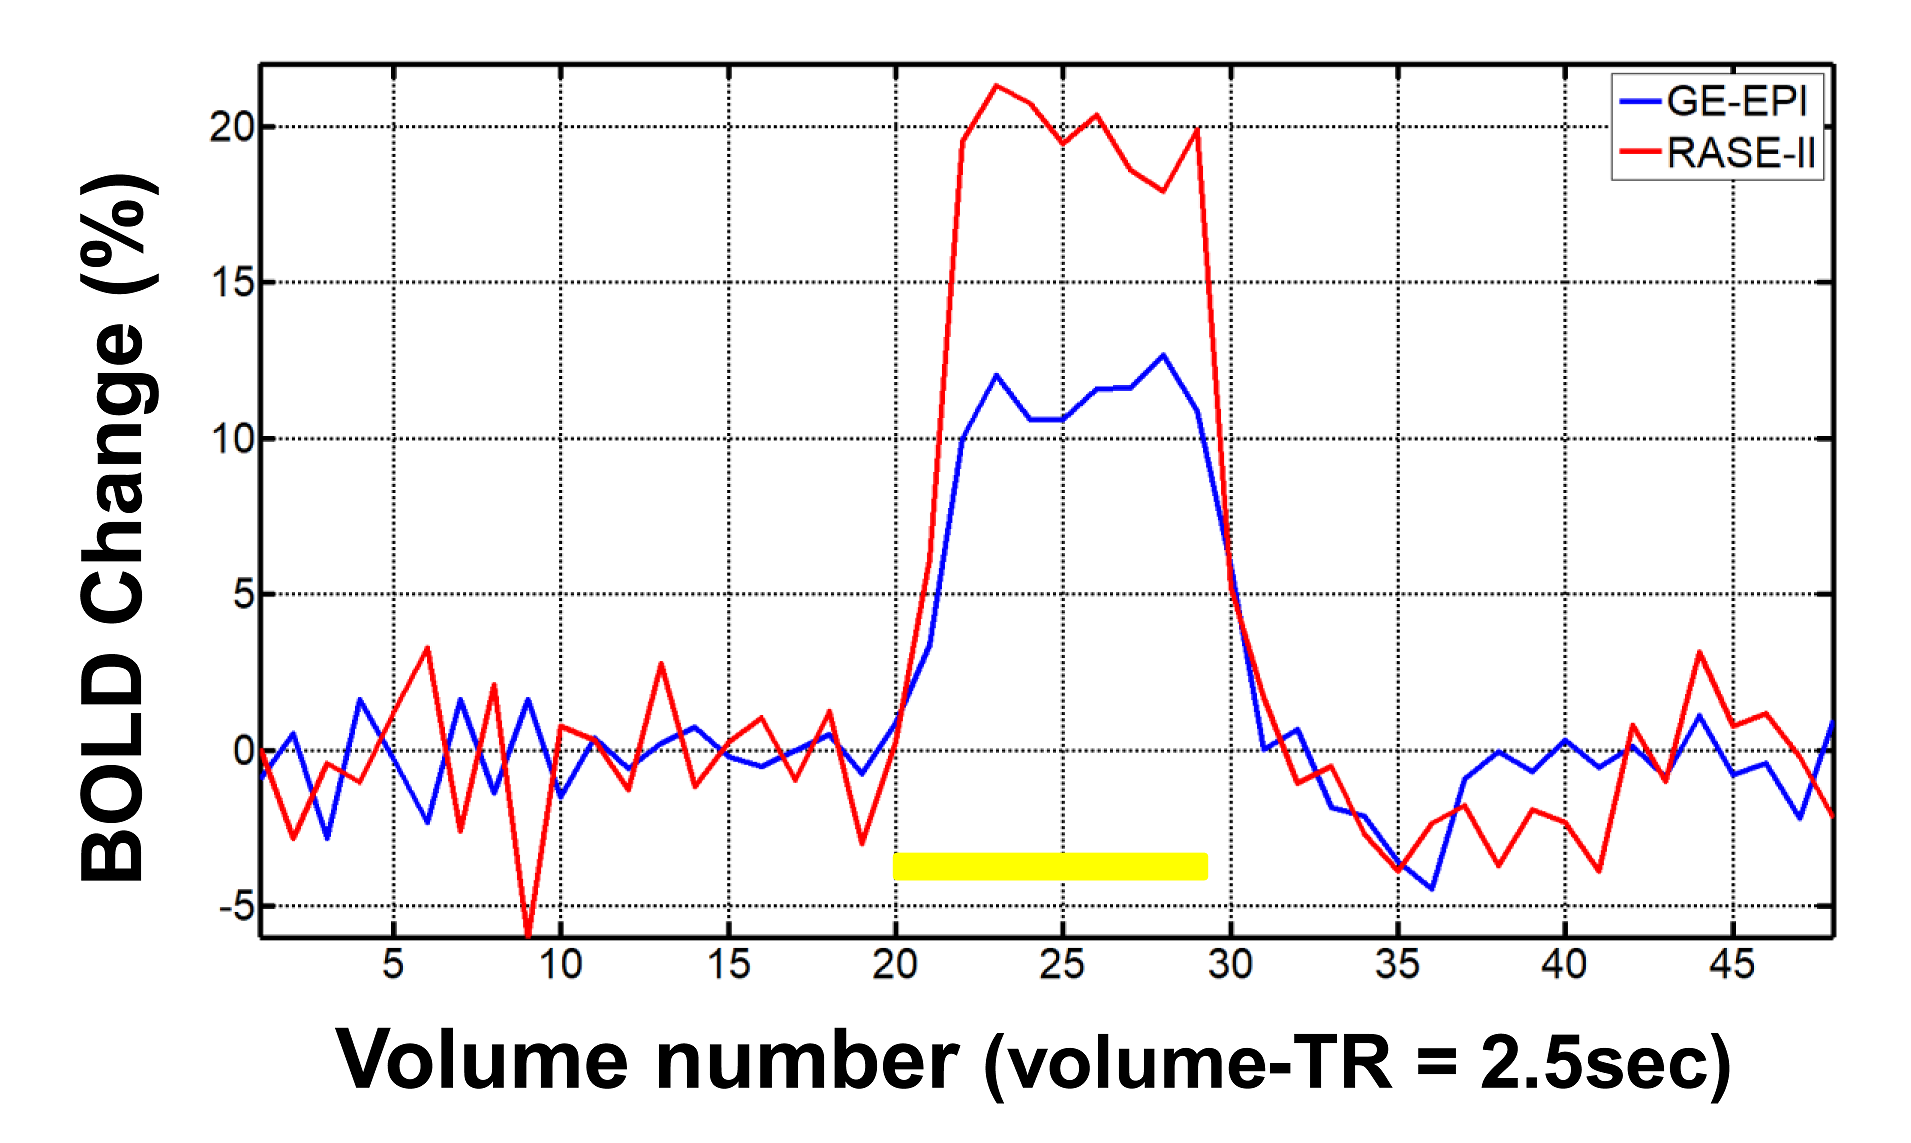
Figure2 shows fMRI results of three-trial average using GE-EPI(a,c) and RASE-II(b,d) on the somatosensort area of in-vivo rat brain. First and second rows display t-score map of BOLD activation(a,b) and tSNR map(c,d), respectively. Table in the third row shows t-score distributions over the activated voxels, focusing on t-scores above 3. RASE-II provided more activated voxels with higher t-scores than GE-EPI in the somatosensory area, especially making a huge difference in the range of high t-score > 8. The maximum t-score of GE-EPI and RASE-II was 9.05 and 11.65, respectively. In terms of tSNR, RASE-II was overall better than GE-EPI, which is consistent with previously reports that 3D imaging provides better tSNR than 2D counterparts when thermal noises are dominant over physiological noises, e.g., in high spatial resolution5,6. Figure3 shows the BOLD percent-signal-changes calculated in the same ROI which consists of 33 voxels around the voxel with the maximum t-score in GE-EPI. RASE-II (red line, maximum 21.5%) provided higher BOLD percent change than GE-EPI(blue line, maximum 12.7%) by a factor of ~1.7.Discussion & Conclusion
In this preliminary study, a new ultrafast 3D gradient-echo-based sequence, RASE-II, showed very promising results for fMRI, providing better t-scores, tSNR, and BOLD percent-signal-changes than conventional multi-slice GE-EPI. Such a nice performance of RASE-II fMRI might be understood in several respects: As a 3D imaging technique, RASE-II can provide a higher SNR than 2D counterparts. In addition, when thermal noises are dominant over physiological noises in high spatial resolution, tSNR is also better in 3D imaging5,6. Besides, the fact that all spins experience constant TE in RASE-II can partly contribute to enhancing t-scores or percent-signal-change when an optimal TE is used to maximize BOLD effects. Since RASE-II is more T1-weighted due to shorter shot-TR, inflow effects might also contribute to the improvement of t-scores or percent-signal-change, but might not be significant because inflow effects are expected not to be high in 3D imaging with low flip angles like RASE-II. Rather, intra-vascular contribution can be a more significant factor8. While intra-vascular components barely contribute to BOLD signals in GE-EPI due to T2* shortening, they can still work to some extent in RASE-II because RASE-II has less sensitivity to T2* shortening due to its intrinsic local refocusing mechanism1,2. A further study is warranted to fully elucidate the sources of RASE-II fMRI signals by investigating TE-, TR- and R-value dependency.Acknowledgements
This work was supported by IBS-R015-D1.References
[1] Ryu JK, et al. A new ultrafast 3D gradient-echo magnetic resonance imaging method: RASE-I. In Proceedings of the 25th Annual Meeting of ISMRM. 2017.
[2] Ryu JK, et al. A new ultrafast 3D gradient-echo-based imaging method: RASE-II. In Proceedings of the 25th Annual Meeting of ISMRM. 2017.
[3] Ryu JK, et al. Utilizing 3D spatiotemporally encoded imaging from a different perspective. In Proceedings of the 23th Annual Meeting of ISMRM. 2015.
[4] Chen Y, et al. Partial fourier transform reconstruction for single-shot MRI linear frequency-swept excitation. Mag Reson Med. 2013;69:1326-1336.
[5] Poser B.A, et al. Three dimensional echo-planar imaging at 7 Tesla. Neuroimage. 2010;51:261-266.
[6] van der Zwaag w, et al. Temporal SNR characteristics in segmented 3D-EPI at 7T. Mag Reson Med. 2012;67:344-352.
[7] Jin T, et al. Source of nonlinearity in echo-time-dependent BOLD fMRI. Mag Reson Med. 2006;55:1281-1290.
[8] Gao J.H, et al. Inflow effects on functional MRI. Neuroimage. 2012;62:1035-1039.
Figures