5436
Quantifying cerebral hemodynamics in developing children using multiple post-labeling delay pseudo-continuous arterial spin labeling1Brigham and Women's Hospital, Boston, MA, United States, 2Boston Children's Hospital, Boston, MA, United States, 3UCLA, Los Angeles, CA, United States
Synopsis
Arterial Spin Labeling (ASL) is an attractive option for studies in pediatric populations due to its ability to acquire quantitative cerebral perfusion measurements without ionizing radiation. Brain vascular dynamics in children are different from adults and rapidly changing with age. ASL sequence parameters must therefore be carefully chosen and longitudinal studies must account for normally occurring neurodevelopment. Here we present a multiple-post label delay pseudo-continuous ASL approach to quantifying cerebral blood flow, arterial transit time, and cerebral blood volume in children. We show analysis of the PLD selections with respect to ATT values and test-retest reliability of the CBF measurements.
Introduction
Arterial Spin Labeling (ASL) permits non-invasive quantification of cerebral perfusion (CBF) without ionizing radiation or intravenous contrast agent. The approach provides a critical advantage for applications in pediatric populations1 that allows substantial increases in sample size and the possibility of longitudinal developmental investigations without cumulative risk to the subject. Despite its advantages, optimization and reliability remain important issues in the clinical applicability of ASL in pediatric populations. Of particular relevance for sequence optimization is the relationship between the post-label delay time (PLD) and the arterial transit time (ATT), which is highly variable during neurodevelopment as evidenced by the non-linear trajectories in CBF2. In the present study, we evaluate the reliability of an optimized multiple-PLD pseudo-continuous ASL (pCASL) approach to quantifying CBF in children. We show analysis of the PLD selections with respect to ATT values and test-retest reliability of the CBF measurements.Methods
Eight healthy volunteers (age range 12-21 years, 5 females) were imaged twice three months apart after obtaining consent and in accordance with the institutions local ethics committee.
MRI Acquisition: All subjects were scanned in a 3T MRI scanner with 32-channel receive only head coil (Siemens Healthcare Inc, USA). Perfusion data was acquired using a multi-PLD pCASL sequence3 [single-shot GE-EPI readout; TR = 5130; TE = 12ms, FOV = 220mm2, matrix = 64x64, 20 slices, slice thickness = 5mm; PLDs = 700, 1400, 2100, 2800ms; labeling duration =1500ms]. A high resolution structural T2-weighted image was acquired using a 3D TSE sequence.
Data Analysis: ATT was derived following the approach of Dai et al using the weighted delay function, WD, in Equation (1) and numerical inversion of the WD to ATT relationship4. Quantification of CBF at each delay, $$$f(i)$$$, was then calculated using the ATT values and Equation (2)5. The longitudinal relaxation rate of blood, $$$R1a$$$, was adjusted for age and gender as $$$R1a$$$ (= 2115.6–21.5*age-73.3*sex), where female sex was set to 0 and male was set to 16. CBV maps were obtained according to the relationship in Equation (3)7. Individual maps were coregistered to the structural image and normalized to the MNI 152 template space.
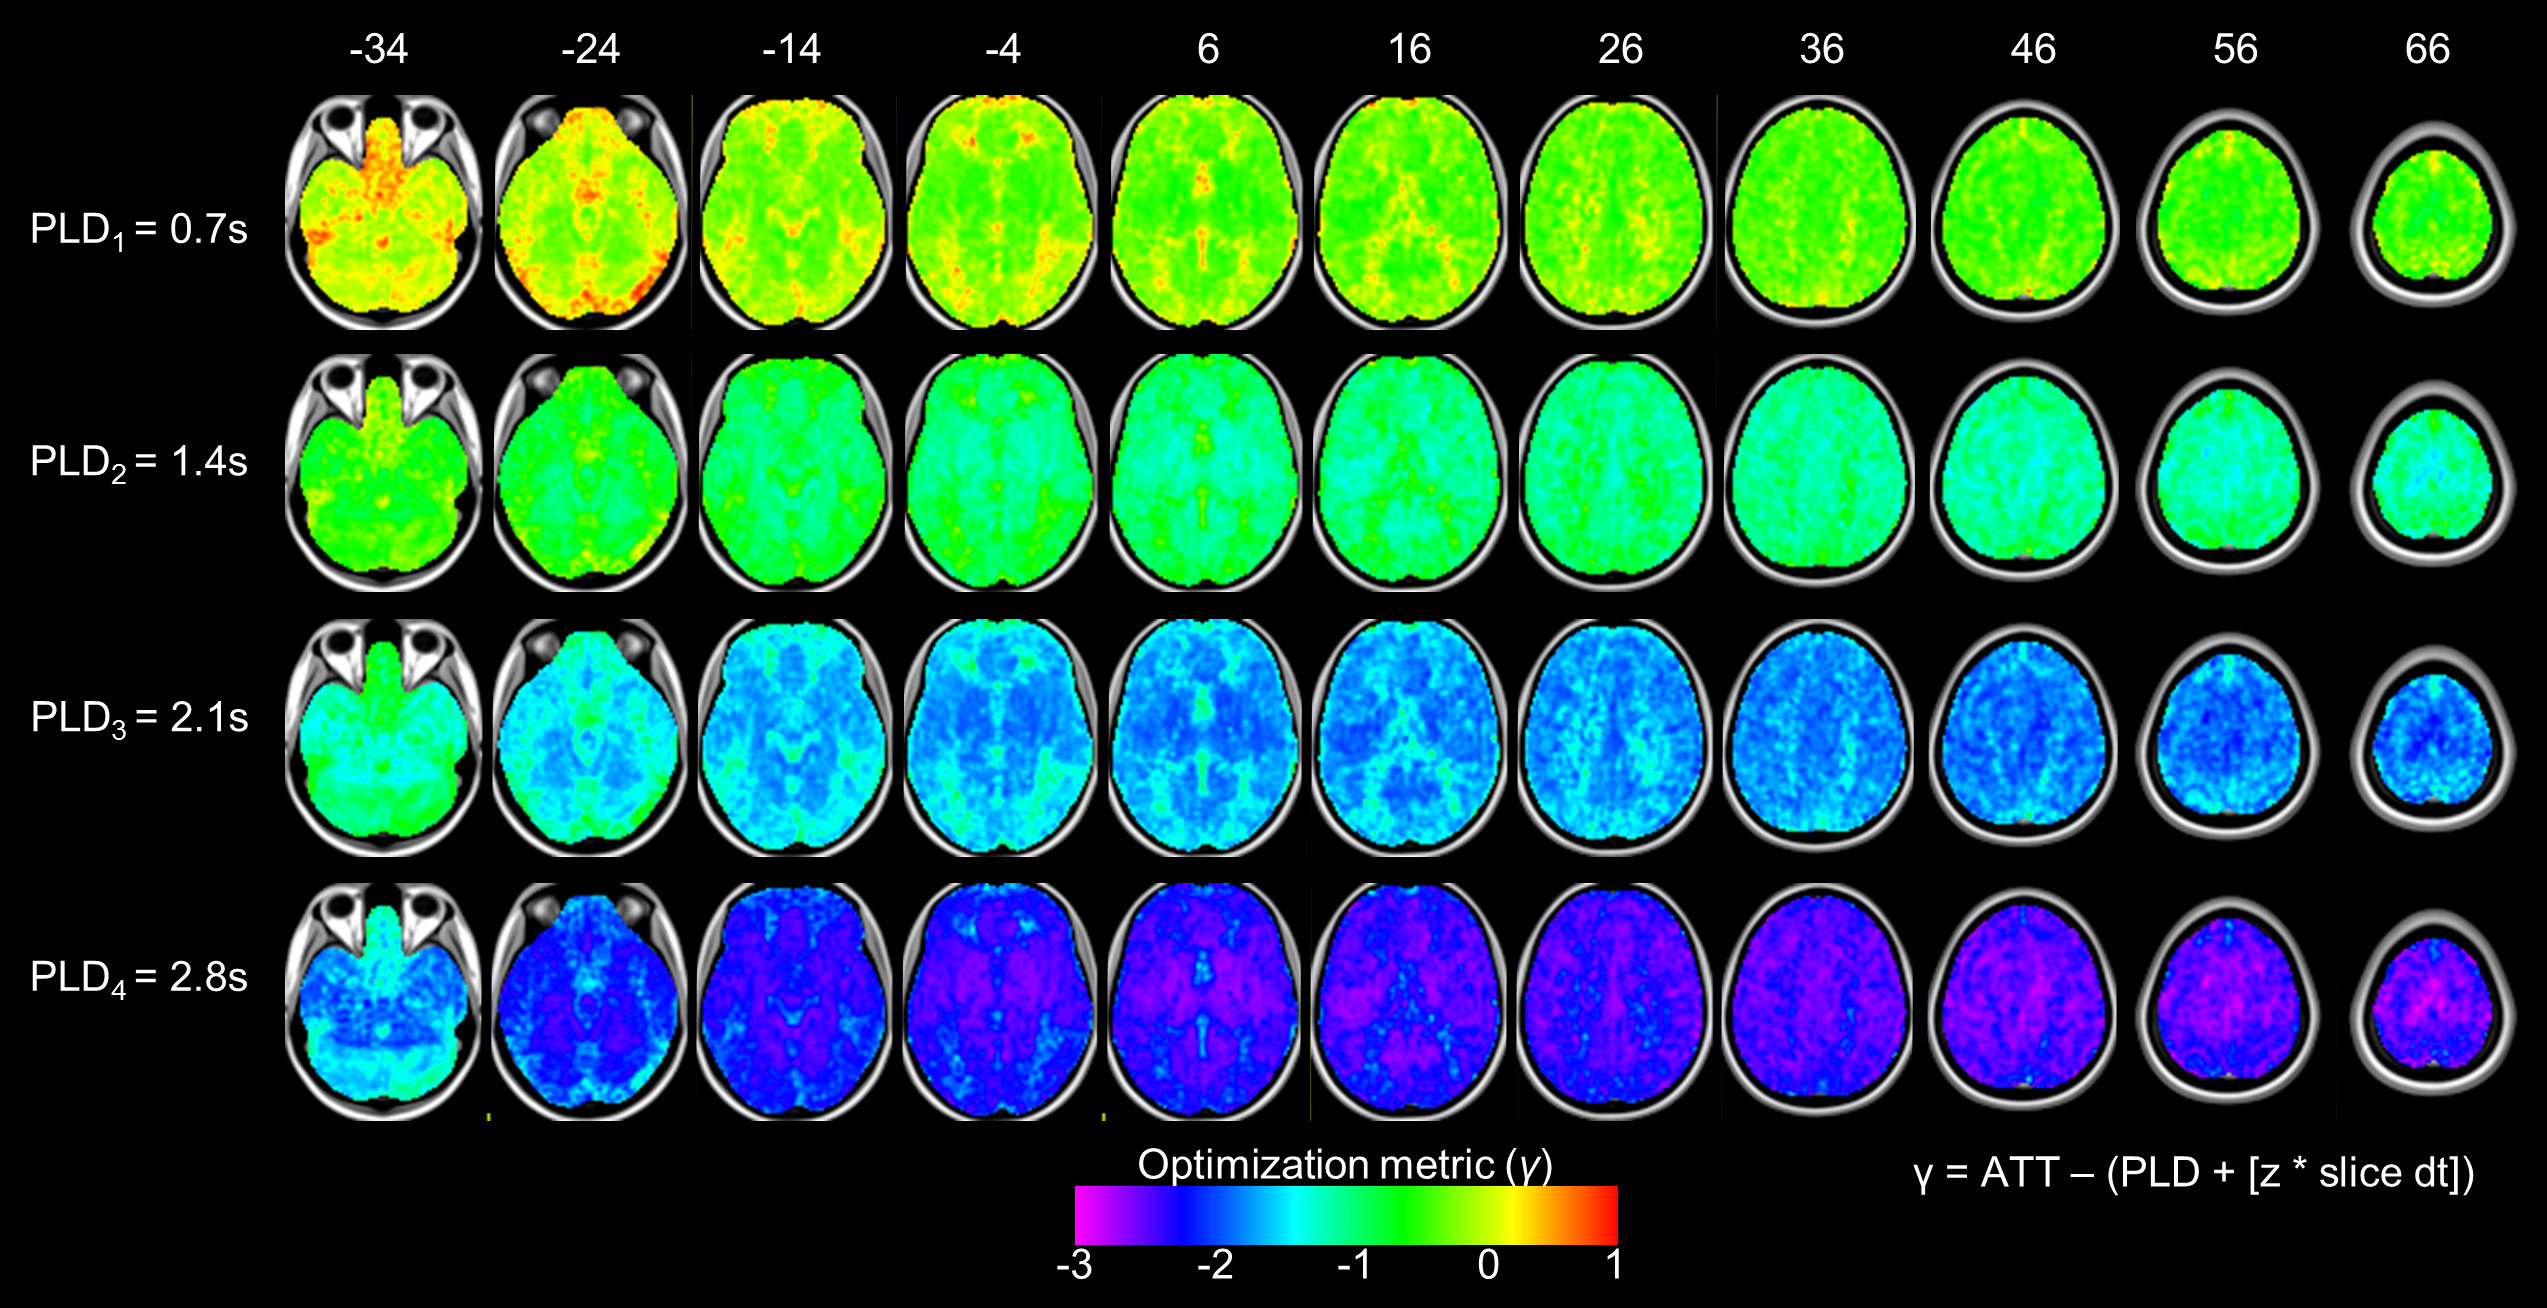
Optimization and Test-Retest: The choice of the PLD times was evaluated using Equation (4), where γ compares the time that image data is acquired against the arrival time of the tagged blood8. Reliability of the CBF measurements was assessed using the intra-class correlation coefficient (ICC)9 in Equation (5), where BMS is the between-targets mean square, EMS is the error mean square, and k =2 is the number of repeated sessions.
Equations:
(1) $$ WD = [ ∑ w(i)·ΔM(i) ] / [ ∑ ΔM(i) ] $$
(2) $$ [ λΔM(i)·R1a ] / [ 2αM0·[ exp( ( min( δ - w(i),0 ) - δ )·R1a ) - exp( -τ + w(i) )·R1a ] ] $$
(3) $$ aCBV = CBF·ATT $$
(4) $$ γ = ATT - (PLD + [ z·slice dt ]) $$
(5) $$[ BMS - EMS ] / [ BMS + (k-1)EMS ] $$
Results
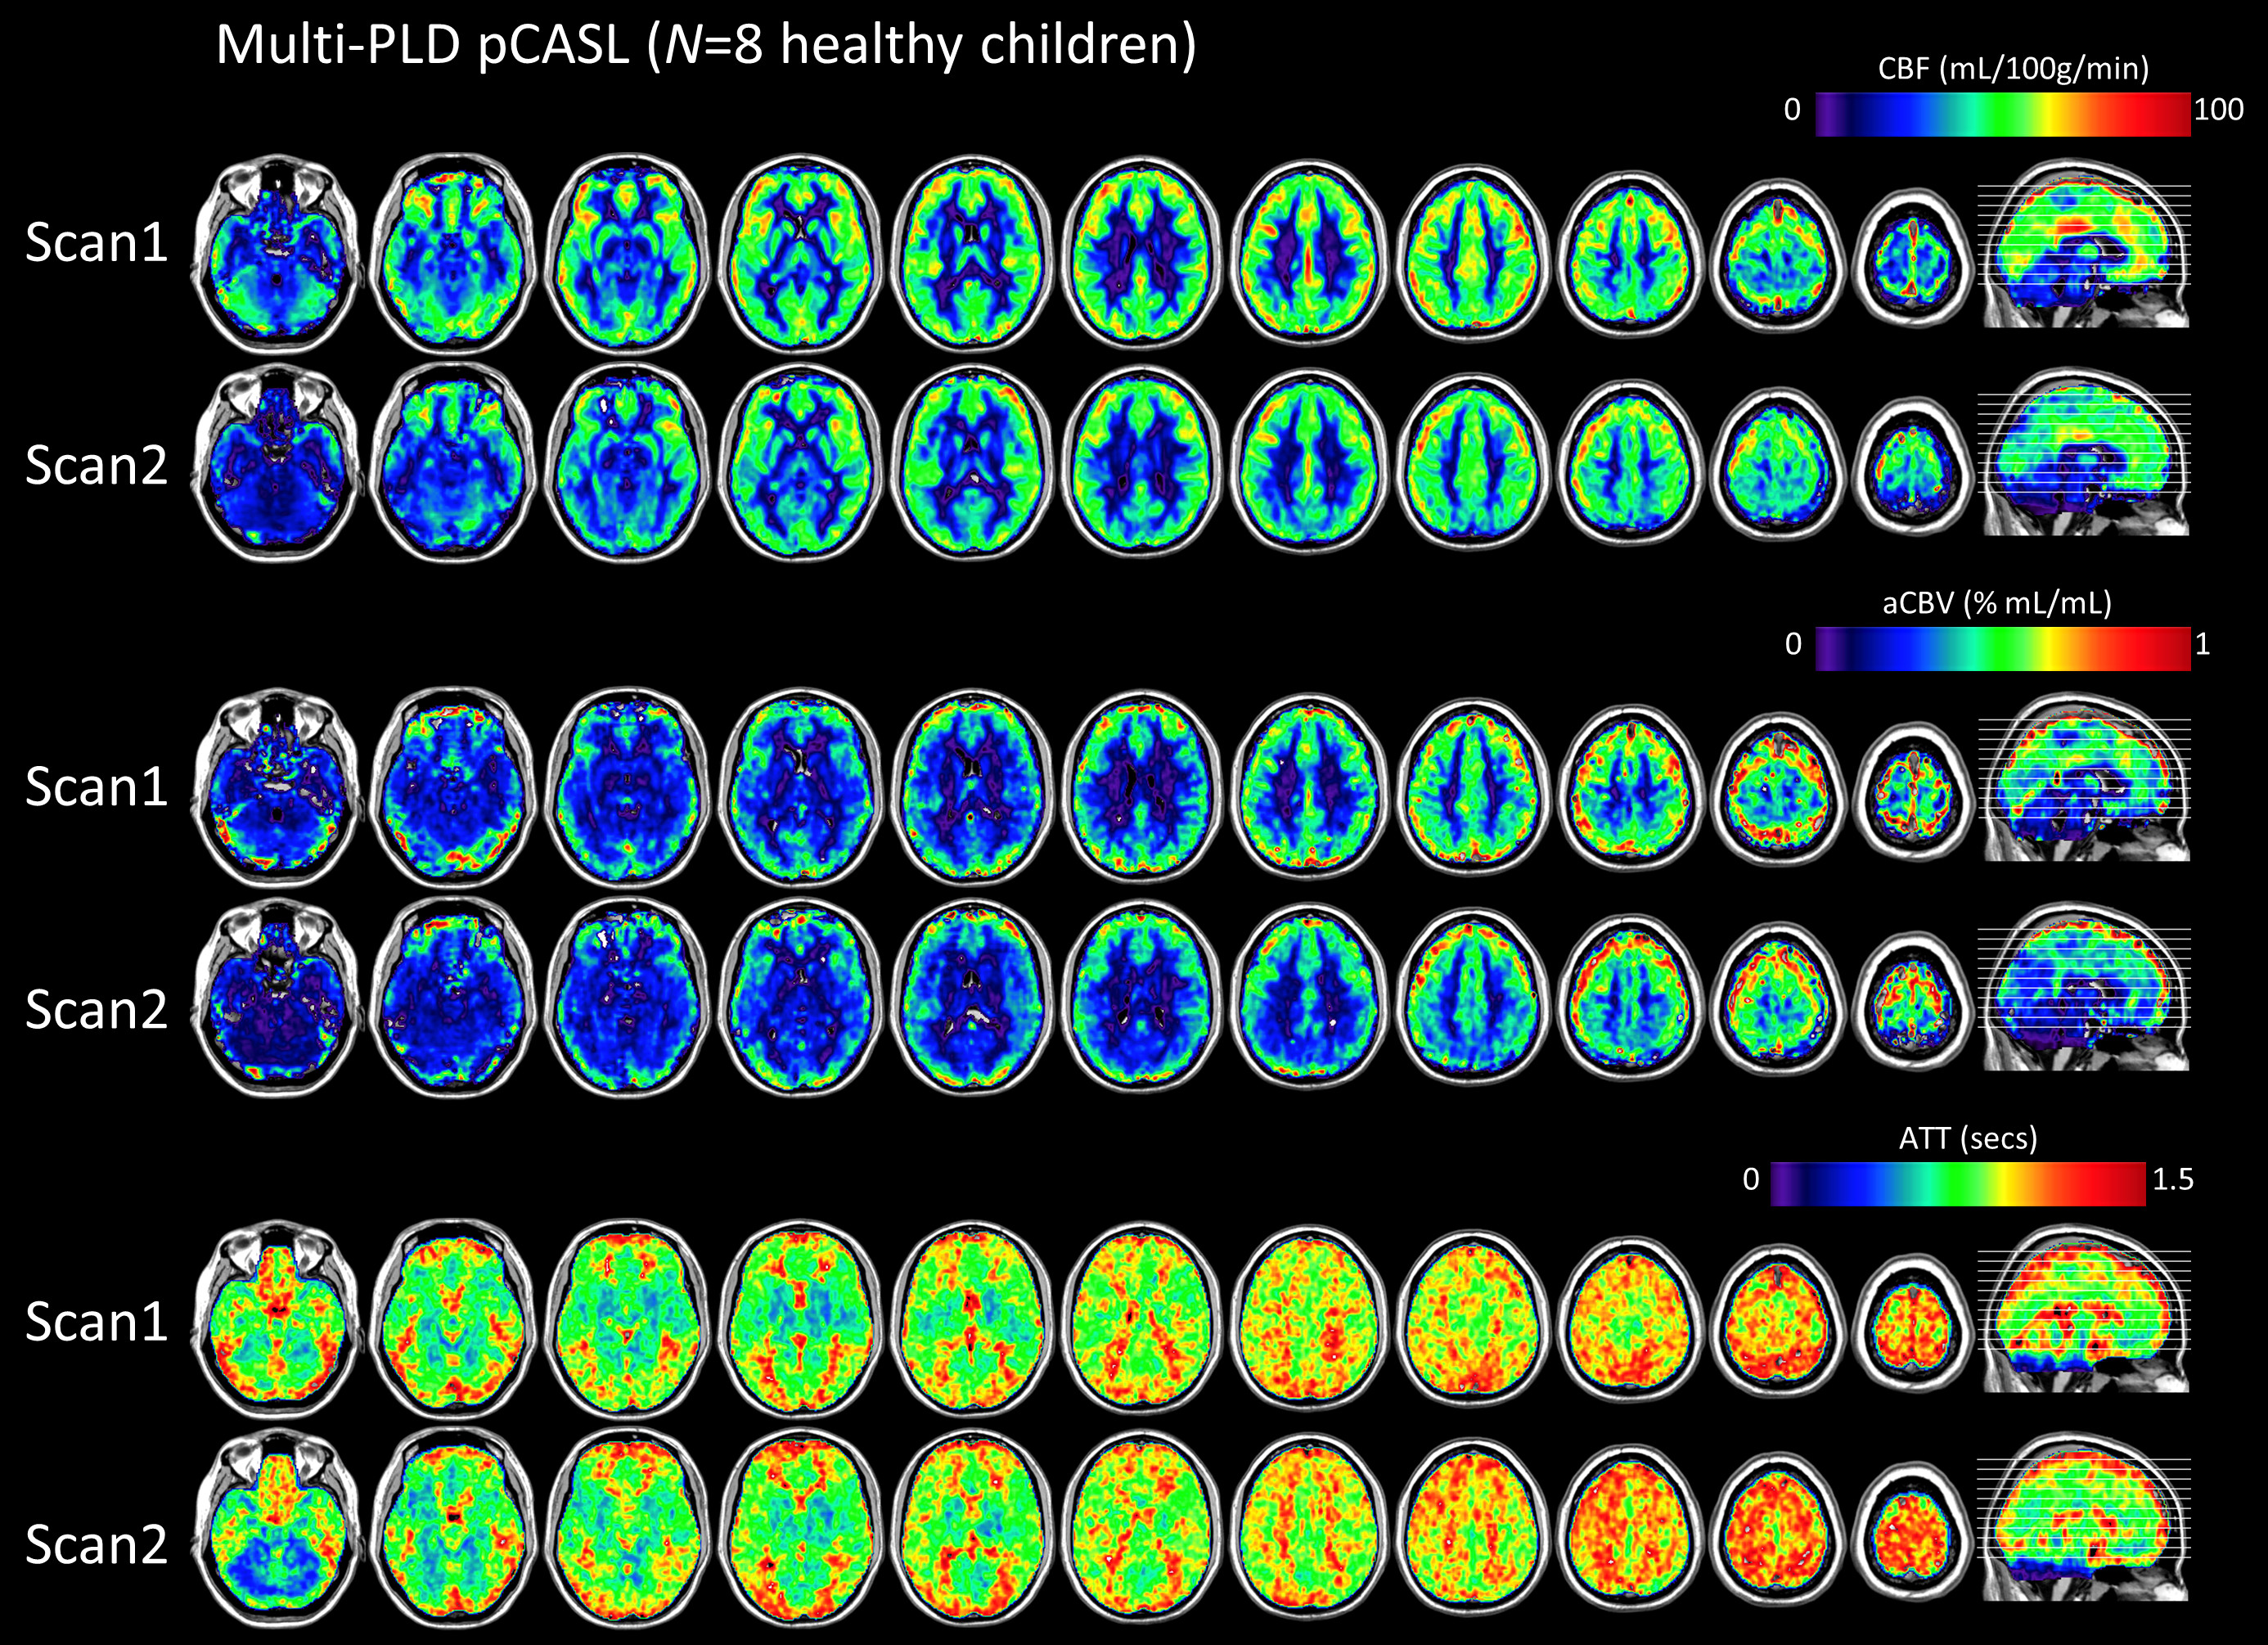
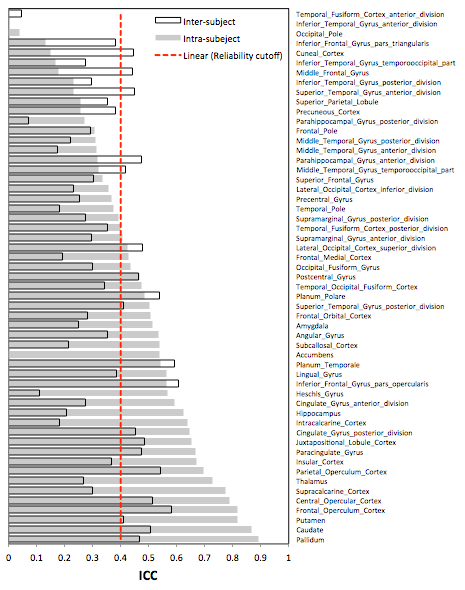
Figure 1 shows the quantitative maps of CBF and hemodynamic parameters ATT and CBV that were calculated at baseline and 3 months. Performance of the PLD selections is shown in Figure 2. The optimization metric γ reveals the timing of each PLD with respect to the imaging readout and the ATT. Figure 3 displays the ICC values for the intra- and inter-subject reliability of regional CBF. Within subject, 32 (out of 55) anatomical regions were classified as reliable (ICC>0.4), whereas at the group-level only 20 regions passed the reliability cutoff.Discussion & Conclusions
The CBF estimates were substantially more reliable within-subject than across the subject pool, indicating that inter-subject variance alone cannot be explained by poor reproducibility of the multi-PLD pCASL technique. We conclude that CBF (in addition to ATT and CBV) show a dynamic change during normal development and should be carefully addressed in longitudinal pediatric studies of brain perfusion.Acknowledgements
The work was supported by NIH grants K01EB023983 (NT) and R01 NS095655 (DB)References
1. Wang, J., Licht, D.J., Jahng, G.H., Liu, C.S., Rubin, J.T., Haselgrove, J., Zimmerman, R.A., Detre, J.A., 2003. Pediatric perfusion imaging using pulsed arterial spin labeling. J Magn Reson Imaging 18, 404-413
2. Satterthwaite, T.D., Shinohara, R.T., Wolf, D.H., Hopson, R.D., Elliott, M.A., Vandekar, S.N., Ruparel, K., Calkins, M.E., Roalf, D.R., Gennatas, E.D., Jackson, C., Erus, G., Prabhakaran, K., Davatzikos, C., Detre, J.A., Hakonarson, H., Gur, R.C., Gur, R.E., 2014. Impact of puberty on the evolution of cerebral perfusion during adolescence. Proc Natl Acad Sci U S A 111, 8643-8648.
3. Wu, W.C., Fernandez-Seara, M., Detre, J.A., Wehrli, F.W., Wang, J., 2007. A theoretical and experimental investigation of the tagging efficiency of pseudocontinuous arterial spin labeling. Magn Reson Med 58, 1020-1027.
4. Dai, W., Robson, P.M., Shankaranarayanan, A., Alsop, D.C., 2012. Reduced resolution transit delay prescan for quantitative continuous arterial spin labeling perfusion imaging. Magn Reson Med 67, 1252-1265.
5. Alsop, D.C., Detre, J.A., Golay, X., Gunther, M., Hendrikse, J., Hernandez-Garcia, L., Lu, H., MacIntosh, B.J., Parkes, L.M., Smits, M., van Osch, M.J., Wang, D.J., Wong, E.C., Zaharchuk, G., 2015. Recommended implementation of arterial spin-labeled perfusion MRI for clinical applications: A consensus of the ISMRM perfusion study group and the European consortium for ASL in dementia. Magn Reson Med 73, 102-116.
6. Wu, W.C., Jain, V., Li, C., Giannetta, M., Hurt, H., Wehrli, F.W., Wang, D.J., 2010. In vivo venous blood T1 measurement using inversion recovery true-FISP in children and adults. Magn Reson Med 64, 1140-1147.
7. Zierler, K., 1962. Theoretical basis of indicator-dilution methods for measuring flow and volume. Circ Res 10, 393-407.
8. Mezue, M., Segerdahl, A., Okell, T., Chappell, M., Kelly, M., Tracey, I., 2014. Optimization and reliability of multiple postlabeling delay pseudo-continuous arterial spin labeling during rest and stimulus-induced functional task activation. J Cereb Blood Flow Metab. Dec; 34(12): 1919–1927.
9. Shrout, P.E., Fleiss, J.L., 1979. Intraclass correlations: uses in assessing rater reliability. Psychol Bull 86, 420-428
Figures