5434
Trajectories of brain lactate and energy metabolite concentrations do not contribute to elevated aerobic glycolysis across childhood1Anesthesiology, Yale School of Medicine, New Haven, CT, United States, 2Department of Neurology, University of Arkansas for Medical Sciences, Little Rock, AR, United States, 3Anesthesiology, Stony Brook Medicine, Stony Brook, NY, United States, 4Panum Institute, University of Copenhagen, Copenhagen, Denmark, 5Department of Biomedical Engineering & Radiology and Biomedical Imaging, Yale School of Medicine, New Haven, CT, United States
Synopsis
Lactate is produced in normal brain even when O2 levels are ample, and high lactate production may explain aerobic glycolysis (AG) in developing brain. We evaluated steady state lactate concentrations ([Lac]) in brains of 87 children using 1HMRS while they underwent routine MRI examination. The trajectory of [Lac] in cerebral cortex across childhood was below the 0.5-0.7 mM range in normal adult brain. Thus, lactate accumulation and efflux are unlikely to underlie excessive AG in children.
Introduction
Characterizing
the metabolic needs of the developing brain is essential for brain health and
for understanding disease processes arising during childhood and adolescence. The
growth pattern of brain development is complex and is paralleled by age-varying
energy requirements. A disproportionately higher rate of glucose utilization
(CMRglc) ( ̴33%) compared
with oxygen consumption (i.e. aerobic glycolysis, AG) was documented in
children’s brain and proposed to support developmental processes1, 2. Several candidate metabolic pathways may
explain the non-oxidative glucose consumption and lactate production is
considered a major contender. The ≈33% excess CMRglc equals 0.18 μmol
glucose/g/min or 0.36 μmol/g/min lactate release from brain. Here we characterize the trajectory of the cortical
lactate concentration, [Lac], across childhood to determine if indeed lactate
accumulates in brain and is high enough to account for the glucose consumed in
excess of oxygen and to support a high rate of lactate
efflux from the young brain.Methods
De-identified 1HMRS spectra and anatomical T1-weighted scans from 87 children undergoing routine MRI were used. 1HMRS from 60 of the 87 children were previously reported in a study focusing on another topic3. The 1HMRS spectra were analyzed using LCModel. To assess the magnitude of glucose-oxygen uncoupling consistent with the measured lactate levels we also calculated the cerebral metabolic rate of lactate, CMRlac according to Eq. 1-3.
$$ CMR_{Lac} = V_{in} - V_{out}\quad\quad\quad\quad\quad(Eq. 1)$$
$$ V_{in} = V_{MAX}\frac{[Lac]_{p}}{K_{T}+[Lac]_{p}+[Lac]_{B}}\quad\quad(Eq. 2)$$
$$ V_{in} = V_{MAX}\frac{[Lac]_{B}}{K_{T}+[Lac]_{p}+[Lac]_{B}}\quad\quad(Eq. 3)$$
Where [Lac]p and [Lac]B are the concentrations of lactate in plasma and brain, respectively. Since we did not measure [Lac]p in the children we set it to be 0, 1, or 2 mM for the calculations, according to normal clinical reference ranges. Lactate transport kinetic parameters VMAX and KT determined previously in adult brain of 0.4μmol/g/min and 5.1 mM4, respectively, were used for the calculations.
Results
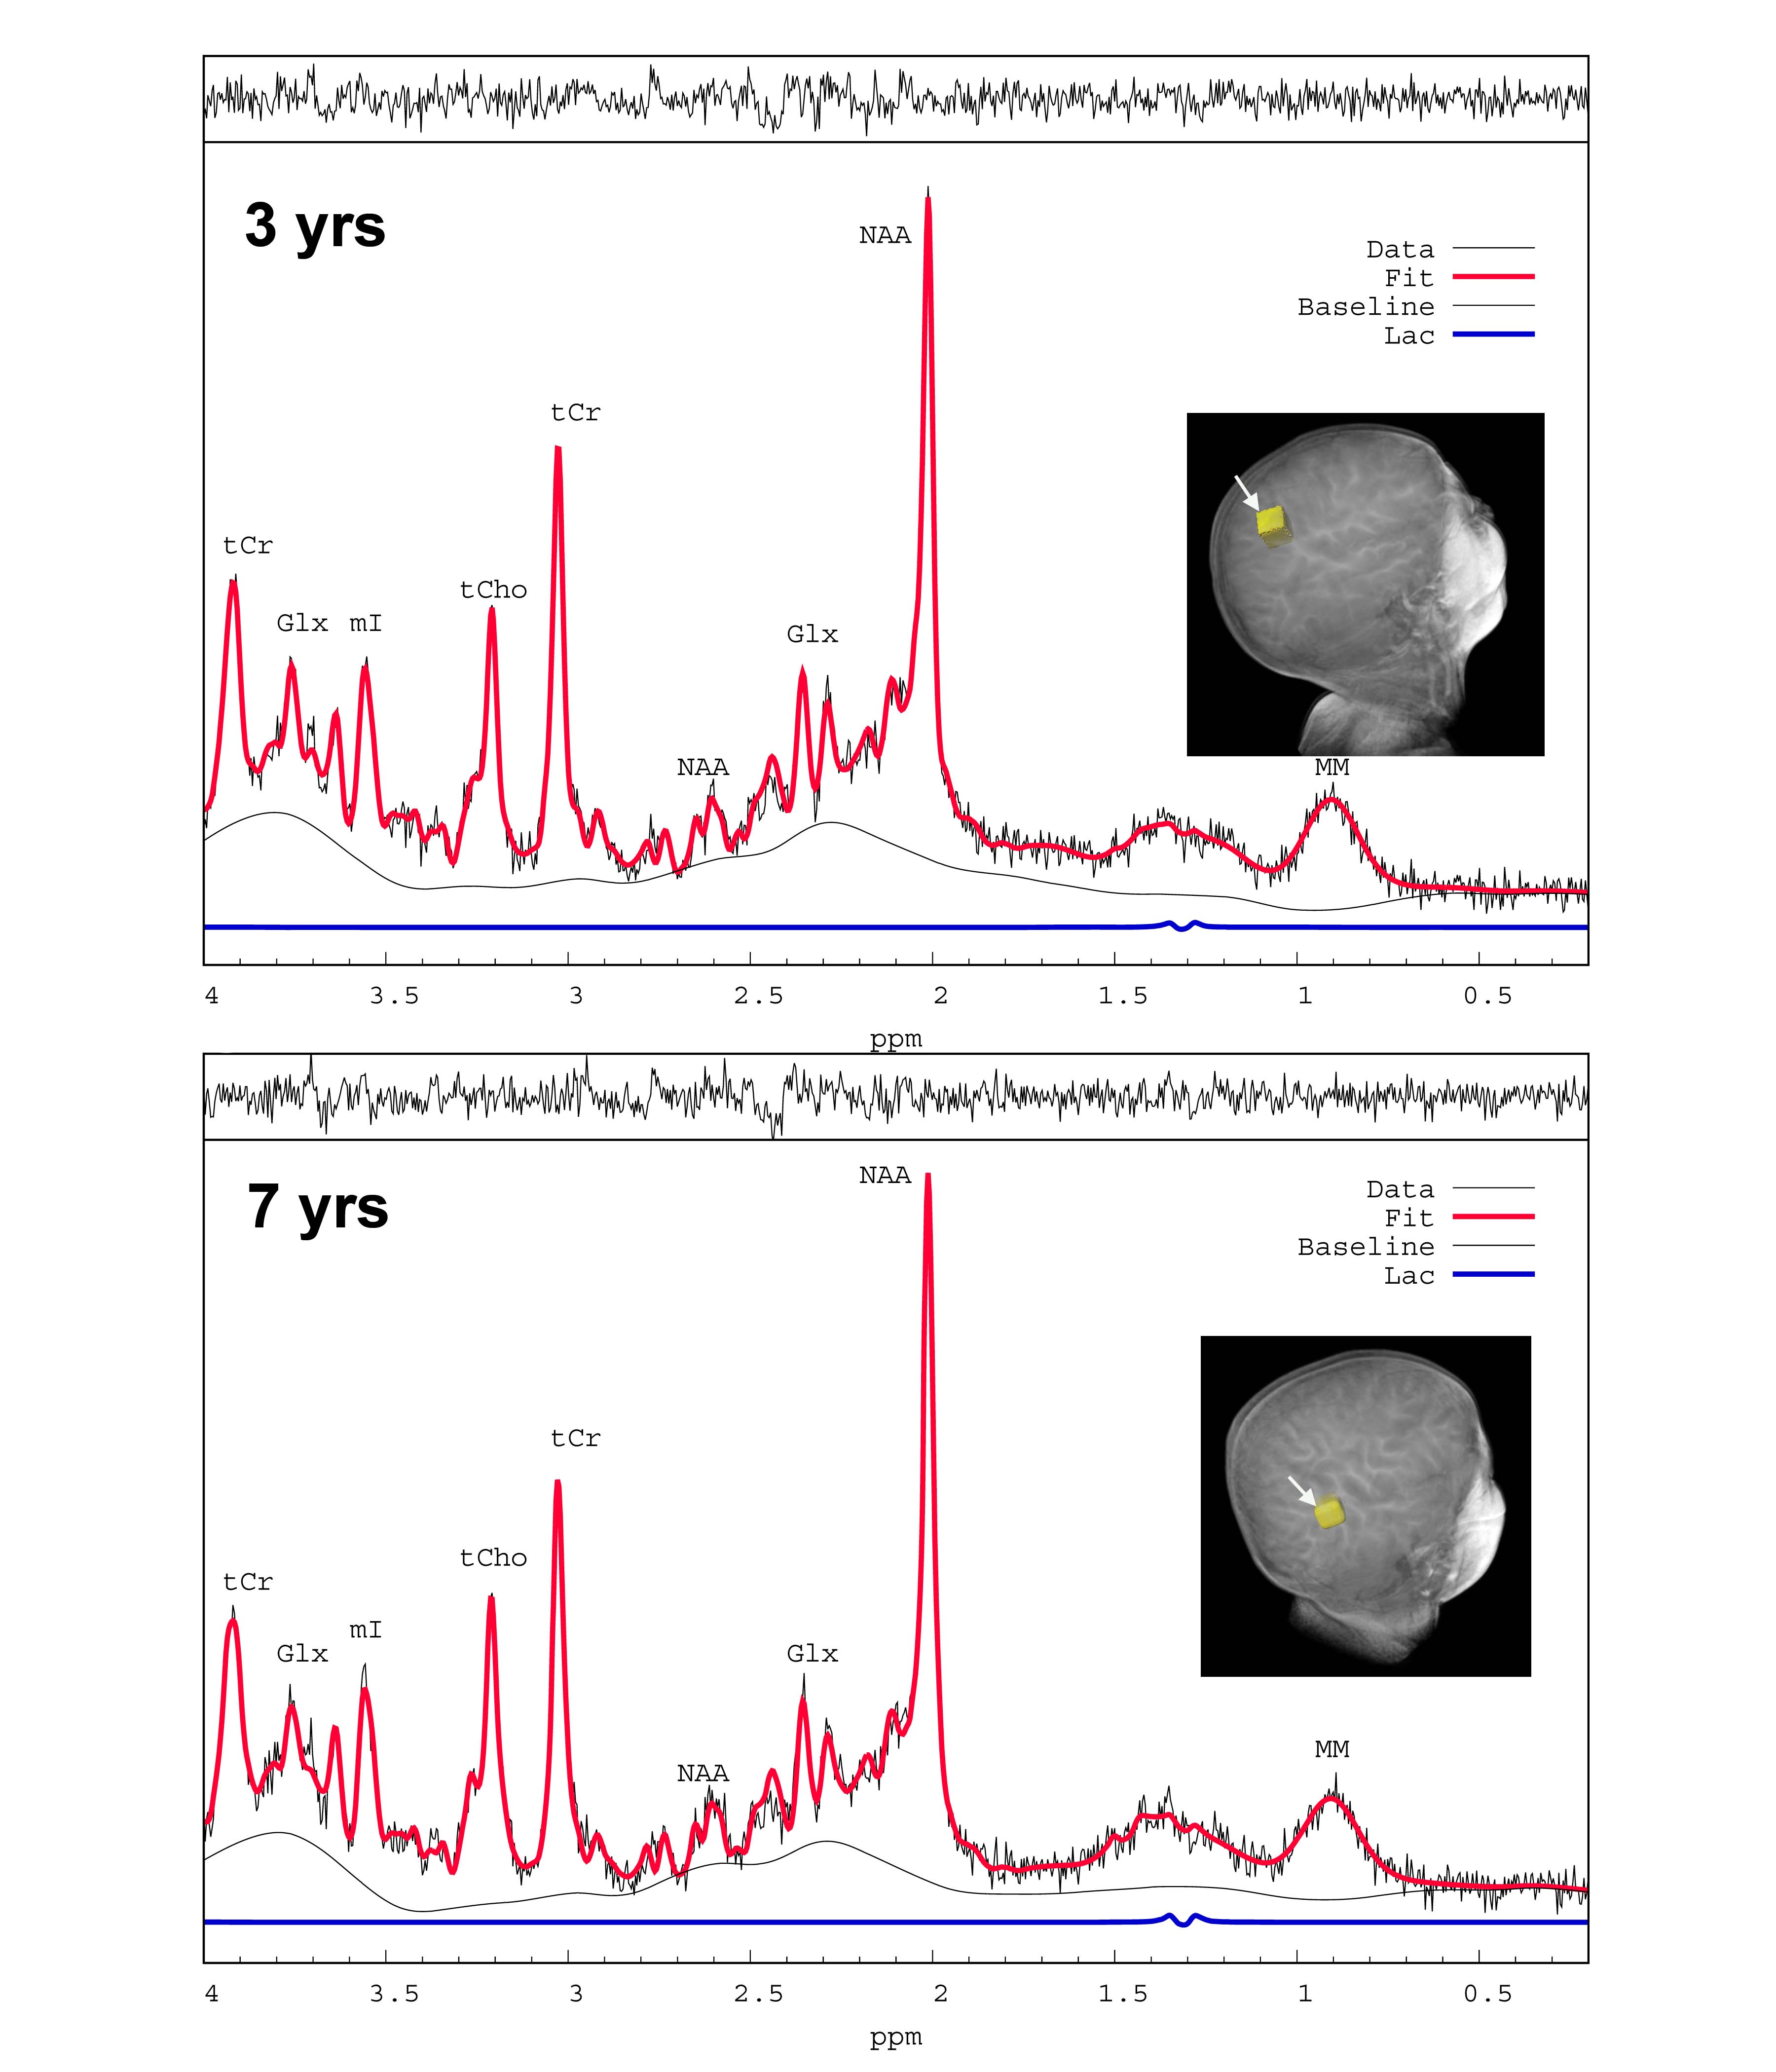
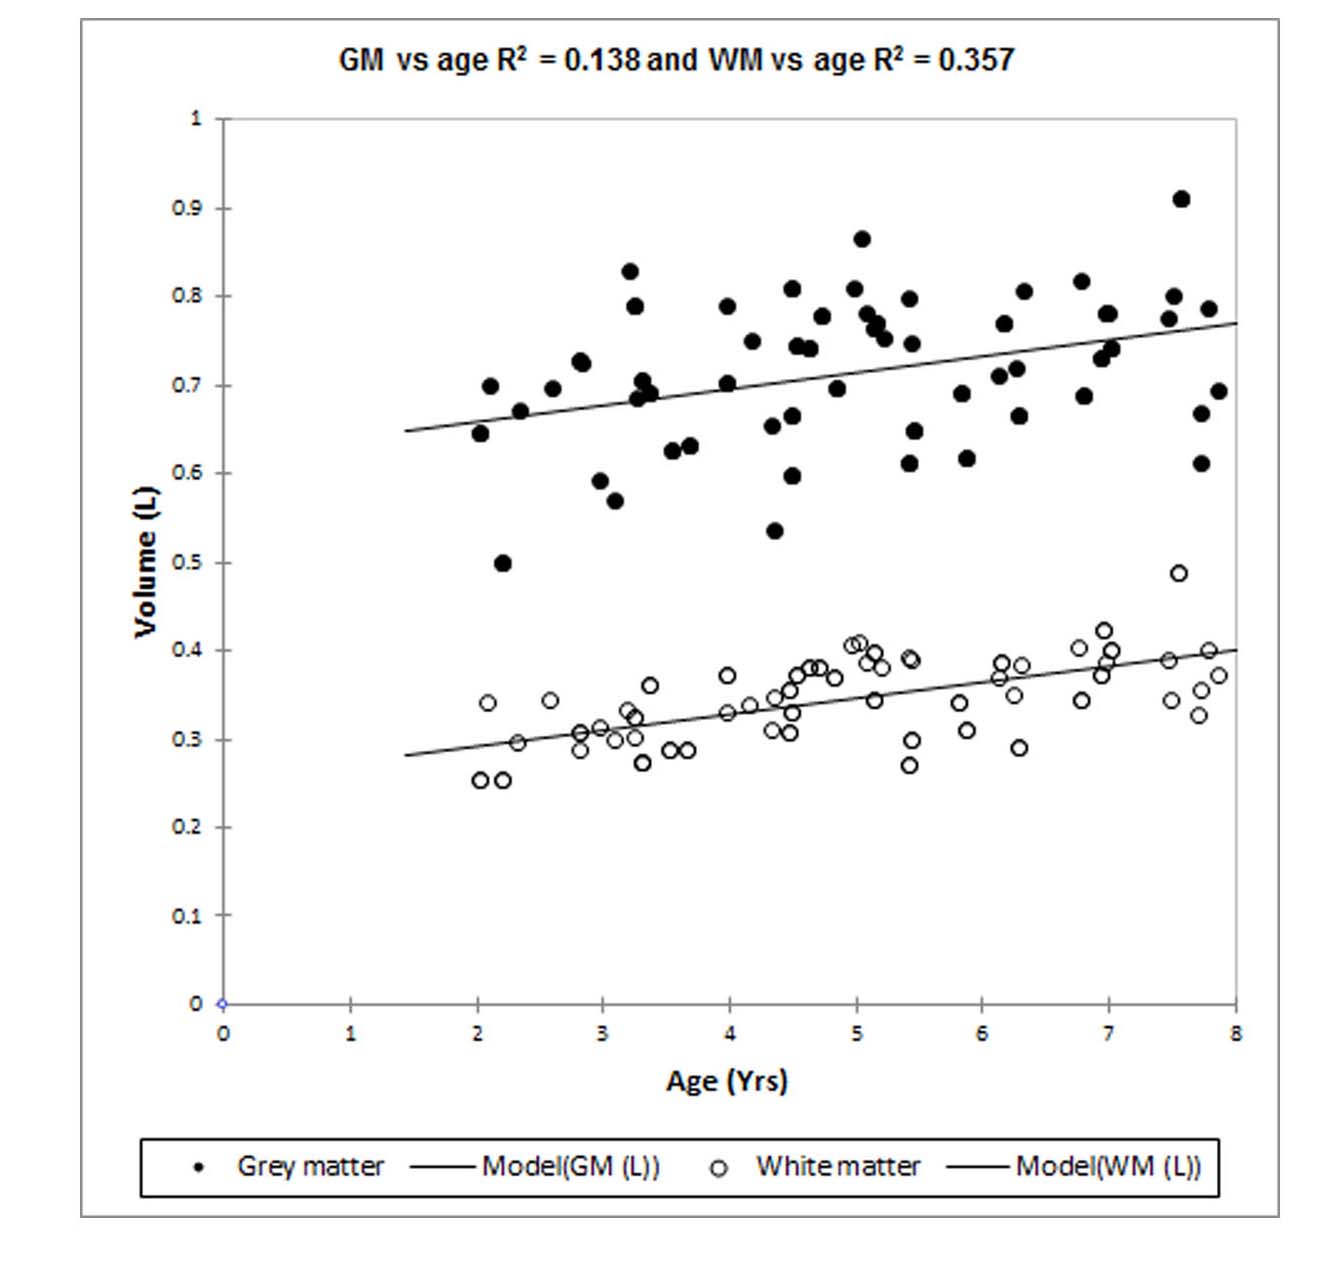
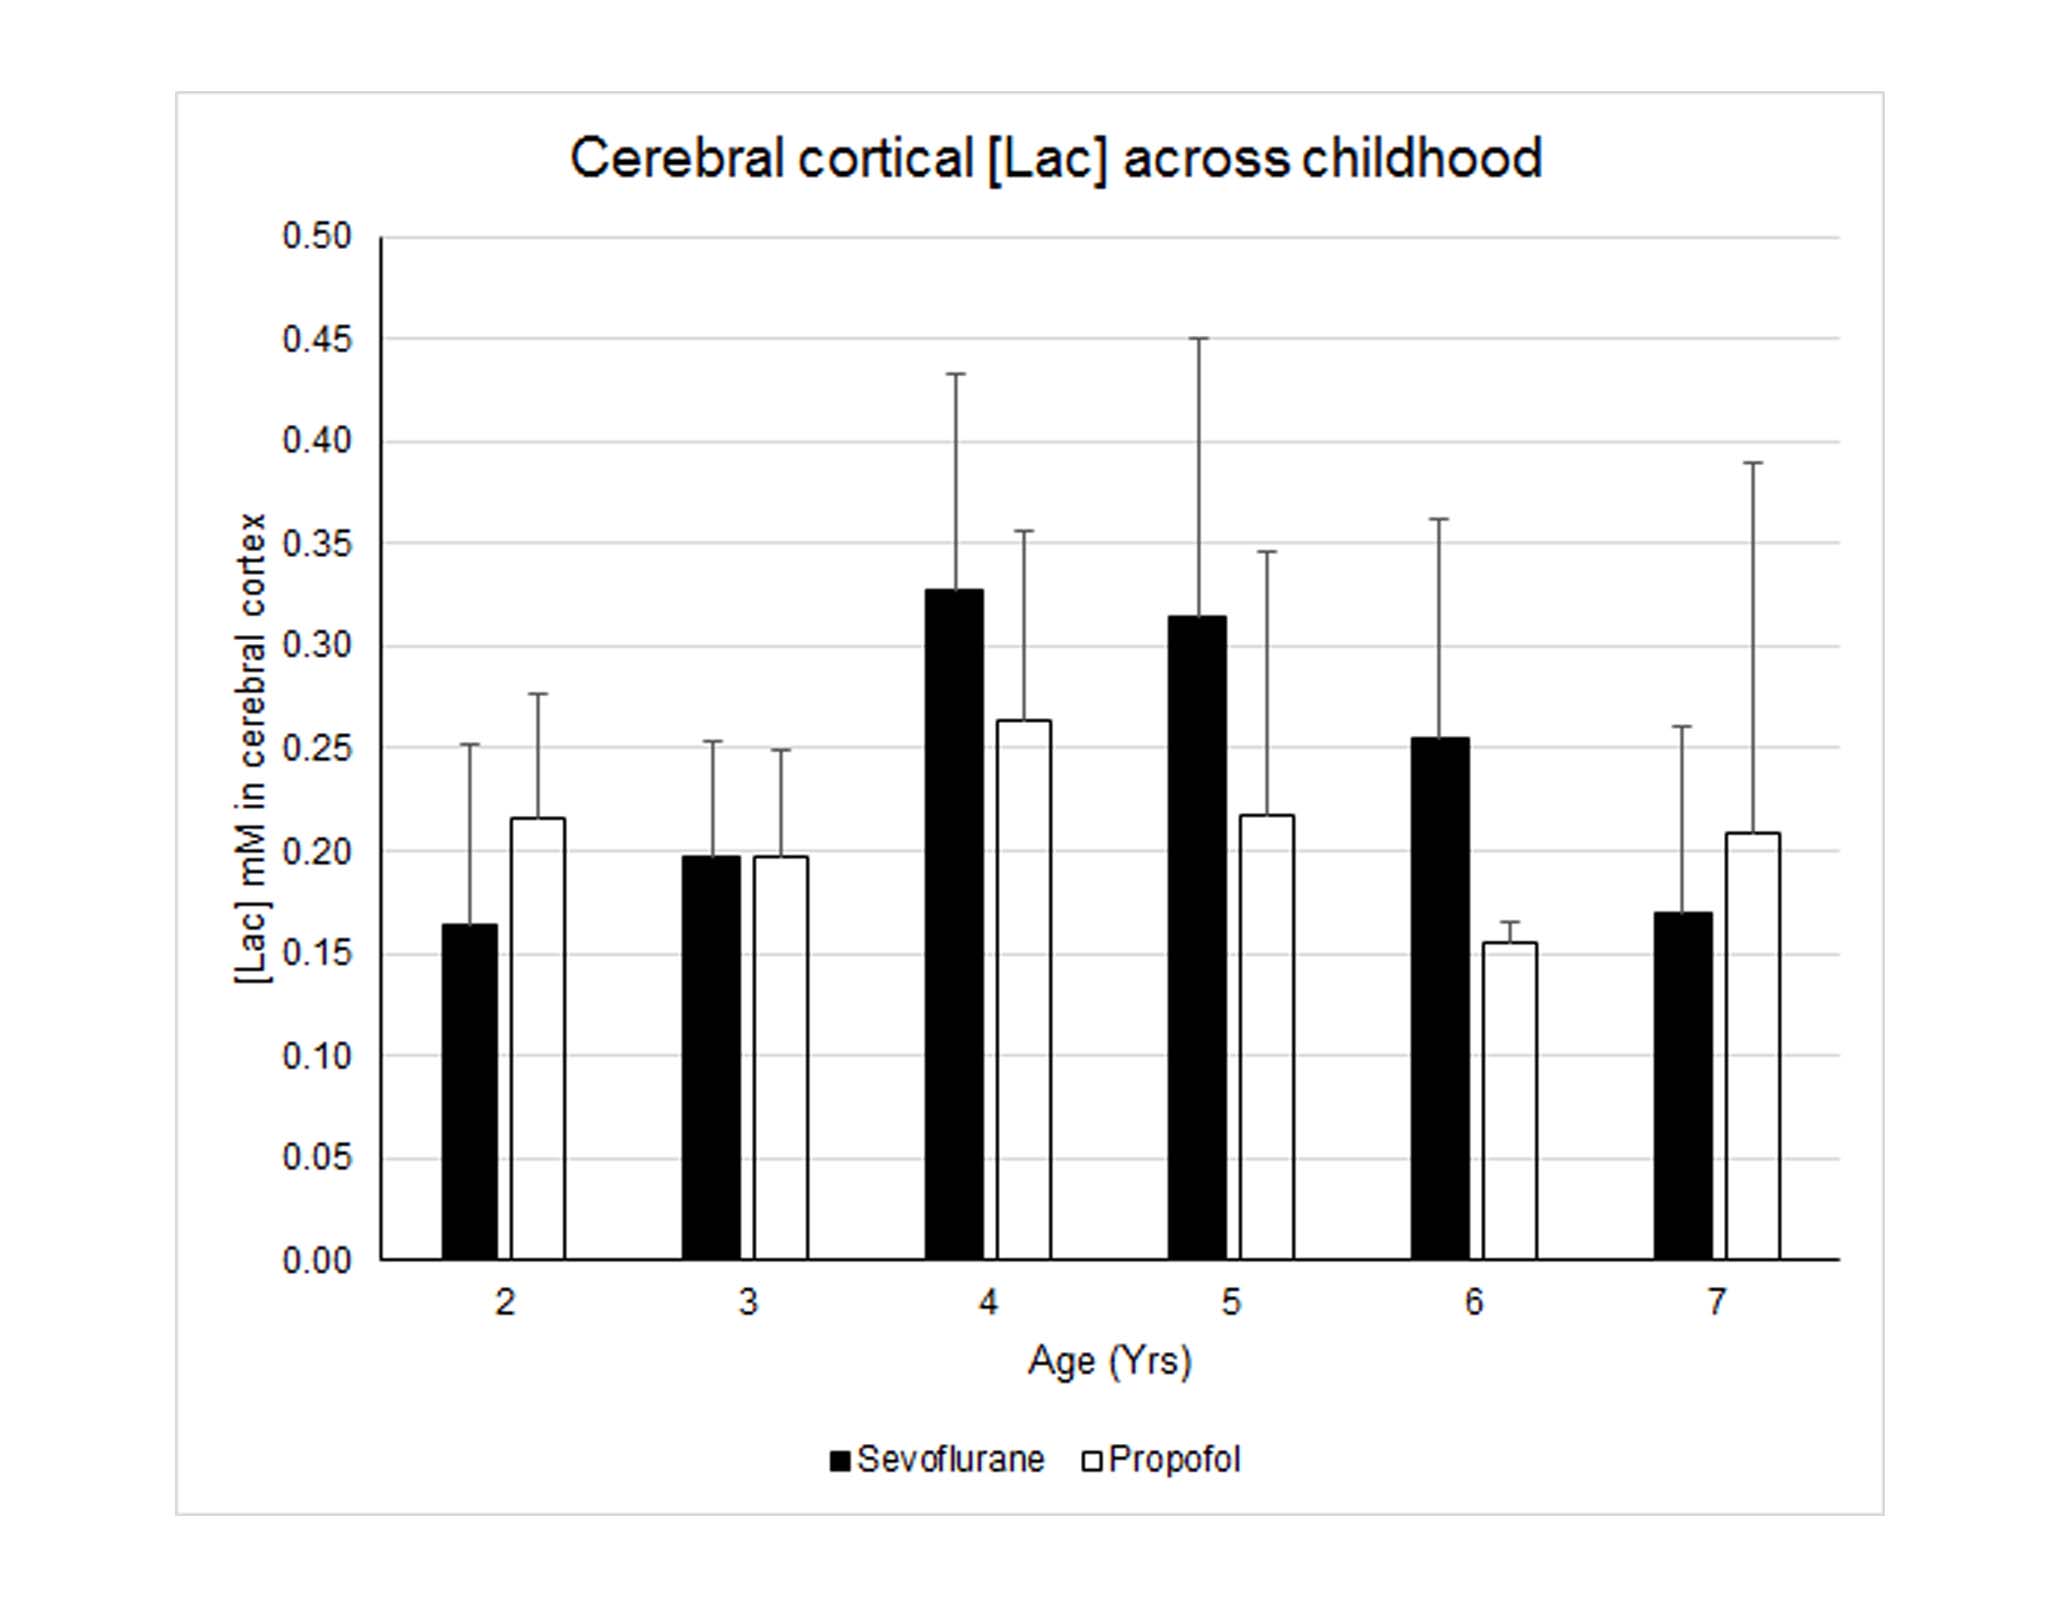
Nine 1HMR spectra were excluded from the analysis due to poor SNR and wild baseline fluctuations; leaving 78 for analysis. The average FWHM and SNR of the spectral NAA peaks was 0.028 ± 0.006 ppm and 22.3 ± 4.2, respectively. Fig. 1 shows typical cortical 1HMRS spectra from a 3- and a 7-yr old child. The Cramer–Rao lower bounds (CRLBs) calculated by LCModel for [tNAA] were 2-5 %SD. The CRLB’s for [Lac] were considerably higher; and [Lac] values associated with CRLB’s >350% were discarded; leaving 71 subjects with [Lac] for analysis. The high CRLB for [Lac] was due to its low concentration being on the order of the noise level in some subjects; however the %SD variation was at most 0.2 mM as estimated from the CRLB of the NAA peak. Volumetric changes in total gray and white matter were positively correlated with age (Fig. 2). Peak [Lac] occurred at ≈5 years of age (Fig. 3), was lower than predicted, and below the range for adult brain (0.5-0.7mM)5. The calculated CMRlac indicated a net influx of +0.04 μmol/g/min. In other words, the prediction of lactate release from the developing brain (CMRlac = -0.36 μmol/g/min) was not substantiated.Discussion
In contrast to reports of high AG1 predicting a high rate of lactate efflux from the young brain we found that brain [Lac] was low in children across childhood and in the range or lower than reported in adult subjects. Further, the [Lac] corresponded to a net lactate influx of +0.04 μmol/g/min. The ability to measure resting lactate by 1HMRS has been criticized based on its low levels and contamination from brain macromolecules and lipids from the skull. However, if all the resonance intensity at 1.3 ppm was due to lactate, its concentration would be at most ~1 mM (Fig. 1), which is still well below what would be needed to explain the reported oxygen-glucose mismatch. The oxygen-glucose index (OGI) is the metric from which AG is quantified and the theoretical OGI is 6.0. The inference is that glycolytic flux is increased (and OGI decreased) in the developing brain but the downstream fate of the glucose carbon is not established. For example, an alternate possibility to explain the elevated AG is the pentose phosphate pathway. Furthermore, OGI will exceed 6 if supplemental substrates (β-hydroxybutyrate, lactate) are oxidized but not measured and not included in the OGI calculation with glucose.Interpretation
Accumulation of [Lac] and calculated efflux of lactate from brain do not explain AG. However, the value for the lumped constant for [18F]fluorodeoxyglucose has a high impact on calculated CMRglc. Use of updated values for the lumped constant alters or eliminates the oxygen-glucose mismatch in developing brain and will be presented.Acknowledgements
DLR - 1- R01NS087568A, R01NS100106; HB - R21HD080573; FH - R01MH067528, P30NS052519References
- Goyal MS, Hawrylycz M, Miller JA, et al. Aerobic glycolysis in the human brain is associated with development and neotenous gene expression. Cell Metab. 2014;19(1):49-57.
- Chugani HT, Phelps ME, Mazziotta JC. Positron emission tomography study of human brain functional development. Ann Neurol. 1987;22(4):487-97.
- Jacob Z, Li H, Makaryus R, et al. Metabolomic profiling of children's brains undergoing general anesthesia with sevoflurane and propofol. Anesthesiology. 2012;117(5):1062-71.
- Boumezbeur F, Petersen KF, Cline GW, et al. The contribution of blood lactate to brain energy metabolism in humans measured by dynamic 13C nuclear magnetic resonance spectroscopy. J Neurosci. 2010;30(42):13983-91.
- Prichard J, Rothman D, Novotny E, et al. Lactate rise detected by 1H NMR in human visual cortex during physiologic stimulation. Proc Natl Acad Sci U S A. 1991;88(13):5829-31.
Figures