5426
Assessment of myelination in developing brains by using the inhomogeneous magnetization transfer MRI1Department of Radiology, the First Affiliated Hospital, Xi’an Jiaotong University, Xi’an, China, 2Department of Biomedical Engineering, the Key Laboratory of Biomedical Information Engineering of the Ministry of Education, School of Life Science and Technology, Xi’an Jiaotong University, Xi’an, China, 3MR Research China, GE Healthcare, Beijing, China
Synopsis
In vivo assessment of myelination is critical for understanding the typical and pathological brain development. Inhomogeneous magnetization transfer (ihMT) has been proposed recently and may be useful to quantify myelin contents. This study tried to evaluate performances of magnetization transfer ratio (MTR) and ihMT ratio (ihMTR) in assessing the myelination of toddler and adolescent brains. The ihMTR maps hold larger image contrasts than MTR maps. Moreover, ihMTR demonstrates larger relative changes during the period from the toddler to adolescent. Results in this study suggested that ihMTR was specific for characterizing white matter and sensitive to myelination during the brain development.
INTRODUCTION
Myelination in brain white matter is a long lasting process from the trimester of pregnancy until late adolescence 1. The enhancement of myelin sheath forms the basis of the rapid neural transmission along axons 2. Myelination is therefore a condition for the development of brain functions 3. In vivo assessment of myelination is critical for understanding the typical and pathological brain development 4. The magnetization transfer (MT) contrast has been found to be related with the extent of myelin damages 5. However, the specificity of MT is limited because of its sensitivity to many factors other than myelin 6. Inhomogeneous MT (ihMT) has been proposed recently and holds the potential ability to quantify myelin contents 7. This study tried to evaluate the performances of MT and ihMT in the assessment of myelination in developing brains.METHODS
This study was approved by the local Institutional Review Board. The MRI datasets used in this study were acquired from one toddler (gender: male; age: 19 months; weight: 12 kg) and one adolescent (gender: male; age: 16 years; weight: 76 kg). Parents of the subjects were informed about the goal and risks involved in the MRI. Written informed consents were obtained. Micro earplugs were placed bilaterally in the external acoustic meatuses of the subjects to protect their hearing. The subjects’ heads were immobilized by molded foam.
The fast spin-echo T2WI, and modified gradient echo ihMT sequences were performed on a 3T scanner (Discovery 750w; GE Healthcare, Milwaukee, Wisconsin) with a 24-channel head coil. The parameters for T2WI were as follows: TR/TE = 4200/100 ms; thickness = 4 mm; FOV = 240 × 240 mm2; acquisition matrix: 352 × 352. The parameters for ihMT were as follows: TR/TE = 13/3 ms; thickness = 5 mm; FOV = 240 × 240 mm2; acquisition matrix: 128 × 128; phases per location: 26. MT ratio (MTR) and ihMT ratio (ihMTR) were derived from the ihMT datasets.
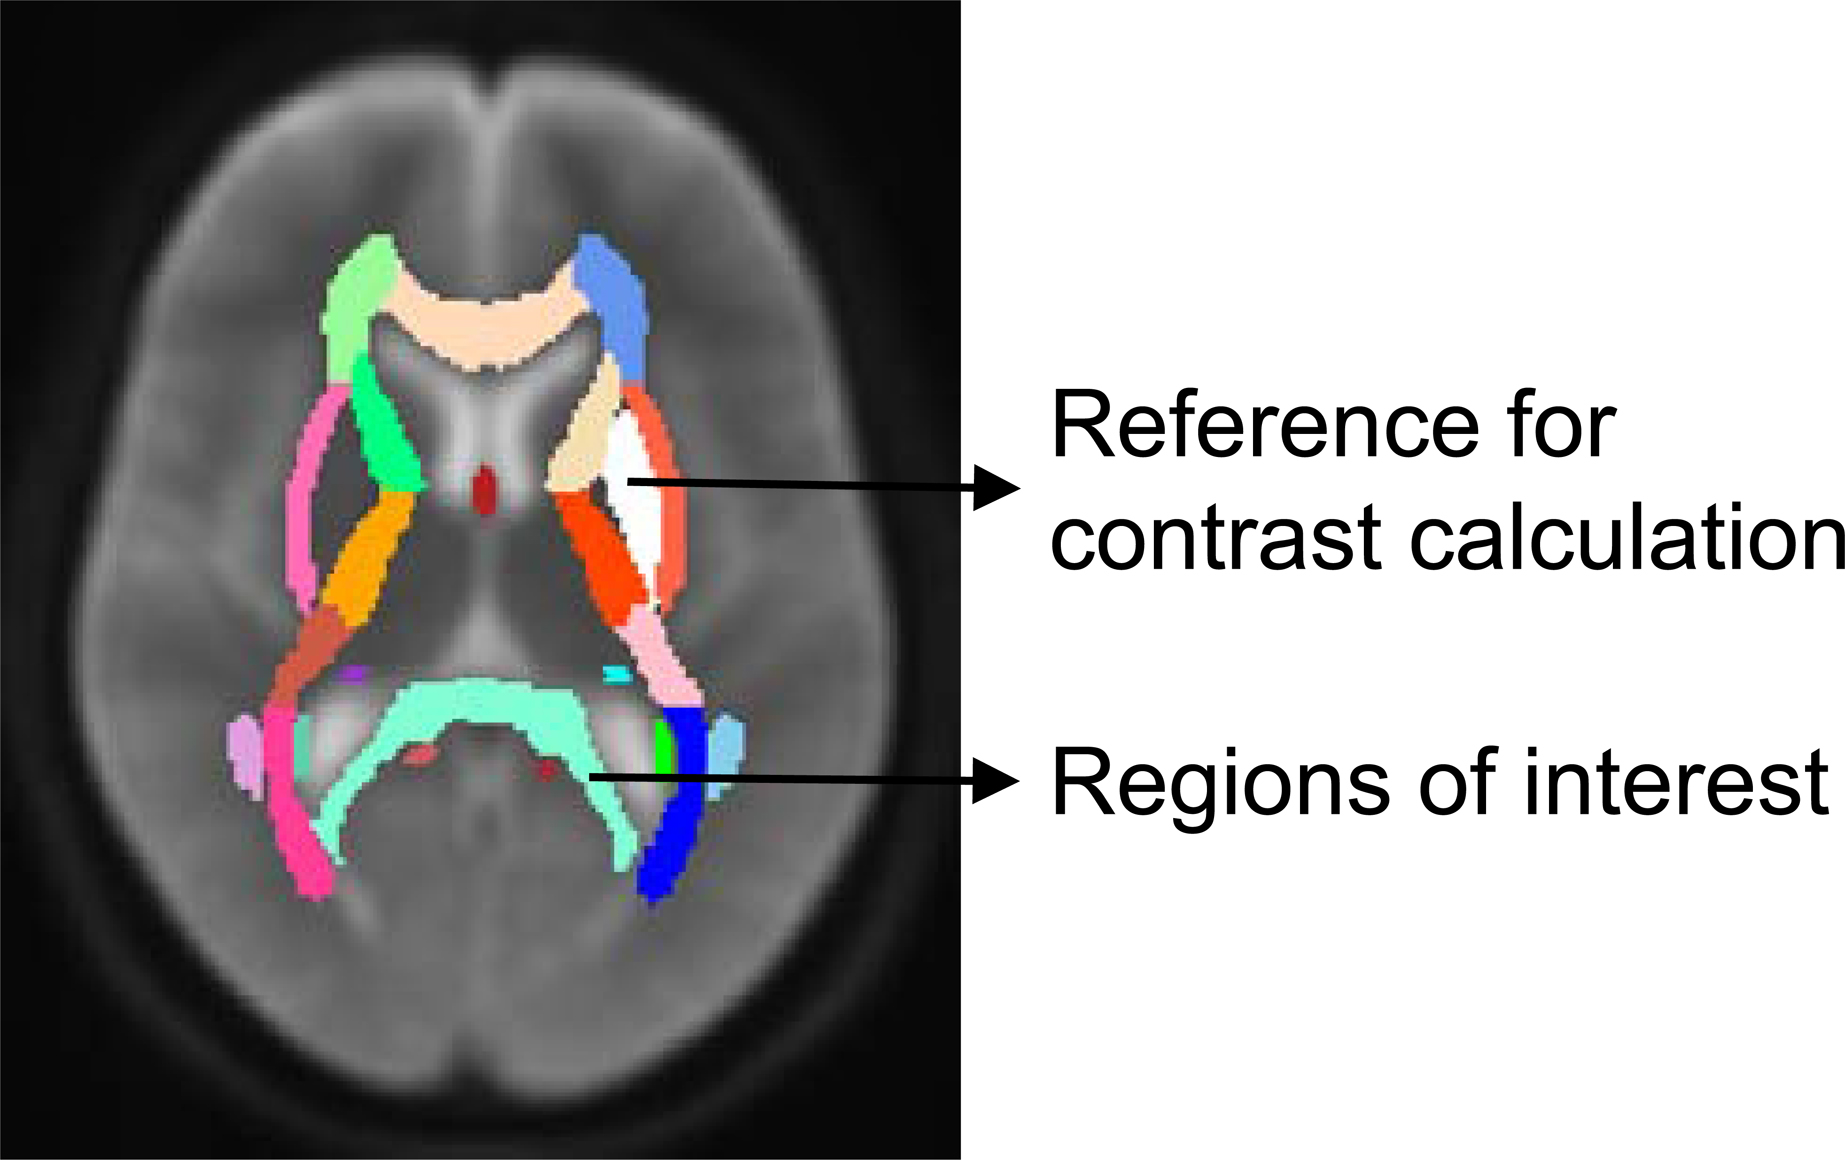
The T2WI images of the toddler and adolescent were normalized to the template in FSL (fsl.fmrib.ox.ac.uk) firstly. Then, brain atlases in the template space were transformed back to individual subjects by using the inverse of the transformation obtained from the previous step. Finally, genu of corpus callosum (GCC), body of corpus callosum (BCC), splenium of corpus callosum (SCC), anterior limb of internal capsule (ALIC), posterior limb of internal capsule (PLIC), retrolenticular part of internal capsule (RLIC), anterior corona radiata (ACR), superior corona radiata (SCR), posterior corona radiata (PCR), posterior thalamic radiation (PTR), external capsule (EC), superior longitudinal fasciculus (SLF), superior fronto-occipital fasciculus (SFO) were selected as regions of interest (as shown in Figure 1). Putamen was selected as the reference for the calculation of the image contrast. The image contrasts were calculated for each regions of interest. Differences of the image contrast and metrics values were tested by using the Wilcoxon Signed Rank Test on SPSS (version 13.0). Tests were considered statistically significant at P<0.05.
RESULTS AND DISCUSSION
In this study, we compared the image contrast and the sensitivity to brain development between MTR and ihMTR.
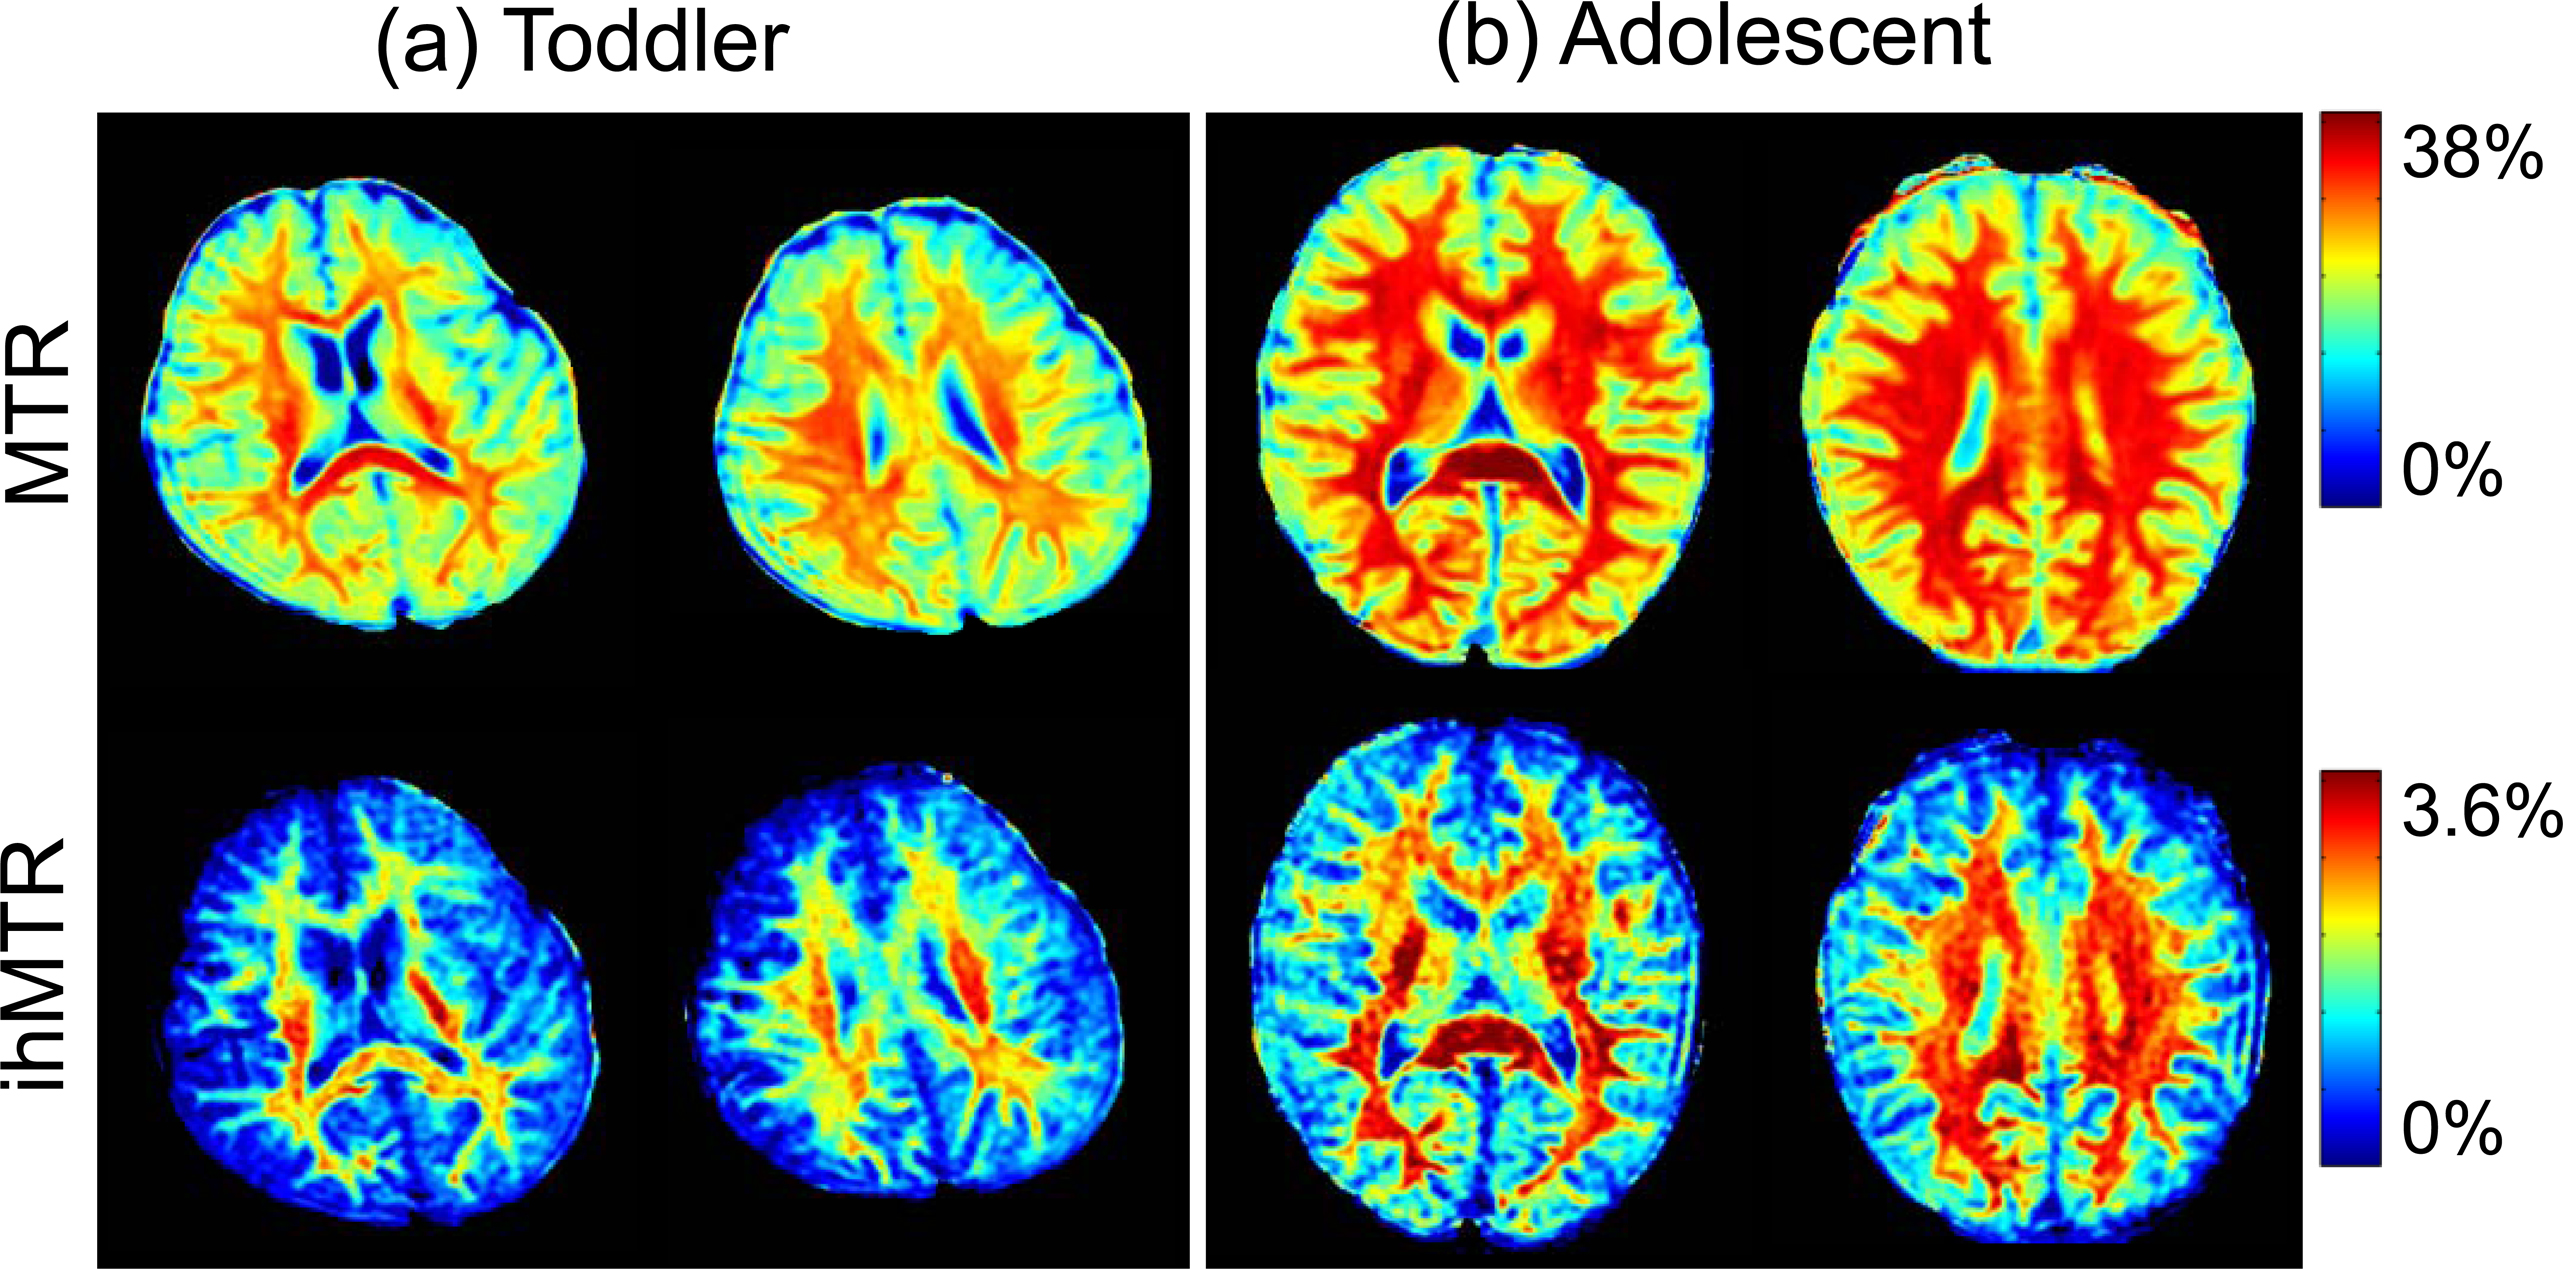
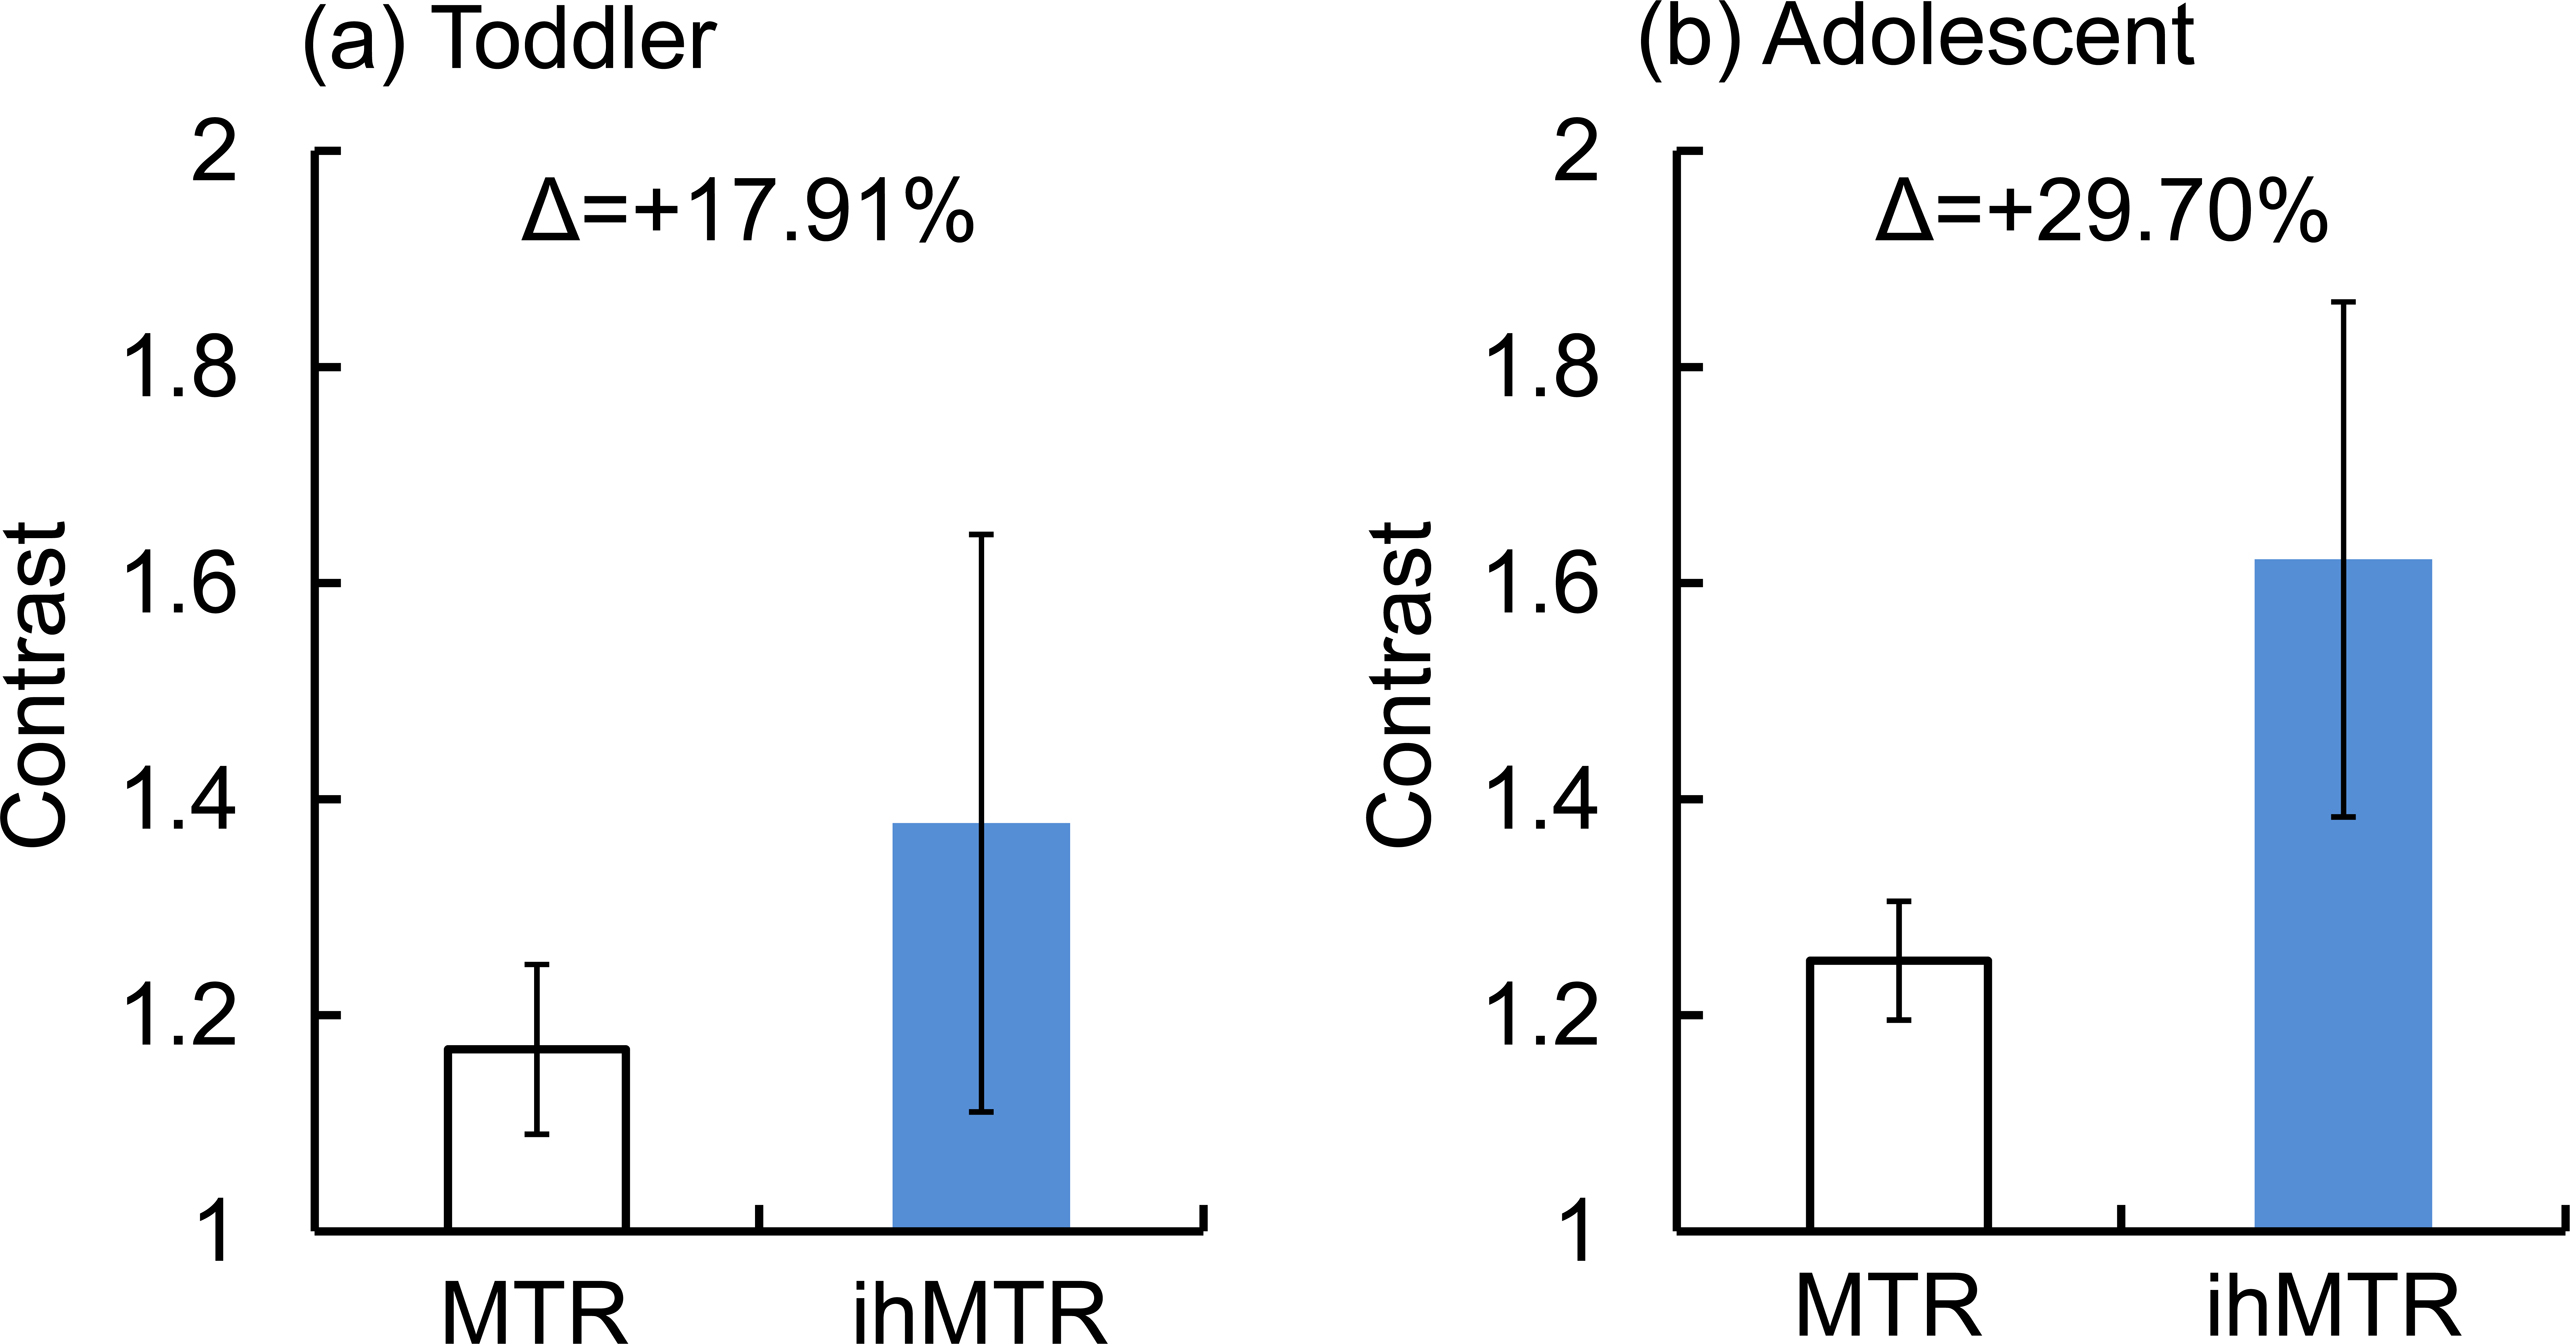
As shown in Figure 2, hyperintensity can be found in white matter areas in both MTR and ihMTR maps. However, it is difficult to differentiate different myelination degrees across white matter regions on MTR maps. MT signal can be influenced by many kinds of macromolecular contents, which may be found in gray matter, as well as white matter. As comparisons, ihMT is more specific to myelin due to the inhomogeneous spectrum of the multiple-layered packed structure 8. Therefore, ihMTR can overcome the limitation of MTR to demonstrate larger image contrasts, especially in the toddler brain (as shown in Figure 2 and 3).
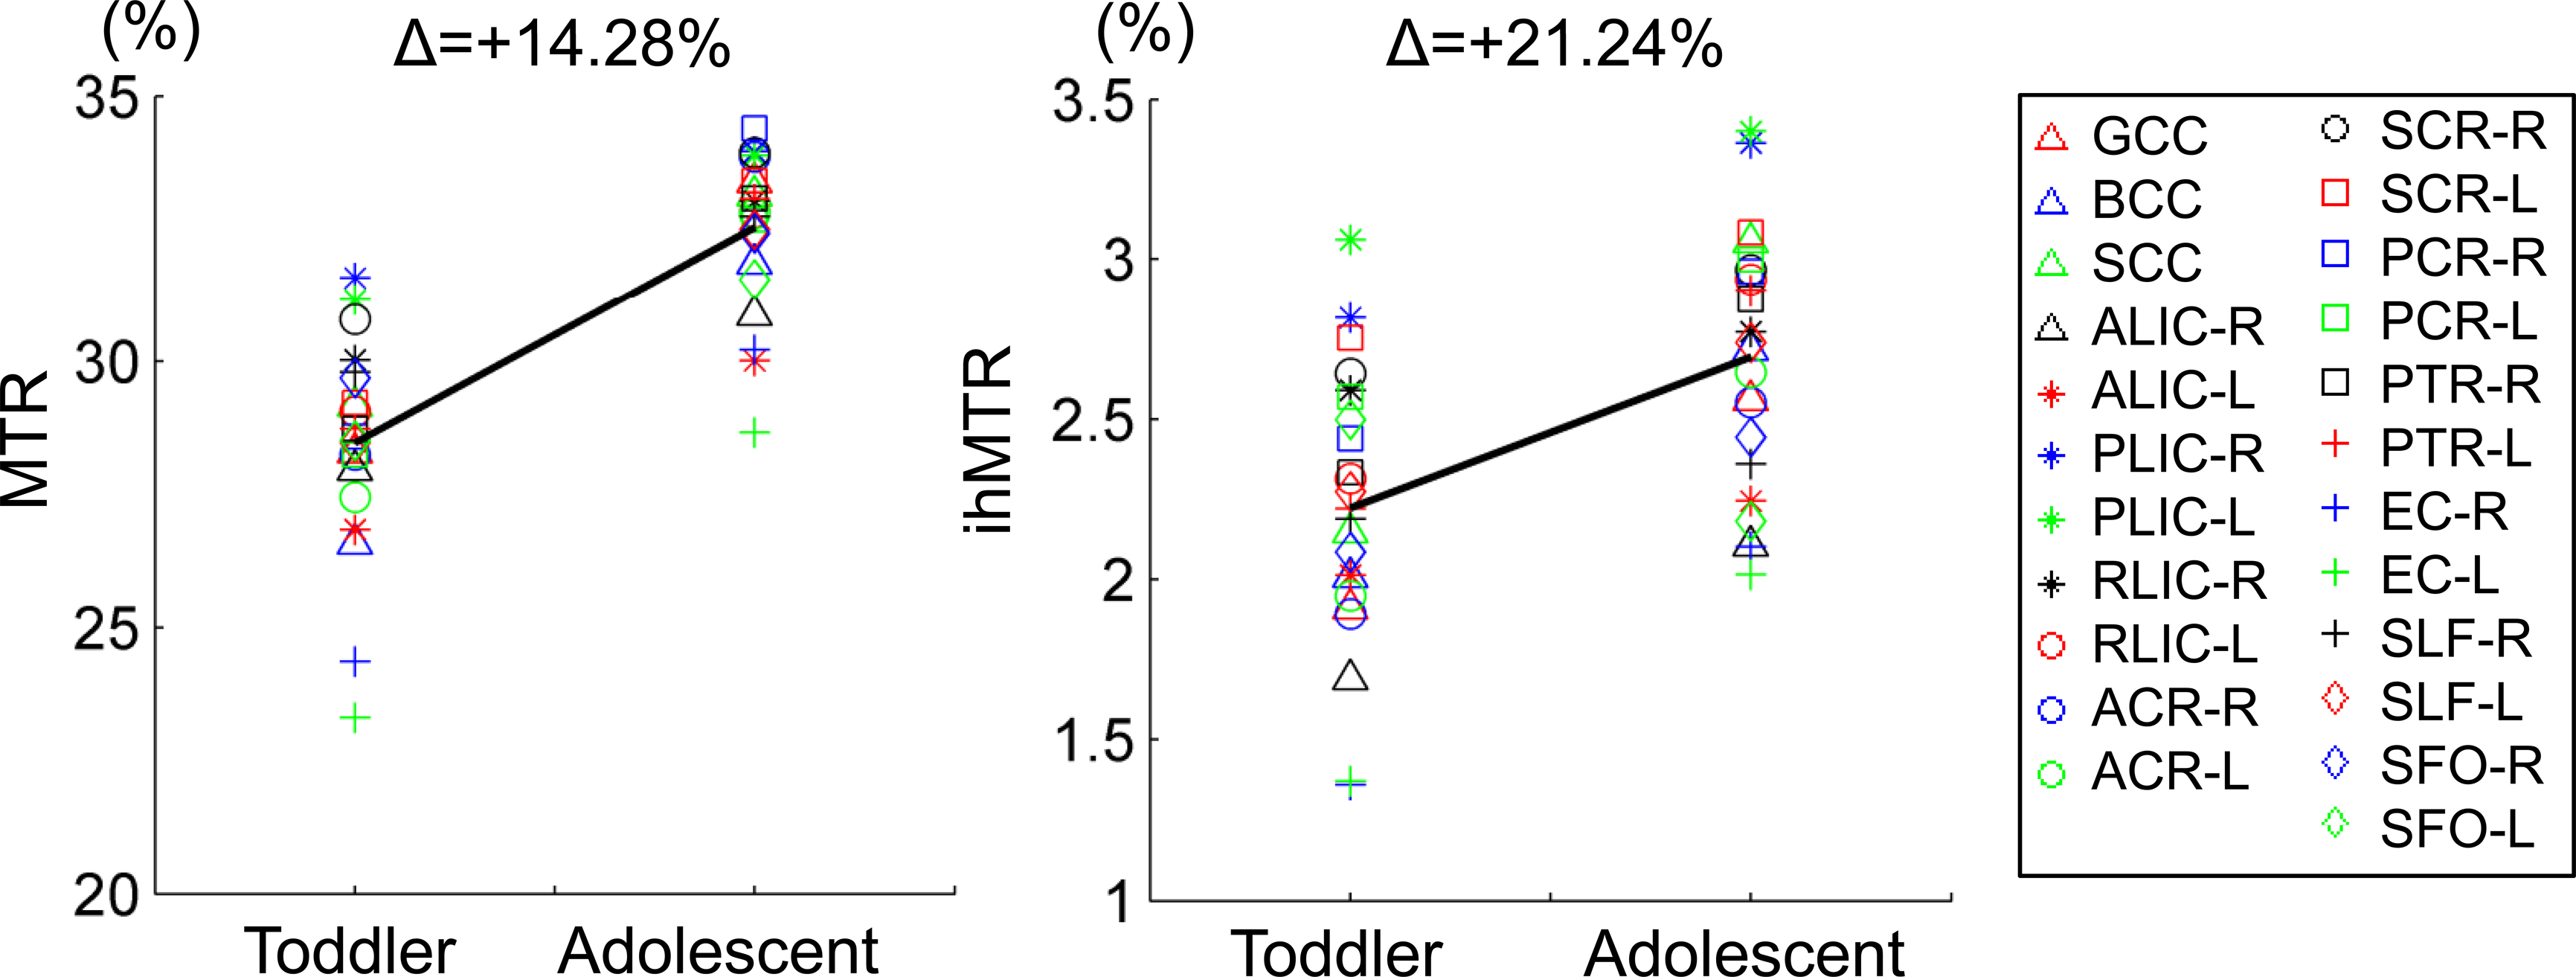
The ihMTR values in PLIC, PTR, and SCC are higher than those in other regions (as shown in the ihMTR maps of the toddler brain in Figure 2). EC held the lowest ihMTR value among the regions of interest (as shown in Figure 4). This is coincident with the myelination progression sequence 9: PLIC starts the myelination during prenatal period. Then corpus callosum, acoustic and optic radiations myelinate progressively after birth. EC starts the myelination around 4 months. Moreover, ihMTR demonstrates larger relative changes during the period from the toddler to adolescent (as shown in Figure 4). These results suggest that ihMTR is feasible to reveal myelination degrees across white matter regions in different developmental periods.
CONCLUSION
The ihMTR was specific for characterizing white matter and sensitive to myelination during the brain development.Acknowledgements
The authors thank Xiaocheng Wei, MEng (MR Research China, GE Healthcare), for the technical assistance. This study was supported by the National Key Research and Development Program of China (2016YFC0100300), National Natural Science Foundation of China (No. 81471631, 81771810 and 51706178), the 2011 New Century Excellent Talent Support Plan of the Ministry of Education, China (NCET-11-0438) and the Clinical Research Award of the First Affiliated Hospital of Xi’an Jiaotong University (No. XJTU1AF-CRF-2015-004).References
1. Dubois J, Dehaene-Lambertz G, Kulikova S, et al. The early development of brain white matter: a review of imaging studies in fetuses, newborns and infants. Neuroscience. 2014;276:48-71.
2. Paus T, Zijdenbos A, Worsley K, et al. Structural maturation of neural pathways in children and adolescents: in vivo study. Science. 1999;283:1908-1911.
3. Paus T. Growth of white matter in the adolescent brain: myelin or axon? Brain and Cognition. 2010;72:26-35.
4. Kulikova S, Hertzpannier L, Dehaenelambertz G, et al. Multi-parametric evaluation of the white matter maturation. Brain Structure & Function. 2015;220:3657-3672.
5. Ropele S, Fazekas F. Magnetization transfer MR imaging in multiple sclerosis. Neuroimaging Clinics of North America. 2009;19:27-36.
6. Varma G, Girard OM, Prevost VH, et al. In vivo measurement of a new source of contrast, the dipolar relaxation time, T1D , using a modified inhomogeneous magnetization transfer (ihMT) sequence. Magnetic Resonance in Medicine. 2016;78:1362-1372.
7. Varma G, Duhamel G, De Bazelaire C, Alsop DC. Magnetization transfer from inhomogeneously broadened lines: A potential marker for myelin. Magnetic Resonance in Medicine. 2015;73:614-622.
8. Girard OM, Prevost VH, Varma G, et al. Magnetization transfer from inhomogeneously broadened lines (ihMT): Experimental optimization of saturation parameters for human brain imaging at 1.5 Tesla. Magnetic Resonance in Medicine. 2015;73:2111-2121.
9. Dubois J, Dehaene-Lambertz G, Perrin M, et al. Asynchrony of the early maturation of white matter bundles in healthy infants: quantitative landmarks revealed noninvasively by diffusion tensor imaging. Human Brain Mapping. 2008;29:14-27.
Figures