5421
Quantitative 1H Single Voxel Spectroscopy In Metachromatic Leukodystrophy Patients Treated With Haematopoietic Stem Cell Gene Therapy: Preliminary Results1Nuclear Medicine Dept., IRCCS San Raffaele Scientific Institute, Milan, Italy, 2Neuroradiology Unit and CERMAC, IRCCS San Raffaele Scientific Institute, Milan, Italy, 3San Raffaele Telethon Institute for Gene Therapy (SR-TIGET), IRCCS San Raffaele Scientific Institute, Milan, Italy, 4Unit of Pediatric Immunohematology and BMT Program, IRCCS San Raffaele Scientific Institute, Milan, Italy, 5Neurology Dept., IRCCS San Raffaele Scientific Institute, Milan, Italy, 6Neuroradiology Unit and CERMAC, Vita Salute San Raffaele University and IRCCS San Raffaele Scientific Institute, Milan, Italy, 7Vita Salute San Raffaele University, Milan, Italy
Synopsis
The efficacy of Haematopoietic Stem Cell-Gene Therapy for Metachromatic Leukodystrophy is under evaluation. CNS damage is currently rated by means of visual MR severity scores. The aim of this study was to investigate whether quantitative spectroscopy measurements correlate with MR severity scores. This preliminary analysis shows that both NAA/Cr and NAA/Cho ratios are associated with progression in total MR Severity Score, Atrophy and Demyelination Load. This suggests that MR spectroscopy could be useful to longitudinally and quantitatively evaluate the disease burden in MLD patients.
INTRODUCTION
Metachromatic Leukodystrophy (MLD) is a neurodegenerative lysosomal disease resulting from a deficiency of the arylsulfatase A (ARSA) enzyme and characterized by severe demyelination in central and peripheral nervous systems. At San Raffaele Telethon Institute for Gene Therapy, a phase I/II clinical trial of Haematopoietic Stem Cell-Gene Therapy (HSC-GT) for MLD using HSCs transduced with a lentiviral vector containing the human ARSA cDNA is ongoing [1]. Brain MR is a useful technique for monitoring the disease and an adapted version of the Loes scoring system [2] is an effective method used to score MRI studies in MLD. This method consists of visual rating of both demyelination and atrophy in multiple brain regions on structural MRI (T1w, T2w, FLAIR). Although the MR severity score has been valuable to track the progression of disease post therapy, it has limited sensitivity for subtle changes and requires well-trained expert raters. Brain metabolites, quantified with MR spectroscopy, have been proposed as more sensitive and earlier markers of disease progression [3].PURPOSE
The aim of this study was to investigate whether quantitative spectroscopy measurements correlate with MR severity scores and its constituents: atrophy and demyelination load.METHODS
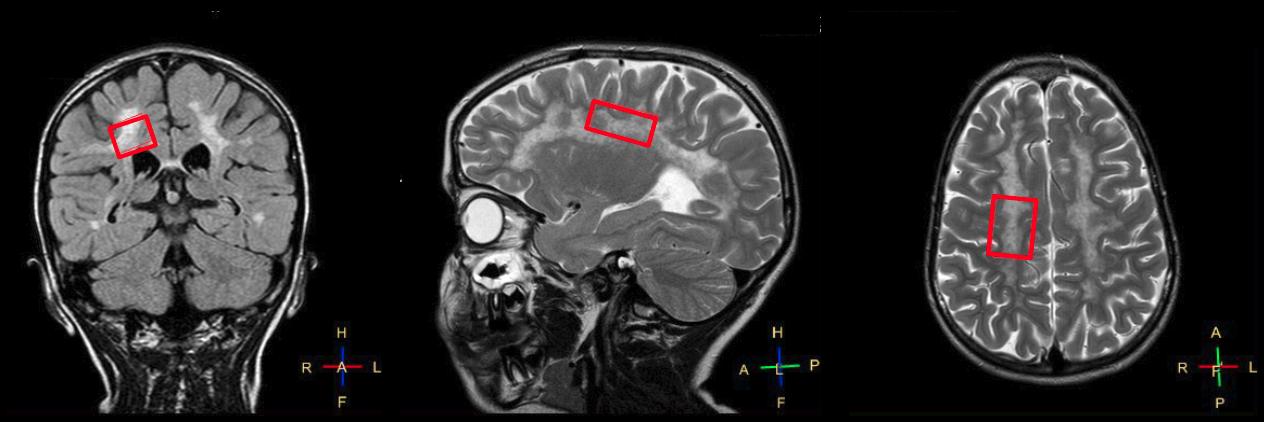
A group of 9 Early Juvenile MLD (EJ-MLD) patients, who were eligible for HSC-GT and who were followed up for two years or more, underwent brain MR examinations before and after HSC-GT (3, 6, 12, 18, 24, 30, 36 months). The patients were sedated during scans. Each session, on a 1.5 Tesla scanner, included T1w, T2w, FLAIR, DTI and Single Voxel (SV) MR spectroscopy sequences. For SV Spectroscopy, the voxel was placed in the white matter of the right centrum semiovale (Figure 1). The following acquisition parameters were used: TR/TE= 1800/35ms; 128 avg, 512 sampling points, voxel size: approximately 35x20x20mm3. Data were processed with jMRUI software [4], using HSVD [5] for quantification. NAA/Cr, NAA/Cho and Cho/Cr ratios were quantified. MR severity scores were measured as in Sessa et al. [2]. Statistics: Non-parametric Kendall’s tau rank correlation analysis was performed to assess the relationships between metabolite ratios (NAA/Cr, NAA/Cho and Cho/Cr) and 1) MR total severity score, and subscores related to 2) Demyelination load and 3) Atrophy. For each subject in the correlation analysis we included the available time points between 0 and 36 months.
RESULTS AND DISCUSSION
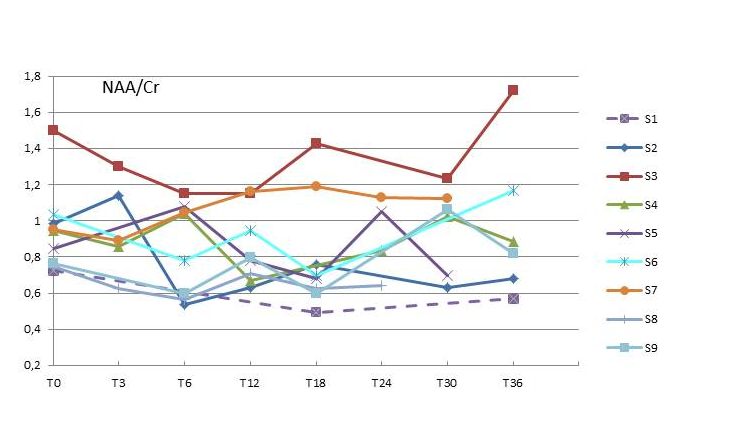
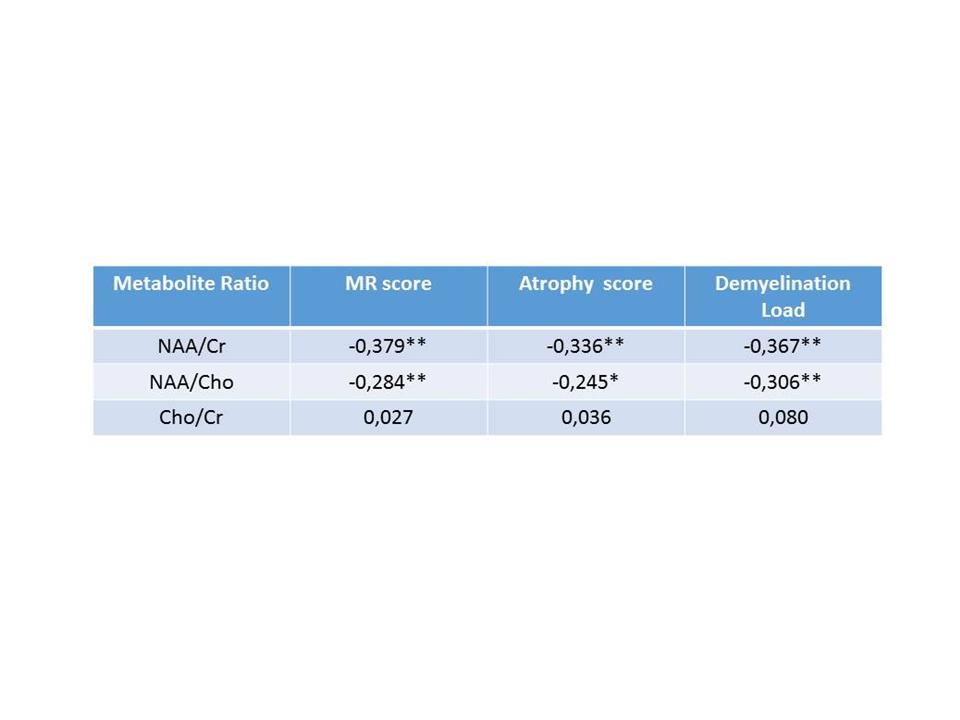
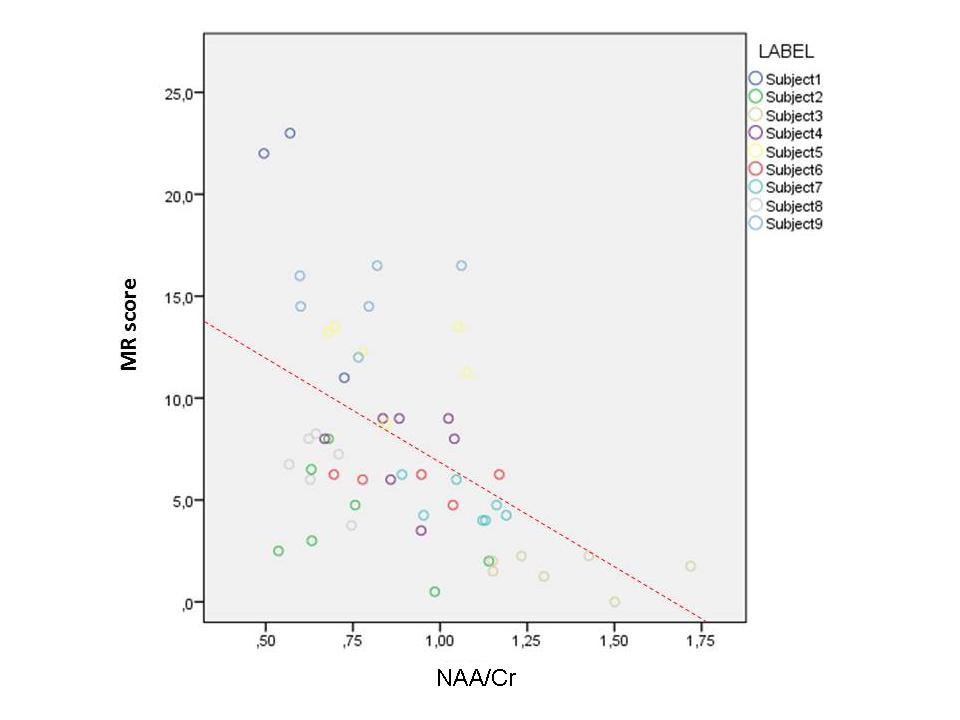
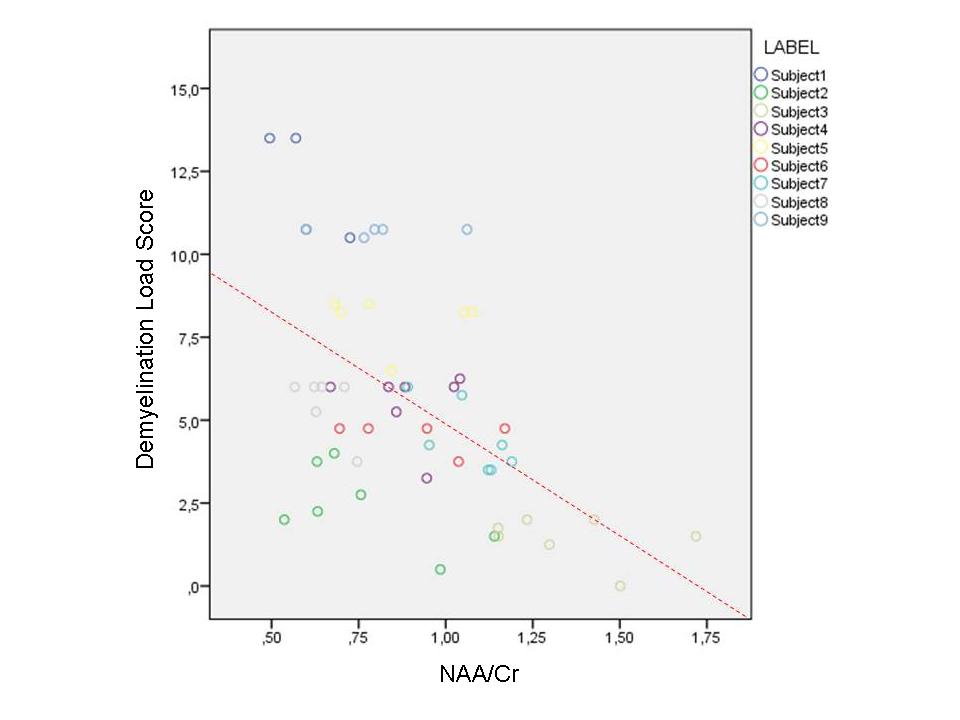
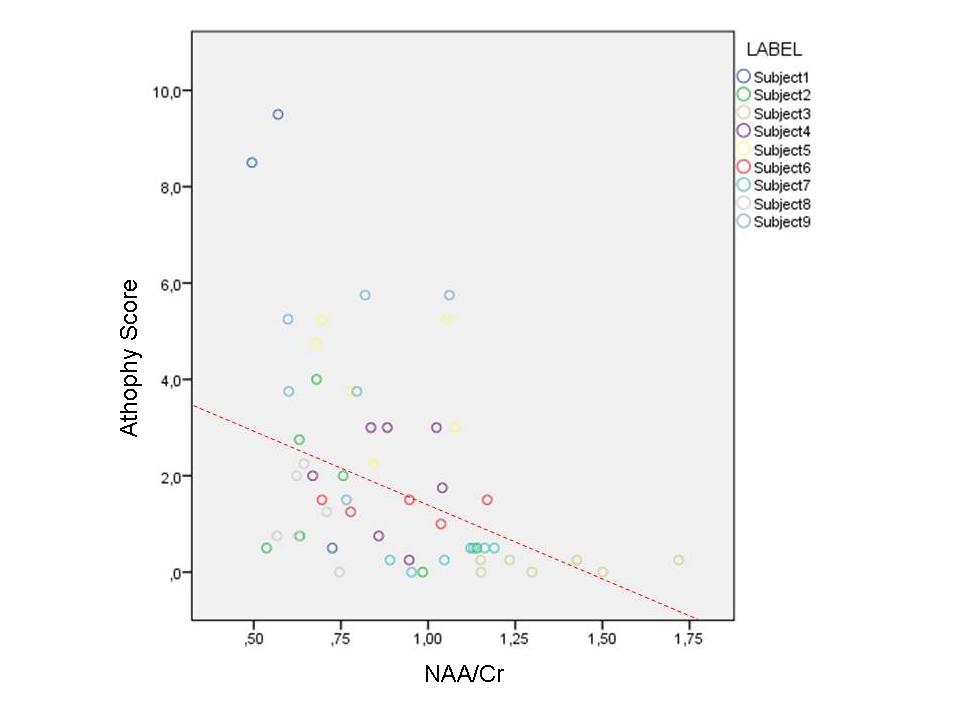
The mean age at the first scan was 68.7 months [range 19-139 months], 4 patients were female. Not all the patients had spectroscopy data of sufficient quality for all time points: 4 patients had 7 acquisitions, 3 had 6 acquisitions, 1 had 5 acquisitions and another 1 had 3 acquisitions. In figure 2 the plots of the NAA/Cr ratios over time is shown. In this preliminary analysis, both the NAA/Cr and NAA/Cho ratio are significantly associated with total MR Severity Score, Atrophy Score and Demyelination Load Score (see Table1). Figures 3, 4 and 5 show the associations between NAA/Cr ratio and MR total severity Score, Demyelination Load Score and Atrophy Score, respectively, observed on the available time-points between 0 and 36 months.CONCLUSIONS
As an initial step, the relationships between NAA/Cr, NAA/Cho and Cho/Cr metabolite ratios and brain MR severity score were investigated. This preliminary analysis shows that both NAA ratios correlate with progression in MR severity score in MLD. This suggests MR spectroscopy could be useful to measure disease progression in MLD, but this will need to be confirmed in further analyses against clinical outcome measures. Analysis of MR severity scores post-treatment in relation to metabolite ratios prior to treatment is ongoing.
Acknowledgements
This study was funded by Telethon Foundation and GlaxoSmithKline (GSK).
The authors acknowledge support from Drs. Robert Janiczek and Marius de Groot of GlaxoSmithKline in interpretation of the MR data.
Finally,
we thank Alessandra Biffi for her seminal contribution as former PI
of the clinical trial.
References
[1] Sessa M et al, Lancet; 30;388(10043):476-87; 2016, doi: 10.1016/S0140-6736(16)30374-9.
[2] Sessa M et al, Clin Genet.;74(4):349-57; 2008 ; doi: 10.1111/j.1399-0004.2008.01058.
[3] van Rappard DF et al, J Neurol Neurosurg Psychiatry; 0:1–7, 2017;. doi:10.1136.
[4] Stefan D et al, Measurement Science and Technology; 20:104035, 2009; doi:10.1088/0957-0233/20/10/104035.
[5]
Barkhuijsen H et al, Journal of Magnetic Resonance; 73: 553-557,1987.
Figures