5411
Texture analysis applied to MRI of nerves affected with chronic inflammatory demyelinating neuropathy.1Radiology, University of Pavia, Pavia, Italy, 2Neurology Department, C. Mondino National Neurological Institute, Pavia, Italy, 3Neuroradiological Department, C. Mondino National Neurological Institute, Pavia, Italy, 4Department of Brain and Behavioral Sciences, University of Pavia, Pavia, Italy
Synopsis
Introduction. Texture analysis was applied to MR images of peripheral nerves obtained with MR micro-neurography. Materials and Methods. Ankle tibial nerves were imaged at 3T in 10 patients affected with chronic inflammatory demyelinating neuropathy and 10 healthy subjects. Multiple subsets of textural features were compared, using different extraction methods and statistical analyses. The most discriminating features were selected and compared to the automatically extracted subsets. Results. Feature subset extracted from the whole pool of features performed better than the ones obtained by specific groups of features. Conclusion. Texture analysis may have a role in discriminating between pathologic and normal nerves.
INTRODUCTION
Nerves are highly ordered structures with a characteristic fascicular pattern that seem suitable for investigation with texture analysis (TA), a post-processing technique capable to quantifying the structural properties and the degree of order in a digital image. MR micro-neurography allows visualization of internal nerves components with high resolution (1). We applied texture analysis to MR images of peripheral nerves of patients affected with chronic inflammatory demyelinating neuropathy (CIDP) obtained with a micro-neurography technique. Our aim was to investigate the ability of texture analysis to quantify morphometric changes in nerves affected with CIDP.METHODS
This study was realized under approval of the local ethical committee and informed consents were obtained from all subjects. 10 symptomatic CIDP patients (5 males, mean age 63) and 10 healthy controls (7 males, mean age 60) were imaged with a 3T scanner (Discovery 750 GE-USA), using a 6-channels surface carotid coil at the ankle. The tibial nerve was imaged applying high resolution axial TSE T1 weighted sequences as previously described (2) (FOV 5cm, TR 625, TE 12, voxel size 0.10x0.12x2.0 mm). TA was computed using MaZda software(3). One operator manually drew the ROIs encompassing the tibial nerve on five images selected at random for each subject, for a total of 100 ROIs. All textural features available with the software (more than 250) were extracted including those derived from the histogram and absolute gradient, co-occurrence matrix (COM), run length matrix (RLM), autoregressive model (AR) and wavelet transform(4). Two reduction methods (Fisher coefficient, probability of classification error and average correlation coefficients POE-ACC) and three different statistical analyses (Principal component analysis (PCA), linear discriminant analysis (LDA), nonlinear discriminant analysis (NDA)) were used for comparisons of features between groups (all features, only COM, only RLM, only AR, only wavelet, combined histogram and gradient, combined COM and RLM). The best discriminating features were pooled into a new subset of features and compared with the previous subsets. Two classifiers (nearest neighbor 1-NN and artificial neural network ANN) were trained with 70 randomized samples and the remaining 30 were used for validation. Tests accuracies were evaluated using misclassification rates.RESULTS
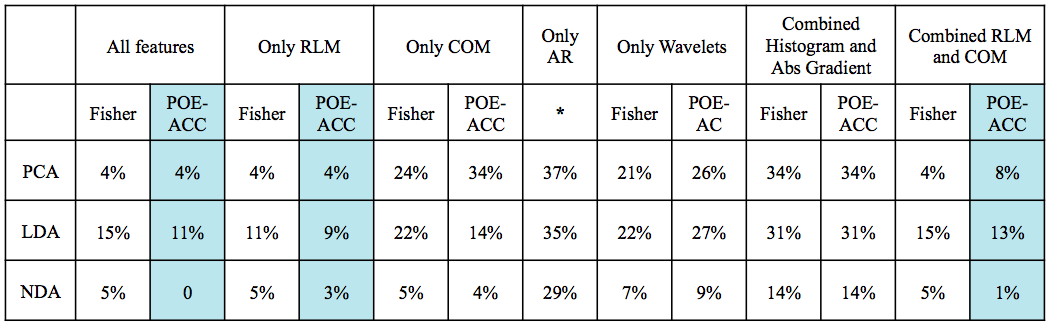
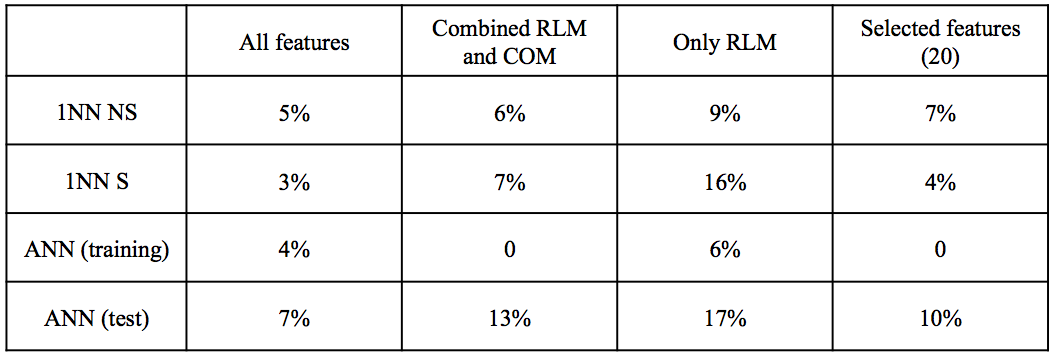
The subset of 10 features extracted from the “all features” dataset better discriminated CIDP from healthy control (error rate 0-11%), followed by the “combined RLM and COM” (1-13%) and “only RLM” (3-16%). The POE-ACC algorithm always outperformed the Fisher coefficients method. Fisher method extracted predominantly RLM derived features, whereas POE-ACC extracted features were more heterogeneous. Among the analyses the NDA was the more accurate and the only one capable of perfect separation of the two groups (see table 1). Lower performances were obtained with features subsets extracted from the groups “only COM”, “only histogram/absolute gradient” and “only wavelets” (error rate 7-34%). The two classifiers performed better with the subset “all features”, with rates of misclassification of 3-5% with the 1NN and 7% with the ANN. Two features derived from the RLM “run-length non uniformity” and “gray-level non-uniformity” were recurrently extracted in 9 subsets and three derived from the COM, “(5,-5) entropy”, “(0,3)difference variance” and “(1,-1) sum average” were represented in at least 2 subsets. These five features were selected for further classification and computed four times each (because each of them included four directions) for a total of 20 features. The selected subset of features had misclassification rates of 4-7% with the 1NN and 10% with the ANN classifiers.DISCUSSION
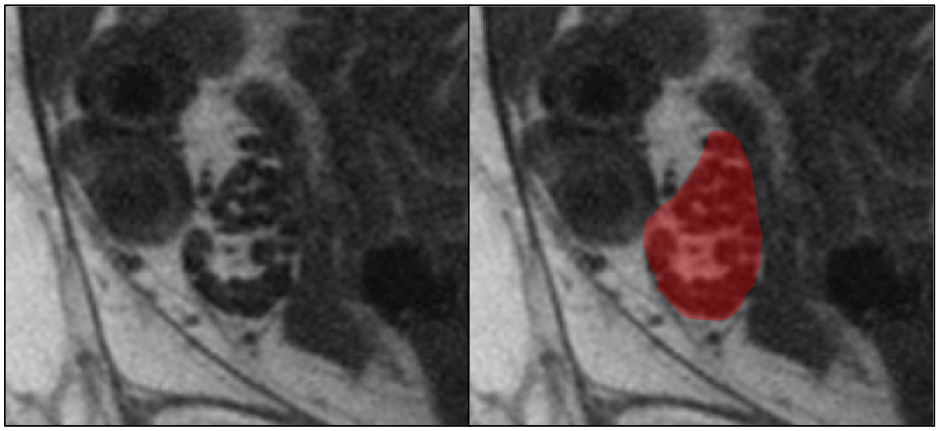
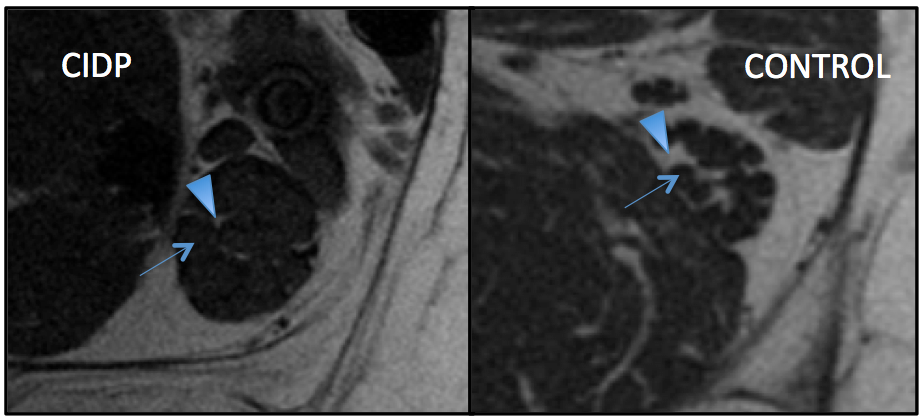
Texture analysis was able to discriminate between nerves of patients affected with symptomatic CIDP and nerves from healthy subjects with misclassification rates up to 0-11%. Among the different groups of features explored, the RLM derived RLNonUni and GLevNonUni were the most recurring features extracted with the different methods applied, followed by the COM derived entropy, difference variance and sum average. Although those features had great discrimination power taken individually, the subset of 10 features extracted from the “all features” dataset performed better than all the others. Moreover, increasing the number of features did not improve the results, even when limiting to the most significantly different ones. The performance of TA in this study may be in part explained with the significant visual abnormalities in some pathologic nerves (Figure 1). However, the ability of some analyses (NDA) to perfectly allocate all ROIs into the correct groups indicates that TA is capable to detect nerves structures variations not visually assessable.CONCLUSION
This preliminary study has demonstrated that texture analysis may have a role in distinguishing between nerves affected with CIDP and normal nerves. RLM derived features seem to have strong discriminating power.Acknowledgements
No acknowledgement found.References
1. Felisaz PF, Balducci F, Gitto S, et al. Nerve Fascicles and Epineurium Volume Segmentation of Peripheral Nerve Using Magnetic Resonance Micro-neurography. Acad Radiol.2016; http://www.ncbi.nlm.nih.gov/pubmed/27209266.
2. Felisaz PF, Chang EY, Carne I, et al. In Vivo MR Microneurography of the Tibial and Common Peroneal Nerves. Radiol Res Pr. 2014;2014:780964 http://www.ncbi.nlm.nih.gov/pubmed/25548670.
3. https://www.eletel.p.lodz.pl/merchant/mazda/order1_en.epl.
4. Castellano G, Bonilha L, Li LM, Cendes F. Texture analysis of medical images. Clin Radiol. 2004;
Figures