5409
Evaluation of a new semi-automatic delineation method for quantitative analysis of tumors: application to head and neck squamous cell carcinomaKanae Moriyama1, Hiroyuki Sugimori2, Noriyuki Fujima3, and Toru Yamamoto2
1Graduate school of Health Science, Hokkaido University, Sapporo, Japan, 2Faculty of Health Science, Hokkaido University, Sapporo, Japan, 3Department of Diagnostic and Interventional Radiology, Hokkaido University Hospital, Sapporo, Japan
Synopsis
Objective determination of tumor region of interest (ROI) on MR images is expected for quantitative analysis of tumors. We developed a semi-automatic method of ROI delineation. We applied this method to head and neck squamous cell carcinoma and evaluated the matching of the ROI delineation by our method and an experienced radiologist. The ADC values were compared for different ROI delineation methods. Averagely, 80% of the area of the ROI matched and the difference of the ADC value was within 2% (sd), showing that our new method of tumor delineation can be used to analyze the tumor characteristics quantitatively.
Purpose
Values such as apparent diffusion coefficient (ADC) have been studied to characterize tumors. In those studies, delineation of tumor region on radiological images is crucial and experienced radiologists manually delineate the tumor regions. However, because degree of the experience could affect the delineation, objective determination of tumor region of interest (ROI) is expected for quantitative analysis of tumors. We developed a new semi-automatic method to delineate tumors on MR images. This method requires simple recognition of a high signal intensity pixel in a tumor region. We applied this method to head and neck squamous cell carcinoma (HNSCC) the delineation of which normally needs the professional knowledge of radiologists, and evaluated the matching of the semi-automatically determined ROI and the ROI delineated by an experienced radiologist.Materials and Methods
We used Gd contrast-enhanced T1-weighted images of 6 patients with HNSCC (Sinonasal tumors) for ROI delineation. Firstly, the edge line of a tumor was drawn brokenly by using the canny edge detection algorism that contiguously depicts pixels where spatial signal change is large. Then to connect the broken edge lines and make areas surrounded by the edge line, the ends of edge lines were grown by selecting an adjacent pixel having the closest signal intensity. In order to choose the tumor areas from the closed areas determined by the edge line, seed points representing tumor were placed manually by comparing contralateral normal tissue and the closed areas including the seed points were depicted as the region of tumors. If necessary, additional seed points were placed by visual inspection until the tumor region is sufficiently delineated. In addition to aforementioned semi-automatic tumor ROI delineation, an experienced radiologist drew ROIs surrounding each tumor including necrosis.1 The necrotic areas in tumor ROIs delineated by both methods were removed by using a threshold value around 10 times of signal intensity of normal maxillary sinus in contralateral side. To evaluate the accordance of tumor ROI delineation by semi-automatic and radiologist-determined methods, the number of pixels in the radiologist-determined ROI (Nr) and the semi-automatically depicted pixels in (Ni) and out of (No) the radiologist-determined ROI were counted, and the matching (Ni/Nr) and the non-matching (No/Nr) ratios were calculated. We placed both semi-automatic and radiologist-determined ROIs on diffusion weighted images (DWI) of different b values (0, 200, 400, 800, 1000, 2000 s/mm2) and obtained the ADC values respectively for each ROI determination method. The ADC values were calculated by averaging signal intensity in each ROI and using the least-square technique of the regression line crossing the value at b = 0.Results and Discussion
While the matching ratio of the semi-automatically delineated ROI and the radiologist-determined ROI (Ni/Nr) varies from 0.6 to 0.9, the non-matching ratio (No/Nr) was less than 0.1 (Fig. 1). Although some amount of mismatched area in the radiologist-delineated ROI (white area in Fig.2(b)) was observed on the image of a patient whose Ni/Nr was lowest, the semi-automatic method hits averagely around 80% of the tumor area delineated by an experienced radiologist with a quite small unmatched external tumor area: Ni/Nr = 0.83 ± 0.09 (Mean ± SD) and No/Nr = 0.05 ± 0.03 (Fig. 1). As shown in Fig. 2(a), almost exact delineation by our semi-automatic method was performed in some patients. Interestingly, the ADC values obtained from DWI signals in each ROI delineated by the semi-automatic and the radiologist-determined method almost agreed for each patient respectively (Fig. 3). The standard deviation of the difference between the ADC values obtained from each method was 1.3% of the mean value in each patient. Although the semi-automatically delineated ROI was smaller than the radiologist-determined ROI and showed a small amount of marginal area, these mismatch of the two delineation methods did not jeopardize the ADC calculation. This result may indicate that characteristics of HNSCC is homogeneous respectively for patients. The ADC value differed through patients (Fig. 3), and this variation may reflect the characteristic difference of tumors. Although this study only applied to HNSCC, our semi-automatic ROI delineation method would be used for quantitative analysis of tumors.Conclusions
Averagely, 80% of the radiologist-delineated area matched the semi-automatically determined one on Gd contrast-enhanced T1-weighted images of HNSCC. In spite of this difference of delineation of tumor area, the ADC values obtained by applying respective delineated areas to diffusion weighted images agreed within 2% (sd). Our new method of tumor delineation would be used to analyze the tumor characteristics quantitatively.Acknowledgements
No acknowledgement found.References
1. Noriyuki F, Tomohiro S, et al. Advanced diffusion models in head and neck squamous cell carcinoma patients: Goodness of fit, relationships among diffusion parameters and comparison with dynamic contrast-enhanced perfusion. Magnetic Resonance Imaging 2017;36:16-23Figures
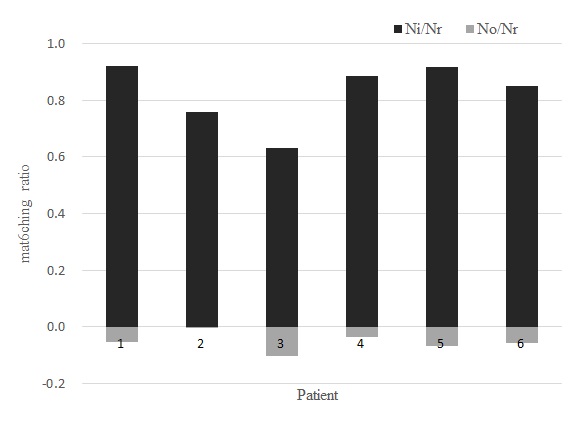
Figure.
1 Ratios of semi-automatically depicted pixels included and excluded in the
areas delineated by a radiologist. Each ratio was calculated based on the
number of pixels in that delineated areas (Nr: the number of pixels of a ROI delineated by the
experienced radiologist excluding necrotic areas, Ni: the number of the
semi-automatically depicted pixels in of the ROI, No: the number of the
semi-automatically depicted pixels out of the ROI). The value of No/Nr was
plotted as a negative value in the graph.
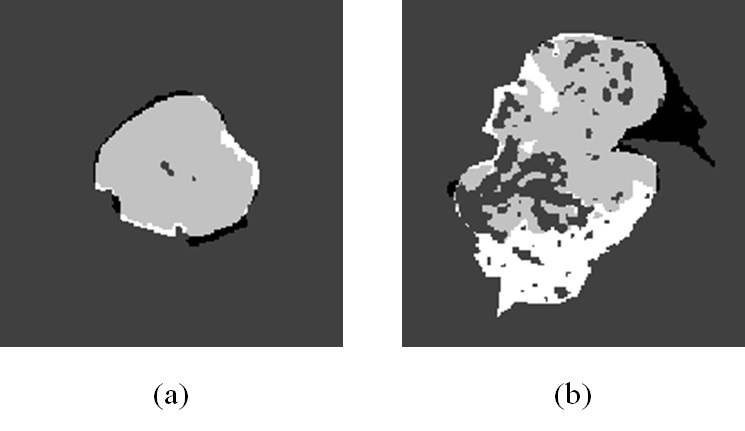
Figure. 2 Tumor ROIs on T1-weighted image
The tumor in the patient whose Ni/Nr was highest (a) and lowest (b) was
delineated respectively: patient 1 (a) and 3 (b) in Fig.1. The white area represents
ROI delineated only by an experienced radiologist and the black area represents
ROI delineated only by the semi-automatic method. The gray area represents the ROI
that delineated by both methods.
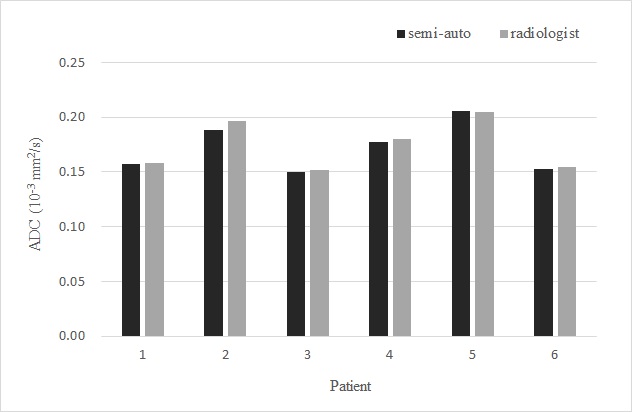
Figure.
3 ADC values of tumors. The black gray bars represent the ADC values of
semi-automatically depicted and radiologist delineated ROIs, respectively.