5405
Detection of Spinal Cord Compression Injury in the Rat using Filter-Probe Diffusion Encoding1Neurosurgery, Medical College of Wisconsin, Milwaukee, WI, United States, 2Neuroscience Doctoral Program, Medical College of Wisconsin, Milwaukee, WI, United States, 3Biomedical Engineering, Marquette University, Milwaukee, WI, United States
Synopsis
A rat model of chronic spinal cord compression was evaluated with reduced field of view (rFOV) diffusion tensor imaging and filter-probe diffusion encoding. The results demonstrate the sensitivity of diffusion MRI for detecting injury.
Introduction
Most animal models of spinal cord injury involve a contusion or transection of the cord. However, the majority of patients seeking treatment for spinal dysfunction have conditions such as Cervical Myelopathy or disk herniation. Diffusion tensor imaging (DTI) and novel diffusion encoding methods have shown promise as biomarkers in spinal trauma1-3 and myelopathy4, but have not yet reached clinical adoption. In this study, an animal model of chronic spinal cord compression was employed to understand the relationships between MRI biomarkers of injury and functional impairment.Methods
Animals: A surgical model of spinal cord compression consisted of a C6 laminectomy, and a sterile piece of Teflon(1.5x2x0.6 mm) was carefully inserted under the C5 laminae(N=7). In sham animals(N=5), the material was inserted and immediately removed. Animals underwent behavioral testing 1 day post-injury and weekly thereafter and MRI at 2 and 30 days post-implant. All procedures were approved by the local IACUC.
Magnetic Resonance Imaging: MRI was performed on a 9.4T Bruker Biospec with a commercial 38mm diameter Litz volume coil(Doty Scientific, Inc). A reduced field of view(rFOV) 2D echo planar excitation was implemented with 26 Gaussian sub-pulses(0.12ms duration) modulated with a Gaussian window having a total pulse duration of 9.2ms. Diffusion weighting consisted of a conventional single-shell (b=800 s/mm2) acquisition. A separate acquisition with diffusion filter of b=2000 s/mm2 and probe values of (b=0-1000 s/mm2) were employed. A 4-shot EPI readout (TR/TE: 2000/43 ms) and respiratory gating were used with total acquisition times of 9:04 and 14:56 minutes for the DTI and filter-probe, respectively, at a resolution of 156μm in-plane and 1.5mm thickness. A whole-cord single-voxel diffusion weighted PRESS voxel(10x10x5 mm) was also acquired with the filter-probe double diffusion encoding (DDE) and positioned at the C5 vertebrea(TR/TE: 3000/37ms) with an acquisition time of 2min plus respiratory delays.
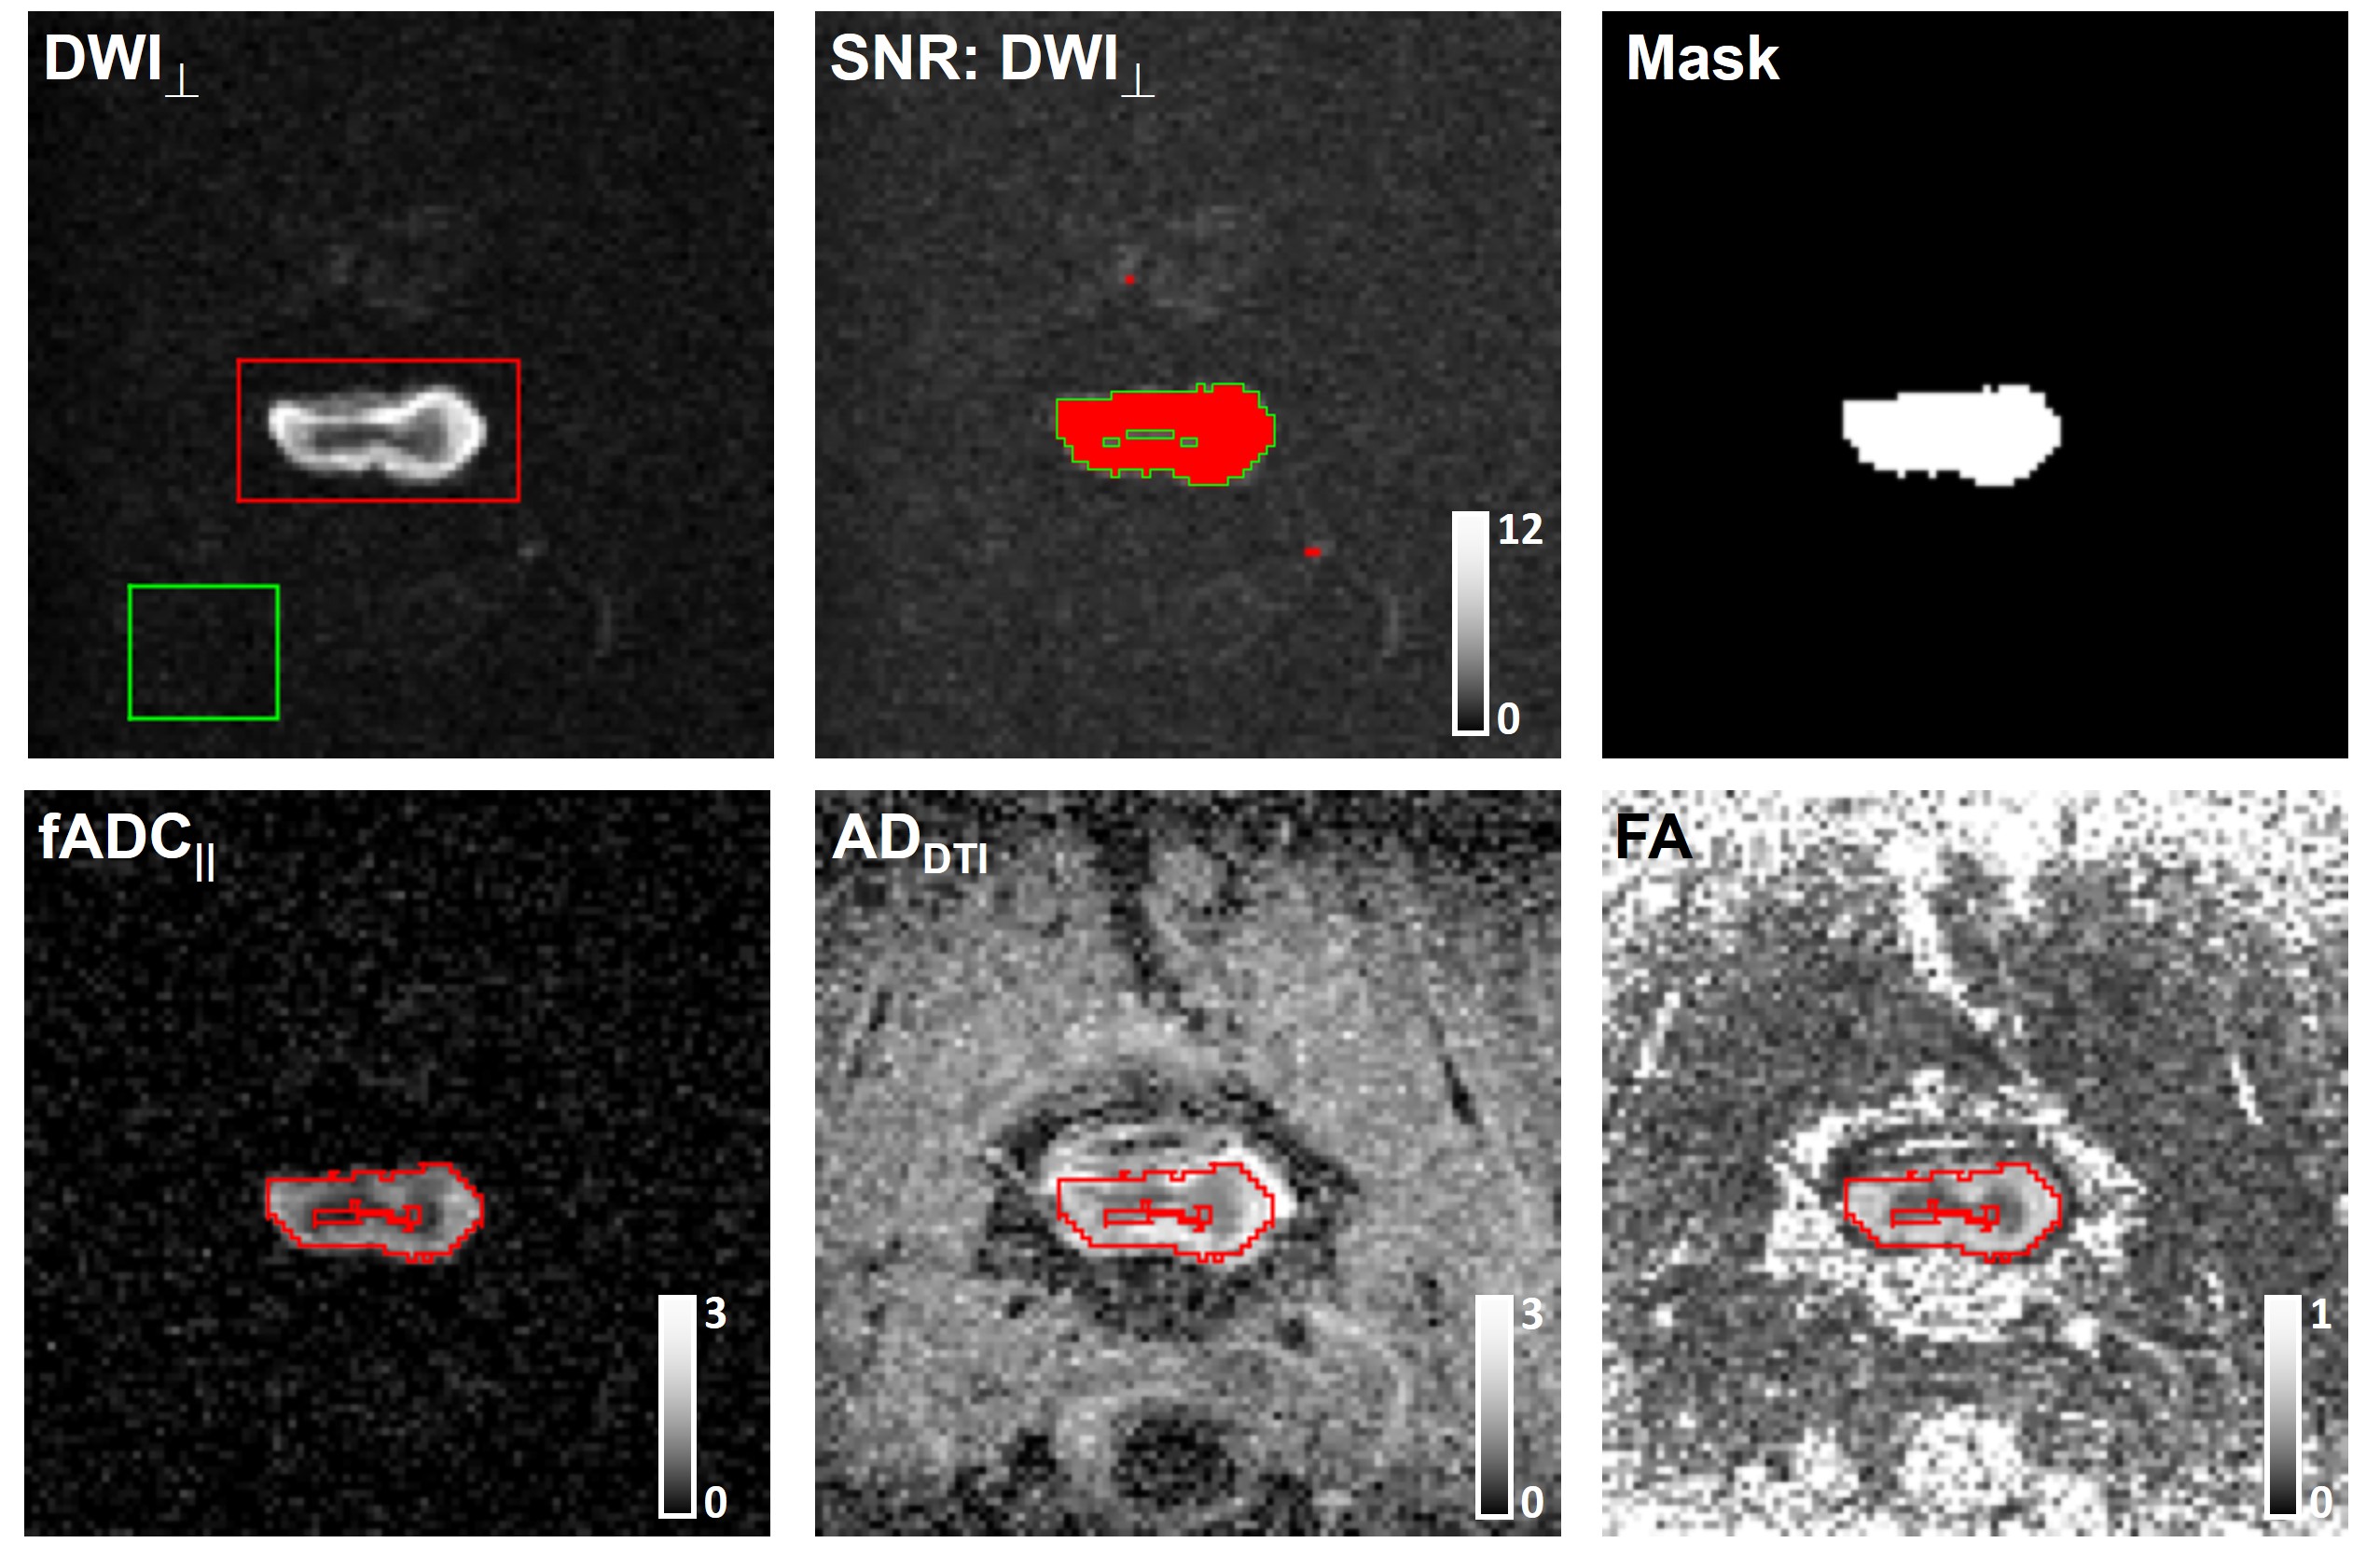
Data Analysis: The diffusion tensor and filter-probe indices were computed as previously described3, yielding FA, MD, RD, and AD(DTI) and filtered ADC|| (fADC||) for filter-probe encoding. A single slice at the level of maximal compression was used. Regions of interest encompassing the entire cord were prescribed, and only voxels with SNR values of 12 or greater in the DWIperp were included in the final mask which was transformed to the parametric maps. The spinal cord cross sectional area(CSA) was also obtained at the level of compression.
Statistical Analysis: T-tests between the compressed and sham animals for all metrics were compared, and correlations between each metric and the final functional score (BBB) were assessed.
Results
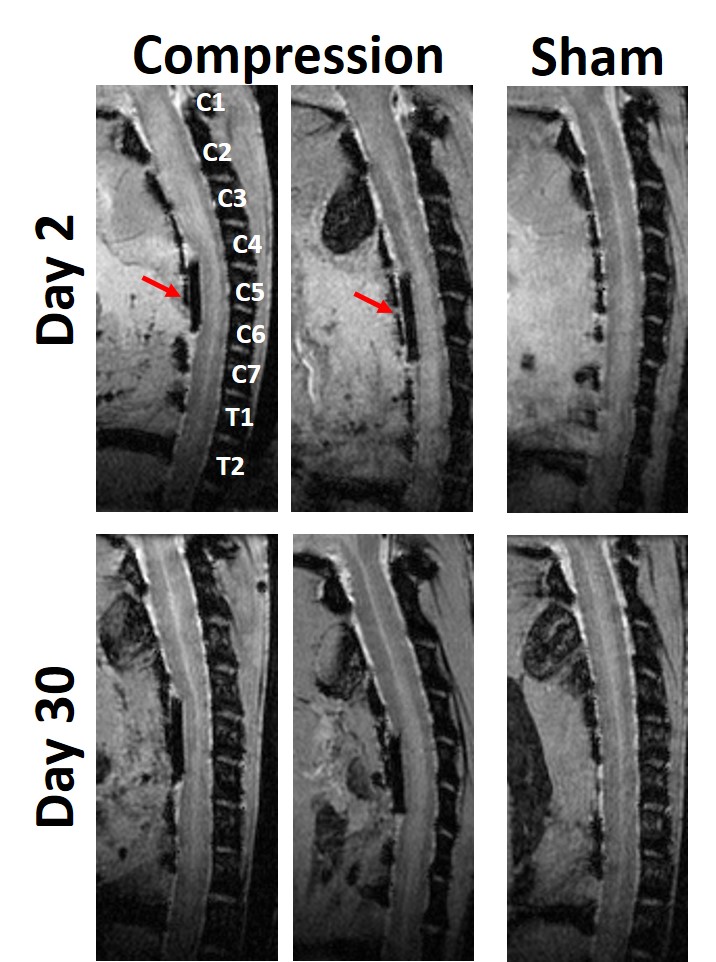
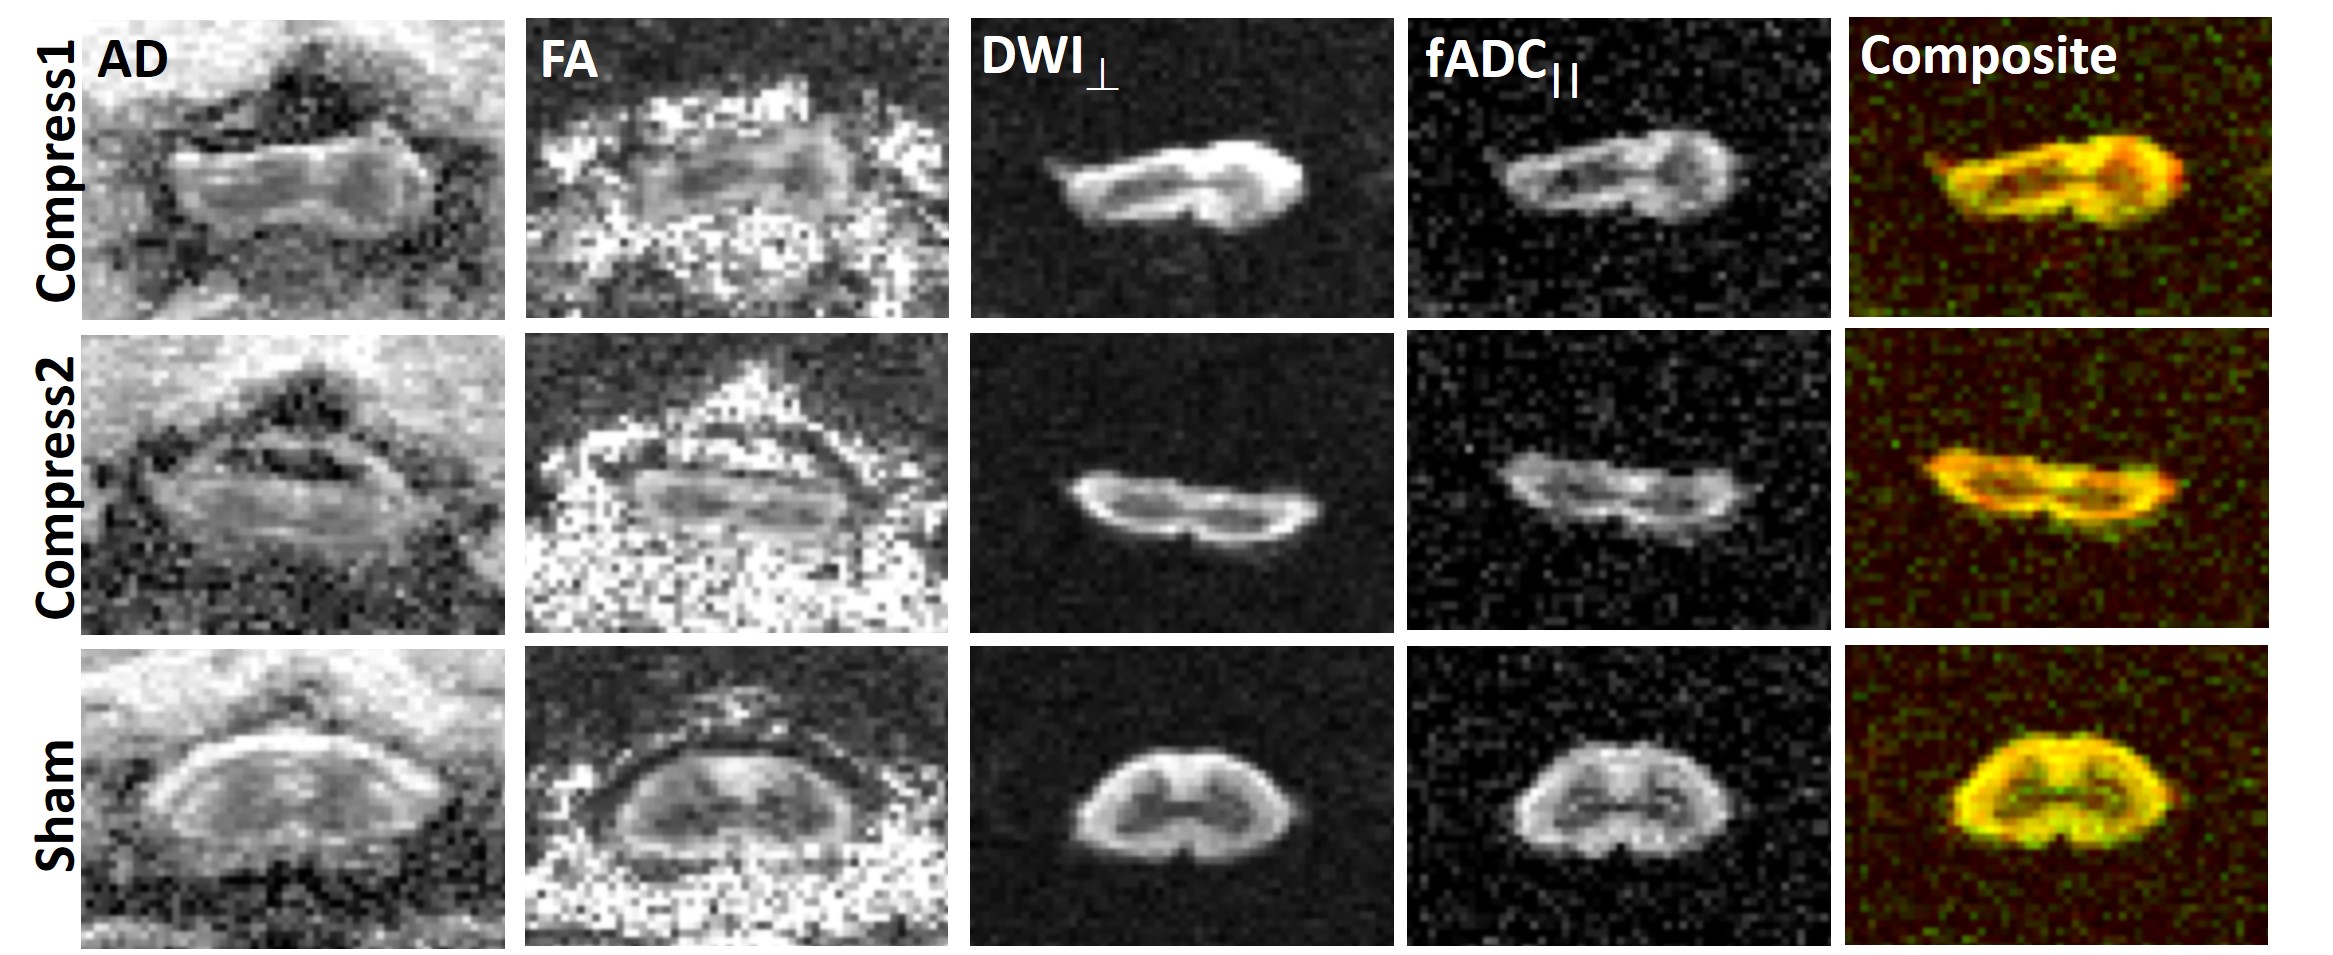
The Teflon implant can be seen in the sagittal image in which there is qualitative evidence of distortion in the cord. The rFOV-DW images at the level of the implant(Fig. 2) demonstrate clear delineation of the spinal cord anatomy, and flattening of the cord is evident in the compressed cord. Compared to the DTI maps, the cord boundaries are more readily apparent in the filter-probe images. The quantitative metrics were obtained through semi-automated ROI methods for subsequent analysis(Fig. 3).
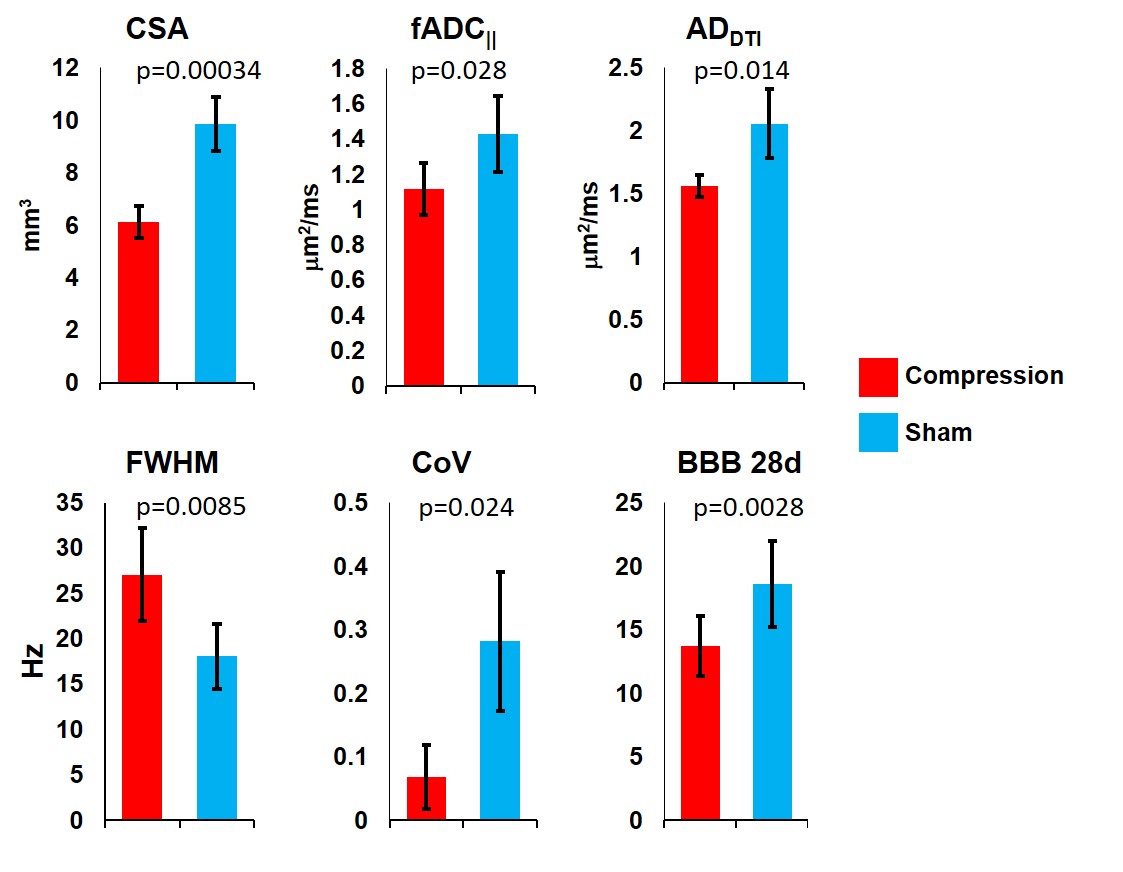
Several of the metrics were significantly different between the compression and sham groups. At 2 days post-implant, CSA(p=0.00034), fADC||(p=0.028) and ADDTI(p=0.014) were significantly lower in the compression group compared to shams, while FA did not differ(p=0.59). Interestingly, in the DW-PRESS metrics, while fADC|| did not differ between groups(p=0.16), FWHM(p=0.0085) and RepCoV(p=0.024) were higher and lower in the compression group, respectively. At 30 days post-implant, only CSA(p=0.02) was significantly different between groups. BBB scores were significantly different at 1(p=0.0095), 7(p=0.021), 14(p=0.019), and 28(p=0.028) days between groups.
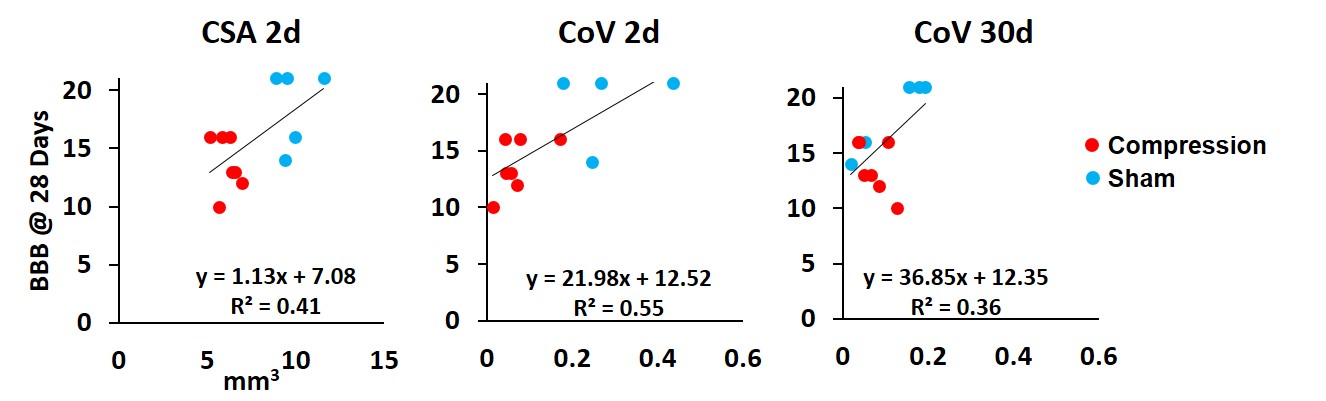
In the correlation analysis at 2 days post-implant, CSA(R2=0.41, p=0.026) and CoV(R2=0.55, p=0.009) were significant predictors of BBB scores at 28 days, and at 30 days post-implant only CoV(R2=0.36, p=0.041) was associated with BBB scores.
Discussion
An animal model of spinal cord compression was used to assess injury and predict outcome functional outcome. The model imparts a static, persistent mild to moderate compression to the cord. In this model, many of the DWI indices were significantly different between the two groups at the early(2d) timepoint. Most notably, diffusion metrics parallel to the cord were affected. Interestingly, the quality-control metrics derived from DW-PRESS, spectral width (FWHM) and replicate variability (CoV), were significantly affected by the compression and were significantly related to function. Although a larger sample size is needed, it is interesting but unclear how these metrics relate to the underlying injury.
The filter-probe diffusion encoding, in addition to reducing the contribution of edema (not shown in this work), facilitates objective ROI measurements in the cord using high diffusion weighting (2000 mm2/s) perpendicular to the cord to suppress non-cord tissues. Paired with a rFOV excitation, clear delineation of the spinal cord could be achieved in a manageable time (14 mins).
Acknowledgements
This project was funded partially through the Advancing a Healthier Wisconsin endowment at the Medical College of Wisconsin (MCW), the Craig H. Neilsen Foundation, and the US Department of Veterans Affairs Rehabilitation Research and Development Service.References
1Shanmuganathan K, et al. J Neurotrauma, 2017. 2Kim JH et al. J Neurotrauma, 2010. 3Skinner N et al. Magn Res Med. 2016. 4Martin A et al. AJNR. 2017.Figures