5402
A longitudinal study of APT CEST contrast in the spinal cord of patients with multiple sclerosis at 3T1Department of Biomedical Engineering, Vanderbilt University, Nashville, TN, United States, 2Vanderbilt University Institute of Imaging Science, Vanderbilt University Medical Center, Nashville, TN, United States, 3Phillips Healthcare, Baltimore, MD, United States, 4Department of Neurology, Vanderbilt University, Nashville, TN, United States, 5Department of Radiology and Radiological Sciences, Vanderbilt University Medical Center, Nashville, TN, United States
Synopsis
Current clinical MRI sequences cannot characterize biochemical tissue changes within the spinal cord. Therefore, MRI biomarkers sensitive to biochemical tissue changes are needed. Amide proton transfer chemical exchange saturation transfer (APT CEST) is an emerging MRI contrast method sensitive to the exchange rate and concentration of amide proton moiety. In this work, we sought to assess the reproducibility and longitudinal change of spinal cord APT CEST in patients with MS. Our results suggest that APT CEST in the spinal cord is capable of reproducibly identifying underlying changes in spinal cord tissue pathology.
Introduction
Spinal cord (SC) damage plays an integral role in progression of disability in patients with multiple sclerosis (MS)1. While MRI is critical for detecting lesions aiding in diagnosis, current clinical sequences cannot characterize biochemical tissue changes within the SC that may underlie disease progression. Therefore, MRI biomarkers sensitive to biochemical tissue changes, rather than overt inflammation and tissue atrophy, are needed to increase our understanding of MS and potentially lead to improvements in evaluation of disability and therapeutic intervention.
Amide proton transfer (APT) chemical exchange saturation transfer (CEST) is an emerging MRI contrast derived from specific off-resonance (with respect to water) RF irradiation selectively saturating exchanging protons (Dw = 3.5ppm) associated with proteins and peptides and, thus, is sensitive to the exchange rate and concentration of the amide proton moiety2. Our previous research has shown that APT CEST is sensitive to tissue biochemistry change in MS patients compared to healthy volunteers3. In this work, we assess the reproducibility (in healthy volunteers) and longitudinal change of SC APT CEST in patients with MS.
Methods
Two healthy volunteers (1M/1F, 41±10 years of age) and three patients with RRMS (1M/2F, 41±15 years of age, average disease duration: 12 years, average Expanded Disability Status Score: 3.5) were recruited for this study from an original cohort after informed consent. The average time between the initial and repeated scans was 1.16 years for control subjects and 1.6 years for the MS patients. All images were acquired using a 3T whole body scanner (Philips, Best, The Netherlands) and a 16-channel sensitivity encoding (SENSE) neurovascular coil. A single CEST slice was acquired between the C3 and C4 vertebrae in the cervical SC. All CEST-weighted images were registered to a multi-slice, multi-echo gradient echo (mFFE) prior to analysis. To correct for B0 field shifts, a WASSR sequence was performed. The CEST preparation consisted of a single 150ms 2µT saturation pulse acquired at 36 asymmetric offset frequencies between Δω = ±5 ppm and corrected for respiration according to By et al3. Additional relevant parameters for the CEST sequence include: FOV = 160mm x160mm, voxel size = 1mm x 1mm, SENSE = 2(RL), TR/TE = 305/12ms, α = 20°, NSA = 5, acquisition time < 13 minutes.
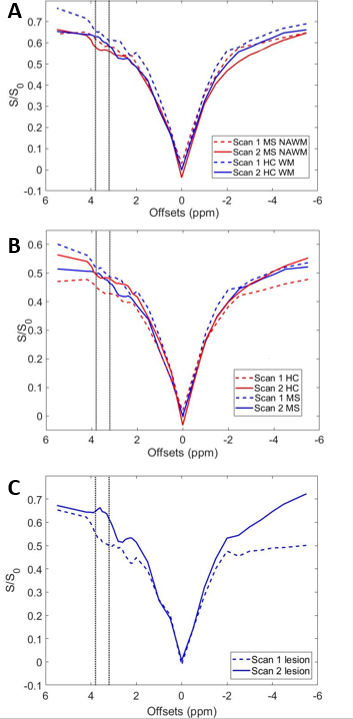
All analysis was performed in Matlab (Mathworks, Nattick, MA). Healthy white matter, normal appearing white matter (MS patients) and lesions (MS patients) were identified from the mFFE images. The APT CEST effect was quantified using a Lorentzian fit with a baseline offset and APTw was calculated by integrating the difference between the Lorentzian fit and z-spectrum between 3.2 and 3.8 ppm downfield. Analysis was performed in 3 ways: 1) assess difference in z-spectrum shape between Scan 1 and Scan 2 in healthy controls (reproducibility), 2) difference in the APTw image and value between healthy control white matter and a) normal appearing white matter, and b) lesions (sensitivity to pathology), and 3) difference in the APTw in MS patients between visits (sensitivity to change).
Results
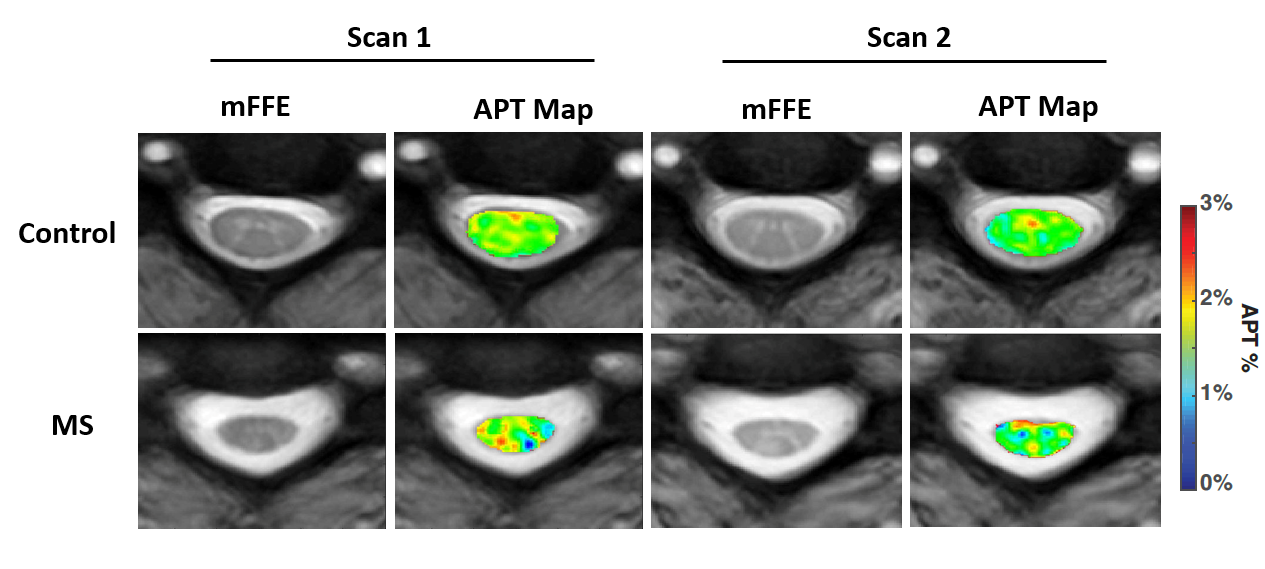
The whole cord z-spectra overlap for scan 1 and scan 2 in healthy controls (Figure 1A) and are in good agreement (ANOVA result is non-significant). To assess changes in the z-spectrum over time, (ΔS/S0) the difference between the Scan 1 and Scan 2 z-spectra were measured for both MS patients and control. We found no significant difference between the ΔS/S0. Of note, significant differences were found between healthy and MS SC CEST spectra for both Scan 1 (p<0.001) and Scan 2 (p<0.001). Interestingly, when considering only NAWM (Fig 1B) no significant differences in MS patients were noted for scan 2, however, there was significant change in the z-spectrum appearance in the lesions from scan 1 and scan 2 (Fig 1C, p < 0.001). Figure 2 depicts the mFFE and APTw map for baseline and follow-up scan in one healthy control and one MS patient showing consistency between Scan 1 and Scan 2 for the healthy volunteer, and a visual change in the MS patient over 1 year.Discussion
Our results suggest that APT CEST in the spinal cord is capable of reproducibly identifying underlying changes in tissue pathology. Though there is a small shift in the data over time, APT CEST differentiates between healthy and MS tissue. Also, APT CEST shows improved sensitivity to MS changes when compared to the mFFE, which may be a reflection of the underlying tissue changes rather than inflammation. Because APT effect is sensitive to protein concentration, changes due to remyelination or inflammatory responses may alter the appearance of APT CEST over time.Acknowledgements
National MS Society Conrad Hilton Foundation R21 (NIH/NINDS 1R21NS087465-01)References
1. Zhou, J., et al., Nature Medicine, 2003. 9(8): p. 1085-1090.
2. Zhou J, Payen J-F, Wilson DA, Traystman RJ, van Zijl PCM. Using the amide proton signals of intracellular proteins and peptides to detect pH effects in MRI. Nat Med 2003;9:1085–1090.
3. By S, Barry RL, Smith AK, Lyttle BD, Box BA, Bagnato FR, Pawate S, Smith SA. Amide proton transfer CEST of cervical spinal cord in multiple sclerosis patients at 3T.
Figures