5397
Spinal Cord Perfusion is Associated with Diffusion and clinical mJOA score in Preoperative Patients with Cervical Spondylotic Myelopathy1CBIR,school of medicine, Tsinghua University, Beijing, China, 2Jishuitan hospital, Beijing, China
Synopsis
Cervical Spondylotic Myelopathy (CSM) is a chronic progressive disorder of spinal cord with a relatively ill-defined onset of pathogenesis. A series of state-of-art quantitative and functional MR imaging techniques have been proposed aiming to find out specific indicators in prediction and diagnosis of CSM at early phase, but lack of sufficient evidences. Spinal cord blood supply change was recognized as one of the crucial pathophysiological process in CSM. Hence, we investigate the relationship between spinal cord blood perfusion assessed by MR DSC with DTI metrics and clinical mJOA score. Finally, we find spinal cord blood flow is significantly correlated with diffusion metrics and mJOA.
Introduction
Cervical Spondylotic Myelopathy (CSM) is a chronic progressive disorder of spinal cord with a relatively ill-defined onset of pathogenesis compared with other spinal disorders1. In recent years, a series of state-of-art quantitative and functional MR imaging techniques were proposed aiming to find out specific indicators that contribute to prediction and diagnosis of early phase CSM prior to progressive myelopathy1,3. However, very low evidence exists for these metrics to serve as a biomarker in diagnosis and prognosis in a clinical context3. Up to date, Diffusion Tensor Imaging (DTI) has produced the most substantial results in assessing neuro-impairment in CSM3. Spinal cord blood supply change was recognized as one of the crucial pathophysiological process in CSM2, but lack of a comprehensive investigation. Hence, we sought to investigate the relationship between spinal cord blood perfusion assessed by Dynamic Susceptibility Contrast (DSC) imaging with DTI metrics, and clinical mJOA score.Method and materials
Image acquisition
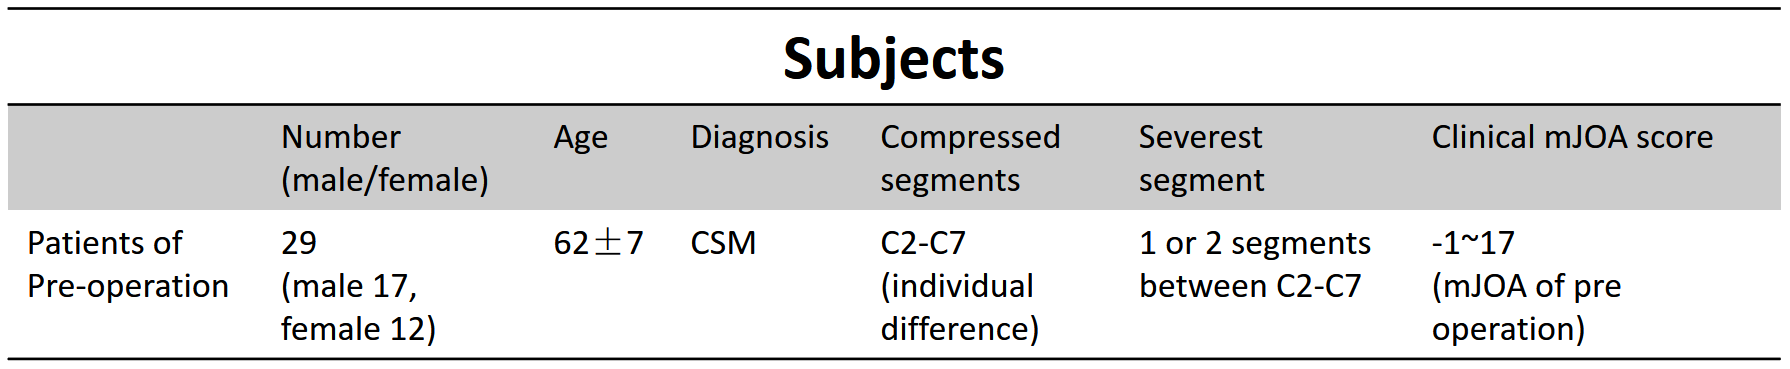
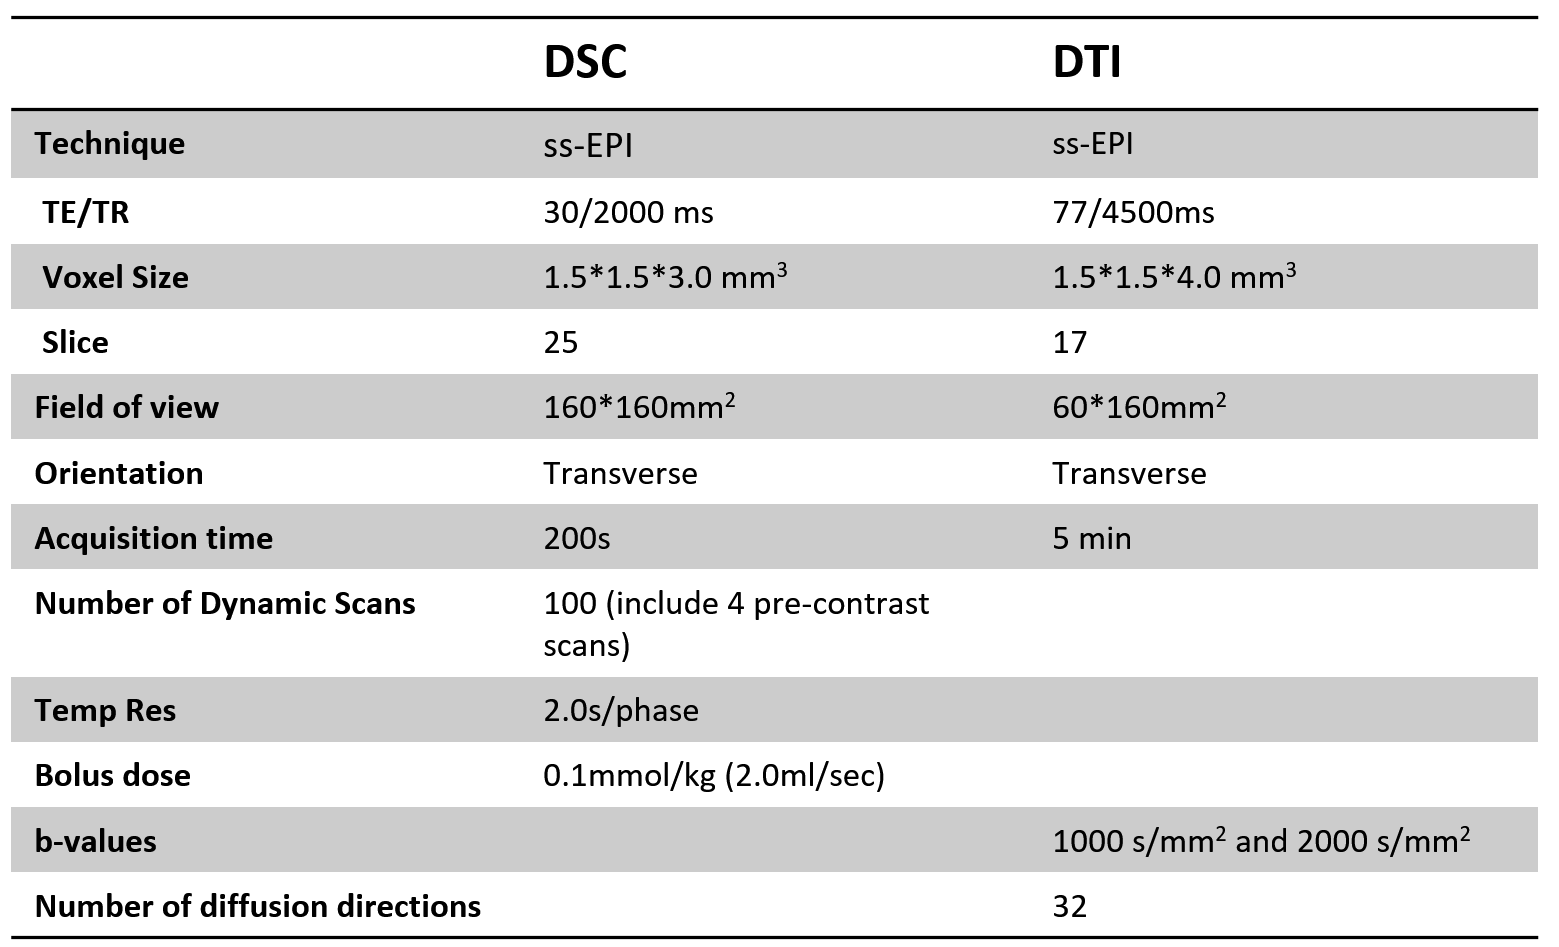
29 preoperative CSM patients (12 F and 17 M, age 47-75 years, mean 62 years) (Table 1) were recruited following informed consent by cooperative hospital. All patients were diagnosed with CSM and accept a physical examination for Modified Japanese Orthopaedic Association (mJOA) score, a clinical standard to evaluate the severity of CSM, at the same day with imaging on a Philips Achieva 3.0T (Philips, Best, The Netherlands) with a 16-channel head-neck coil. All imaging were done covering all the compressed vertebral segments vary from C2-C7. SENSE and partial Fourier technique were adopted for imaging acceleration. DSC and DTI images were obtained axially with following parameters (Table 2).
Data processing and analysis
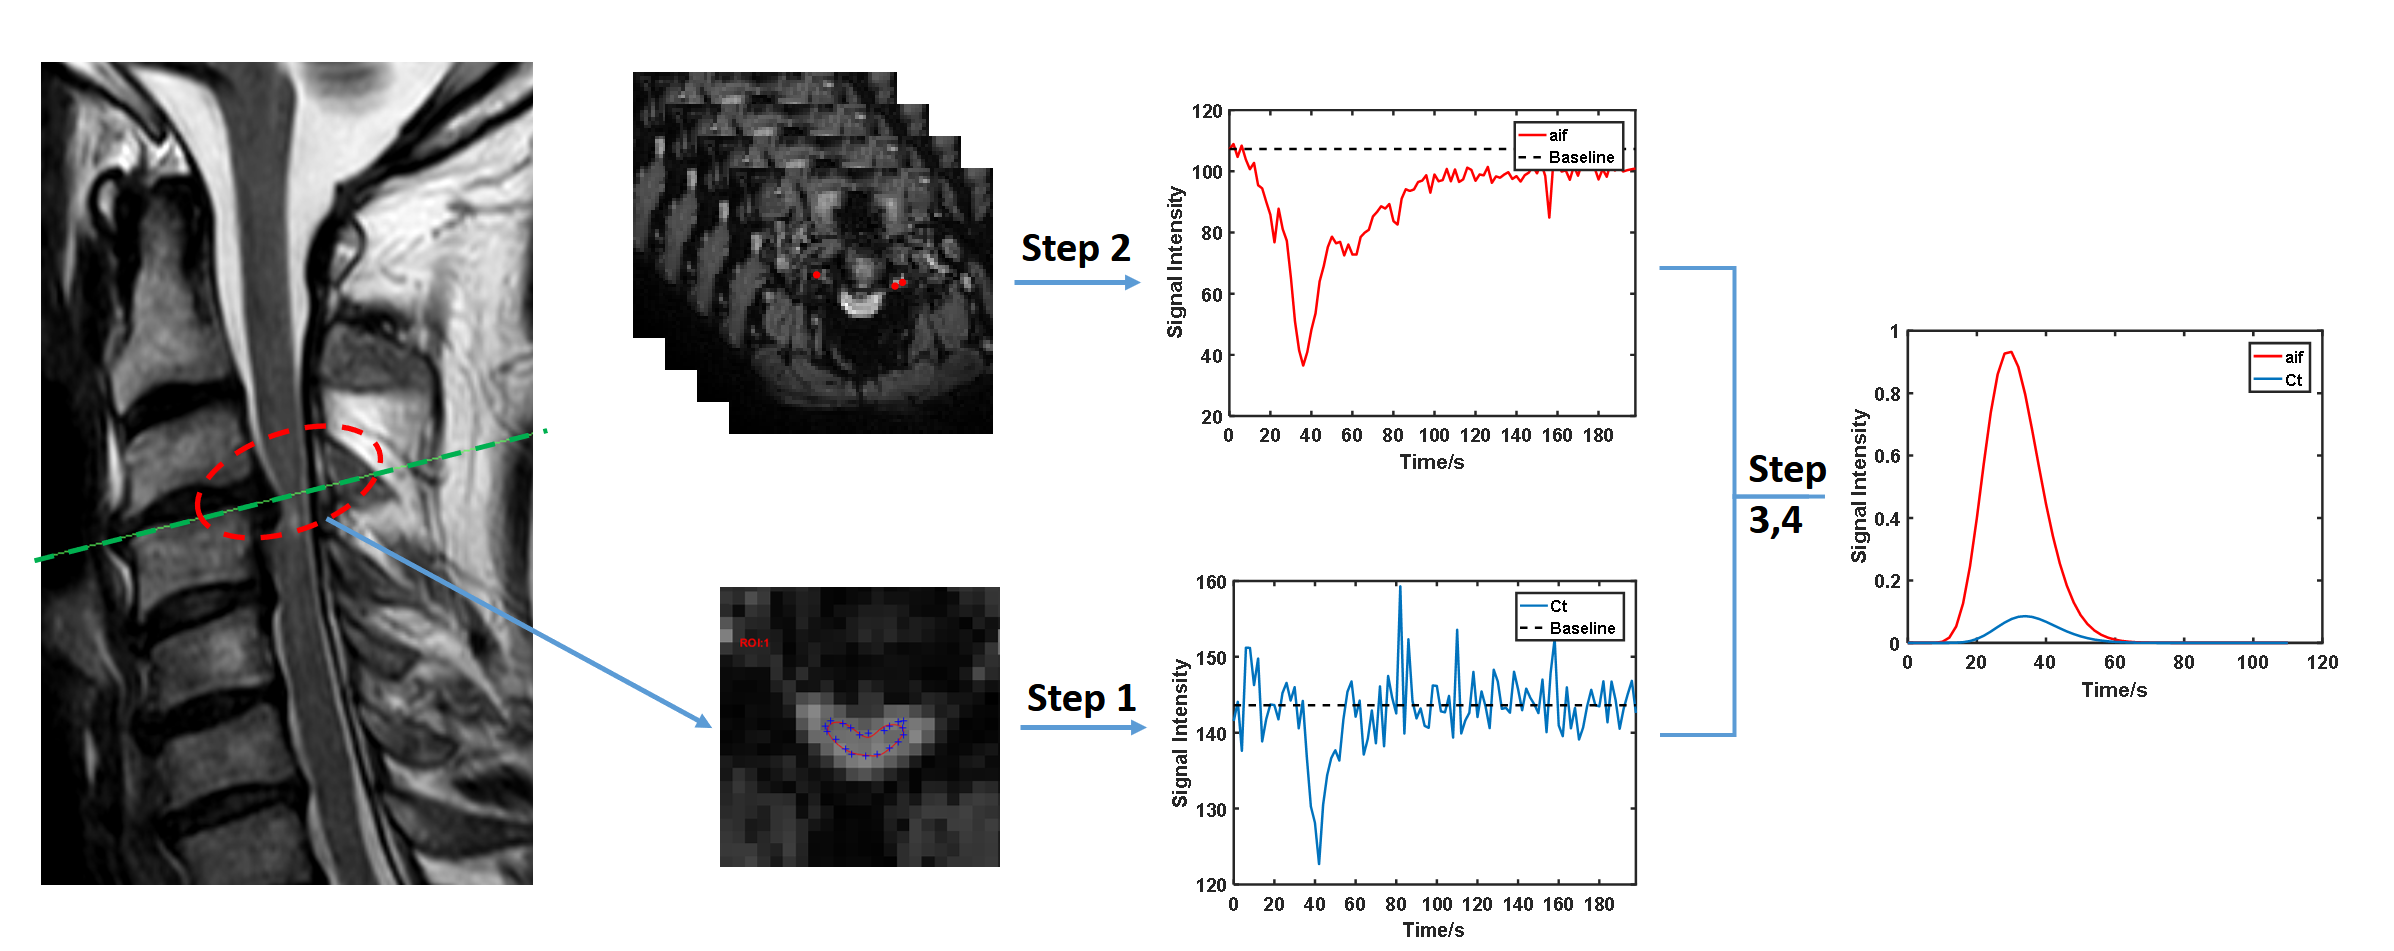
DSC: before the calculation of parameters, manually depicted ROI for each compressed slice was needed to generate the respective dynamic intensity curves. An automatic searching strategy for potential artery input function (AIF) voxels in vertebral artery was adopted7. After concentration convention and gamma fitting to original curves4, Classic Indicator Dilution Theory4 was taken to quantify the spinal cord blood flow (SCBF) (Fig 1).
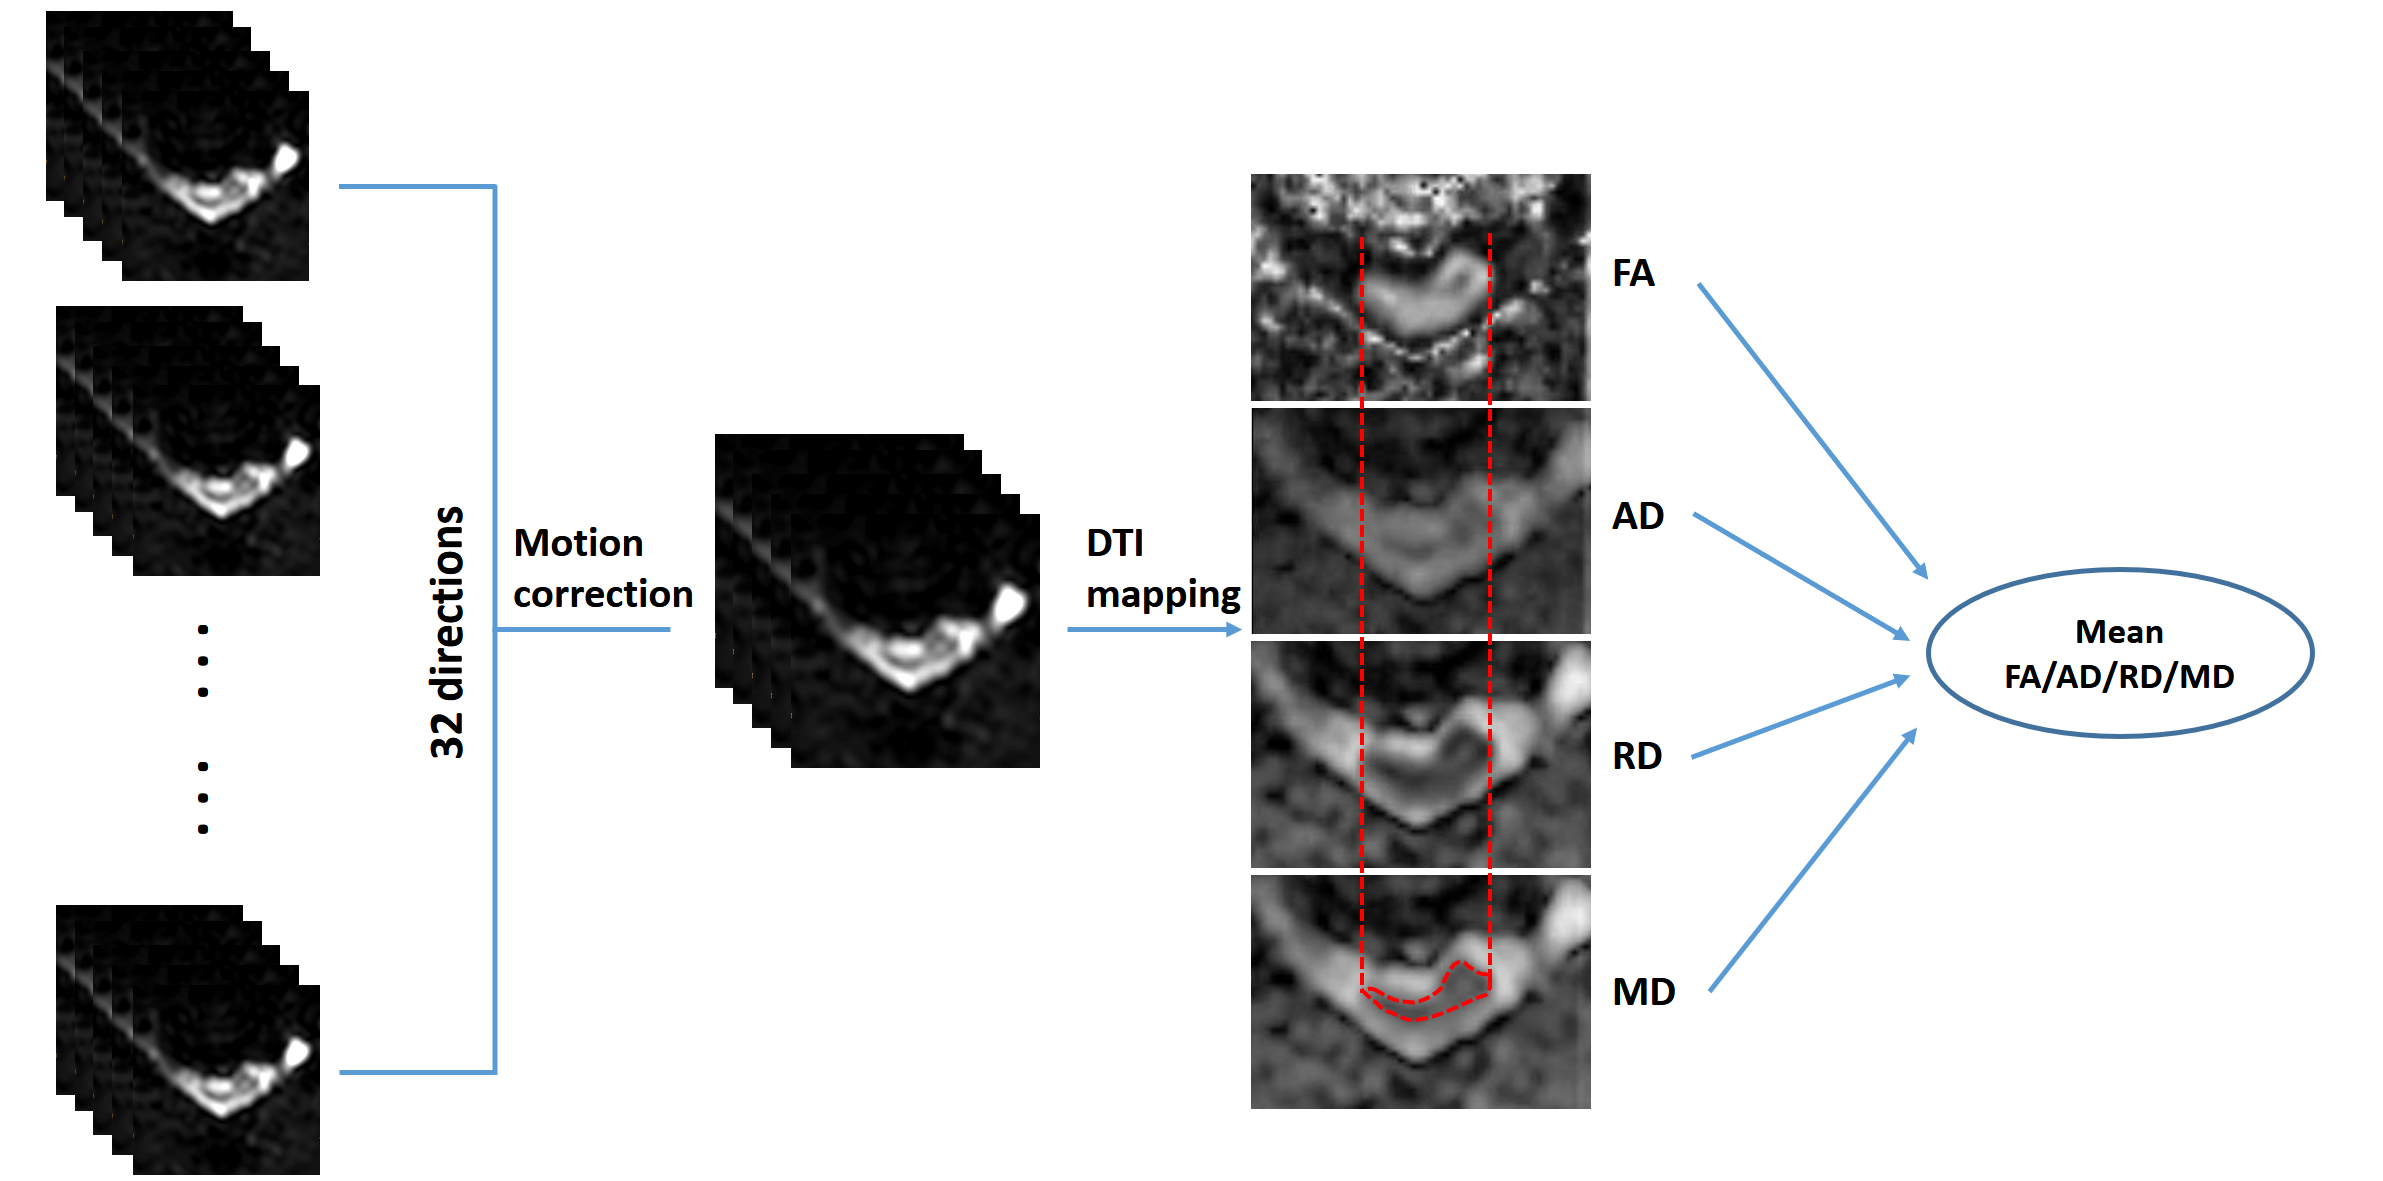
DTI: the diffusion weighted images were pre-registered to different directions using Spinal Cord Toolbox (SCT)8. Then the DTI metrics, including fractional anisotropy (FA), axial diffusivity (AD), radial diffusivity (RD) and mean diffusivity (MD) were calculated from the corrected images using FSL5. Region of interest (ROI) was drawn on MD maps to outline the spinal cord using DTI-Studio6. Then the mean FA, AD, RD and MD were calculated and reported.
All DSC and DTI metrics to be analyzed were provided after averaging all compressed slices’ results for each subject. For all cases, the spearman correlation was employed to explored the correlation of DSC metrics-mJOA and DSC-DTI metrics.
Results
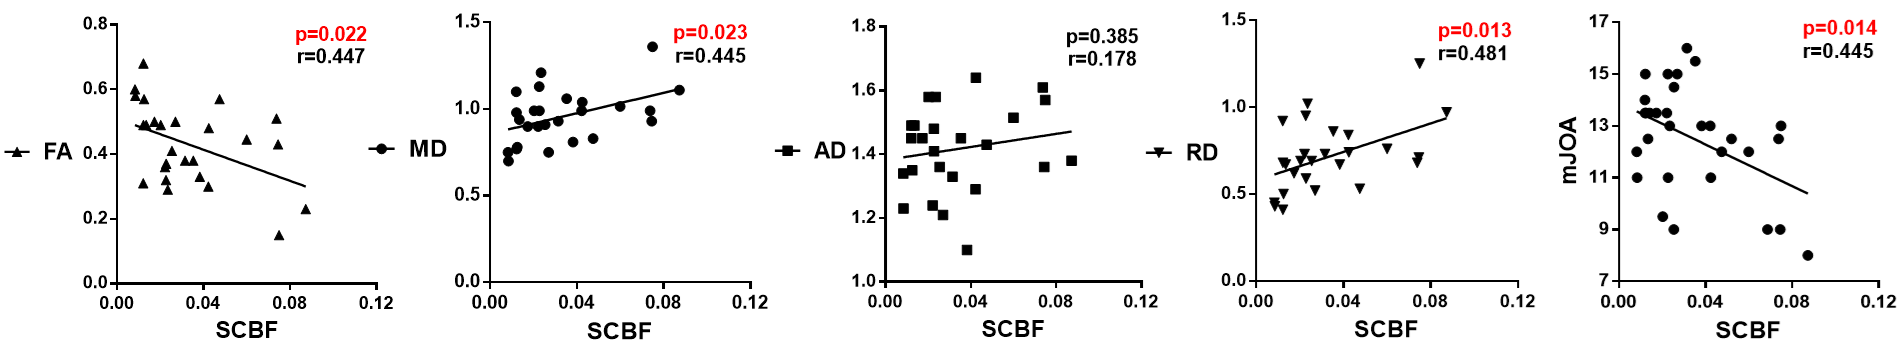
The results of spearman correlation analysis are shown as Fig 3. The results indicate that SCBF is significantly negative correlated with FA (p<0.05), and positive correlated with MD and RD (p<0.05). Namely, patients with higher spinal cord blood flow seem to have loss of anisotropy and rise of radial diffusivity. Whereas AD shows no significant correlation with SCBF. Additionally, SCBF is found increased in patients with lower mJOA scores, indicates that the rise of SCBF may related with more severe physical impairment in patients with CSM.Discussion and conclusion
In this study, we found that the spinal cord perfusion quantified by MR DSC is significantly correlated with diffusion metrics acquired by DTI imaging in pre-operation patients with CSM. The sensitivity and specificity for detecting myelopathy using DTI technique have been widely confirmed10. Specifically, FA appears to be significantly correlated with clinical mJOA score11. From DSC-DTI results, we infer that the increase of spinal cord blood flow in compressed site is a vital pathological event reflecting the loss of anisotropy of axon in process of myelopathy. Especially, the rise of RD, a marker sensitive to demyelination, seems be more tightly correlated with the increase of SCBF than the other metrics. Hence, the change of SCBF could be an alternative indicator in predicting microstructure deficit and diagnosis of CSM. In addition, we find that the increased SCBF is significantly related with severity of physical impairment in CSM patients. It should be noted that the increase of SCBF could be a skin-deep reflection of a series of deeply hidden pathological factors contribute to the hyper-perfusion of compressed sites, which indeed deserves us to explore. Our study prospectively contributes to exploring a deeper insight of complex interaction and relationship of pathological factors in course of CSM. In conclusion, the spinal cord blood flow evaluated by MR DSC is associated with clinical mJOA scores and neuro-structure deficit assessed by DTI imaging.Acknowledgements
No acknowledgement found.References
1. Ellingson B M, Salamon N, Holly L T. Advances in MR imaging for cervical spondylotic myelopathy[J]. European Spine Journal, 2015, 24(2):197-208.
2. Karadimas S K, Gatzounis G, Fehlings M G. Pathobiology of cervical spondylotic myelopathy[J]. European Spine Journal, 2015, 24(2):132-138.
3. Martin A R, Aleksanderek I, Cohen-Adad J, et al. Translating state-of-the-art spinal cord MRI techniques to clinical use: A systematic review of clinical studies utilizing DTI, MT, MWF, MRS, and fMRI[J]. Neuroimage Clinical, 2015, 10(C):192.
4. Smith A M, Grandin C B, Duprez T, et al. Whole brain quantitative CBF, CBV, and MTT measurements using MRI bolus tracking: Implementation and application to data acquired from hyperacute stroke patients[J]. Journal of Magnetic Resonance Imaging Jmri, 2000, 12(3):400.
5. Jenkinson M, Beckmann CF, Behrens TE, Woolrich MW, Smith SM. Fsl. NeuroImage 2012;62(2):782-790.
6. Jiang H, van Zijl PC, Kim J, Pearlson GD, Mori S. DtiStudio: resource program for diffusion tensor computation and fiber bundle tracking. Computer methods and programs in biomedicine 2006;81(2):106-116.
7. Carroll, T. J, et al. (2003). "Automatic calculation of the arterial input function for cerebral perfusion imaging with MR imaging." Radiology 227(2): 593-600.
8. De Leener B, Levy S, Dupont SM, et al. SCT: Spinal Cord Toolbox, an open-source software for processing spinal cord MRI data. NeuroImage 2017;145(Pt A):24-43.
9. Song SK, Sun SW, Ramsbottom MJ, et al. Dysmyelination revealed through MRI as increased radial diffusion of water, Neurimage 2002; 17: 1429-1436.
10. Jones JG, Cen SY, Lebel RM, Hsieh PC, Law M (2012) Diffusion tensor imaging correlates with the clinical assessment of disease severity in cervical spondylotic myelopathy and predicts outcome following surgery. AJNR Am J Neuroradiol 34:471–478.
11. Demir A, Ries M, Moonen CT, Vital JM, Dehais J, Arne P, Caille JM, Dousset V (2003) Diffusion-weighted MR imaging with apparent diffusion coefficient and apparent diffusion tensor maps in cervical spondylotic myelopathy. Radiology 229:37–43.
Figures