5396
Structural and quantitative MRI to identify lesion level dependant neurodegeneration after SCI1Spinal Cord Injury Center Balgrist, University Hospital Zurich, University of Zurich, Zurich, Switzerland, Zürich, Switzerland, 2Wellcome Trust Centre for Neuroimaging, UCL Institute of Neurology, University College London, London, UK, london, United Kingdom, 3Department of Neurophysics, Max Planck Institute for Human Cognitive and Brain Sciences, Leipzig, Germany, leipzig, Germany
Synopsis
Patients with spinal cord injury (SCI) undergo neurodegeneration affecting the spinal cord and the brain. However, the volumetric and microstructural patterns of degeneration, their relation to lesion level and clinical outcomes are uncertain. In this study, both structural and quantitative MRI approaches are used in order to identify lesion dependent neurodegeneration following SCI. It was found that lesion level drives structural changes in the spinal cord but not brain.
Background
The ability to recover from SCI depends on the completeness and level of lesion. However, while it is clear that trauma induces a cascade of neurodegenerative effects across the neuroaxis, it is unclear whether its magnitude is driven by completeness or level of injury. We used both structural and quantitative MRI protocols to assess the effect of completeness and level of lesion upon volumetric and micro-structural changes in the spinal cord and brain in tetra- and paraplegic patients.Materials and Methods
Thirty chronic SCI patients (3 females age: 44.6 ± 16.7 years; 15 tetraplegic and 15 paraplegics) and 23 healthy subjects (10 Females age: 36.9 ± 11.8 years) underwent an optimized 3D-MPRAGE T1-weighted scan with following parameters: FOV=224×256mm2, matrix=224×256, TR/TE=2420/4.18ms, BW=150Hz/p, and 1mm resolution, using a 3T Siemens scanner combined with a 16-channel receive head/neck coil. To assess microstructural changes associated with myelin and iron content, a multi-parameter mapping (MPM) MRI protocol1,2 which is composed of three different 3D multi-echo FLASH sequences, was performed. This protocol provides quantitative MR parameters of longitudinal relaxation rate (R1=1/T1), effective proton density (PD*), magnetization transfer saturation (MT) and effective transverse relaxation rate (R2*=1/T2*) with following parameters: TR=25ms, flip-angle=23° and 4° for T1-weighted images and PD-weighted images, respectively. TR=37ms, flip-angle=9° for MT-weighted images, six TE=2.46ms-14.78ms for MT-weighted acquisitions with two additional echoes at 17.22ms and 19.68ms for T1-weighted and PD-weighted acquisitions. Spinal cord area (SCA) and its anterior-posterior (APW) and left-right width (LRW) were calculated at the C2/C3 level on the T1w images. Microstructural changes at the identical spinal cord level were calculated using in-house MATLAB scripts based on nearest neighbour region growing followed by ellipse fitting in MT maps and then superimposed on R1 and R2s maps. Spinal cord parameters were assessed using ANOVA (Analysis of variance) adjusted for age and lesion completeness using Stata 13 (StataCorp, College Station, TX).
Brain data were analysed using voxel-based morphometry (VBM3) to assess volumetric changes in grey (GM) and white matter (WM) and voxel-based quantification (VBQ2,4) to assess myelin (MT & R1) and iron content (R2*). Statistical analyses were performed in SPM12 using general linear models and multiple comparison correction using Gaussian random Field theory. Regression analysis explored the association between structural changes and clinical impairment scores using a threshold of p=0.05 family wise corrected.
Results
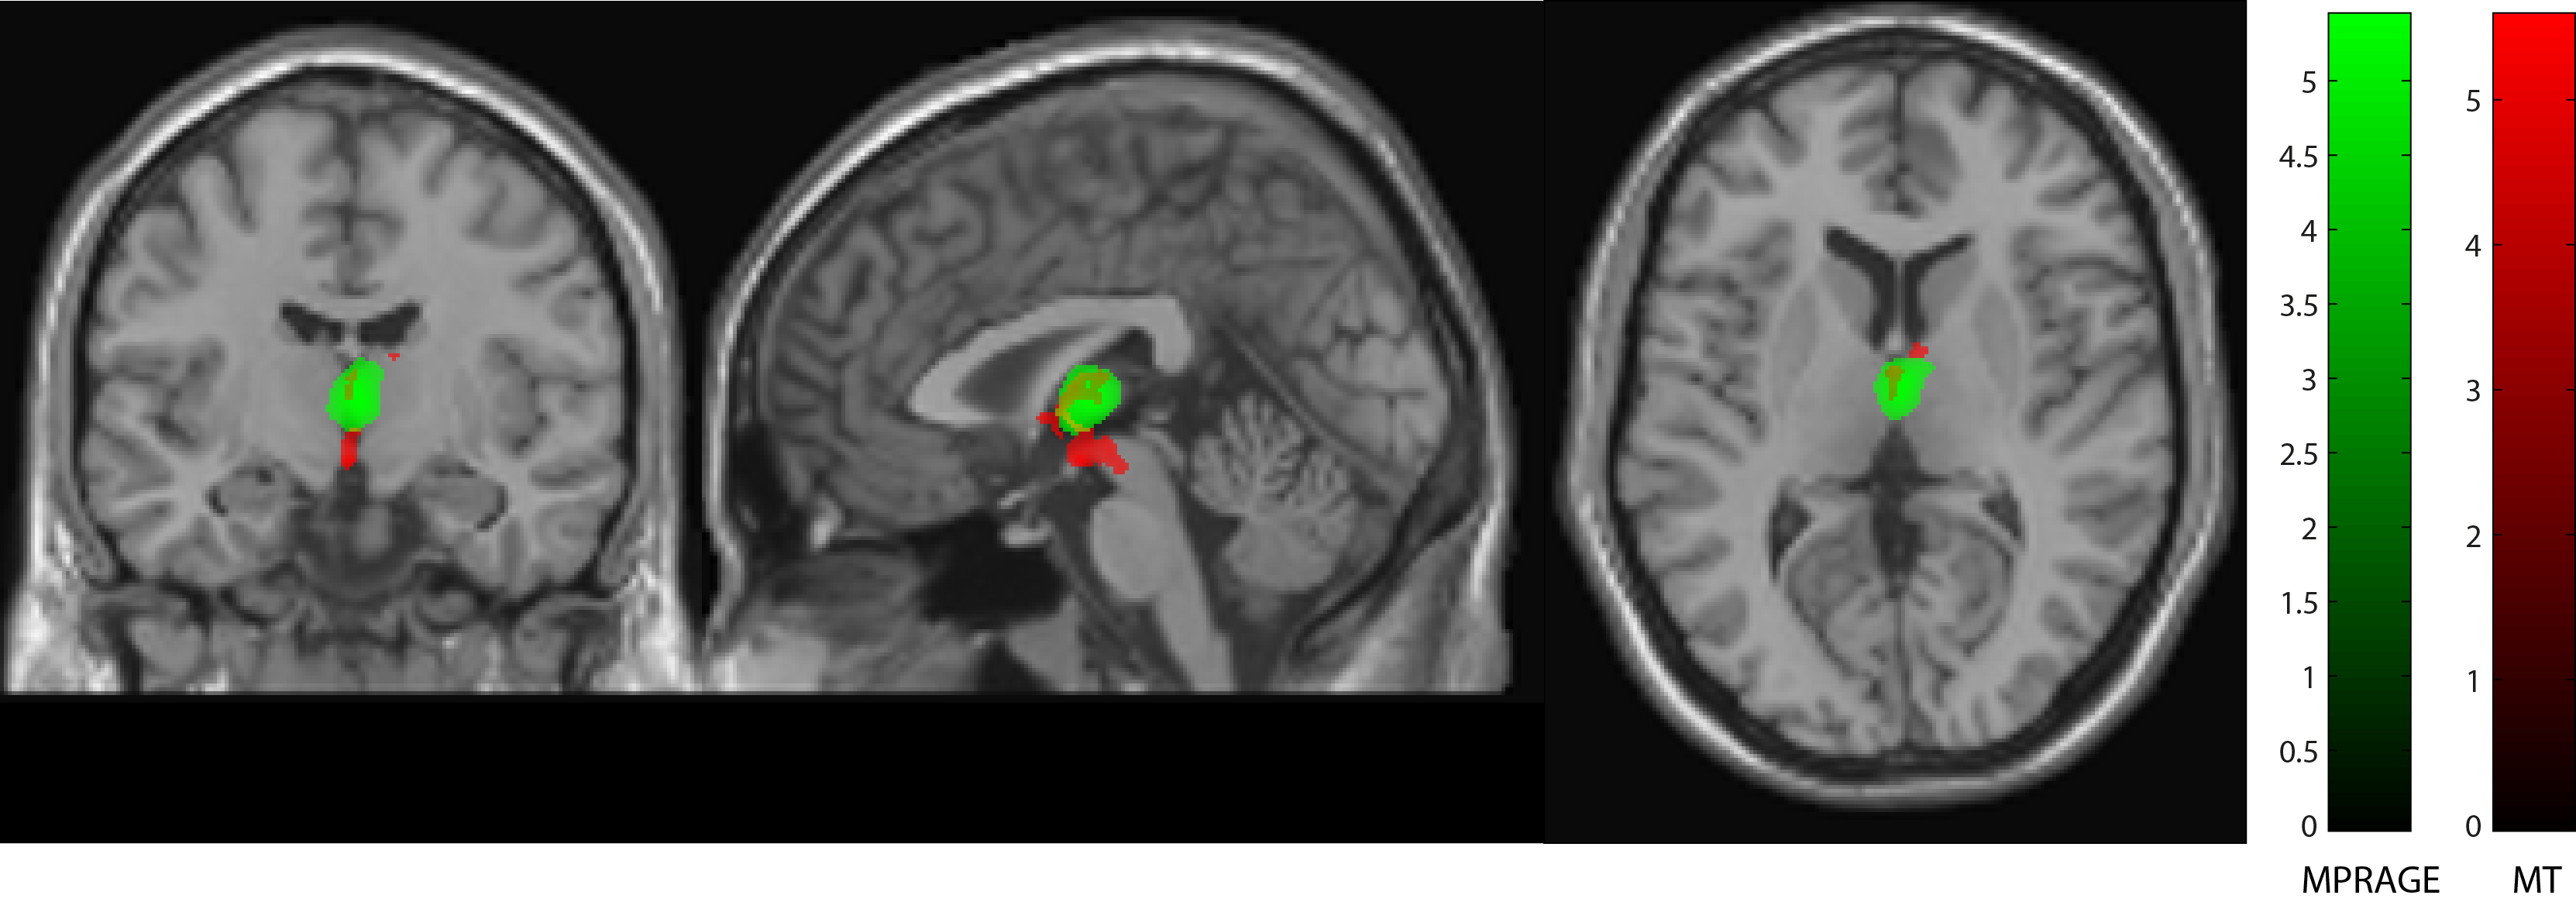
All spinal cord parameters (SCA, APW, LRW, MT, T1 and R2*) were significant lower in patient compared to controls (p<0.001). SCA (p = 0.0001) and APW (p = 0.0008) were significantly lower in tetraplegics compared to paraplegics. Higher lesion level was associated with greater SCA (p= 0.011, R2 = 0.570, n = 30) and APW (p= 0.005, R2 = 0.532, n = 30) decreases. In the brain no significant changes between tetraplegic and paraplegic patients were evident. However significant changes were found between patients and controls. In particular, grey matter volume (z score = 4.72, p=0.007) and myelination sensitive MT (z score =4.71, p < 0.001) were reduced in right thalamus. Furthermore, MT was reduced in the right precentral gyrus (z score = 4.25, p = 0.003) and R1 in the right postcentral gyrus (z score = 5.51, p < 0.001) in patients when compared to controls. Furthermore, R1 reductions were evident in the left cerebellum exterior (z score = 5.22, p < 0.001), left cerebellum (z score= 4.11, p = 0.001) and, left anterior insula (z score = 3.83, p = 0.019). In patients, a greater decreases in APW (p = 0.049, r2 = 0.37) and MT (p = 0.006, r2 = 0.46) was associated with pinprick score while a greater decrease in MT (p = 0.022, r2 = 0.25) and R1 (p = 0.007, r2 = 0.32) was associated with SCIM score. The myelin sensitive R1 in the motor cortex was associated with lower limb motor score (p<0.001); R2* was associated negatively with both upper limb motor score in cerebellum grey matter (p=0.042).
Discussion and conclusion
In this study both structural and quantitative MRI protocols were used to assess lesion level effects on neurodegeneration above the level of injury in SCI patients. It was found that lesion level drives structural changes associated with neurodegeneration in the spinal cord but not brain. In particular spinal cord atrophy was more pronounced in tetraplegics compared to paraplegics, and the change was preferentially in anterior-posterior direction. These results suggest pronounced Wallerian degeneration within the dorsal columns with higher lesion levels. Interestingly, lesion level had no effect on neurodegenerative changes within the brain suggesting that supraspinal changes are less affected by the amount of disconnected neurons as they are still embedded in pre-exisiting neuronal circuits5.Acknowledgements
No acknowledgement found.References
1. Helms G, Dathe H, Kallenberg K, Dechent P. High-resolution maps of magnetization transfer with inherent correction for RF inhomogeneity and T1 relaxation obtained from 3D FLASH MRI. Magn Reson Med. 2008;60(6):1396-1407. doi:10.1002/mrm.21732.
2. Weiskopf N, Lutti A, Helms G, Novak M, Ashburner J, Hutton C. Unified segmentation based correction of R1 brain maps for RF transmit field inhomogeneities (UNICORT). Neuroimage. 2011;54(3):2116-2124. doi:10.1016/j.neuroimage.2010.10.023.
3. Ashburner J, Csernansky JG, Davatzikos C, Fox NC, Frisoni GB, Thompson PM. Computer-assisted imaging to assess brain structure in healthy and diseased brains. Lancet Neurol. 2003;2(2):79-88. doi:10.1016/S1474-4422(03)00304-1.
4. Weiskopf N, Suckling J, Williams G, et al. Quantitative multi-parameter mapping of R1, PD*, MT, and R2* at 3T: A multi-center validation. Front Neurosci. 2013;7(7 JUN):1-11. doi:10.3389/fnins.2013.00095.
5. Wrigley PJ, Siddall PJ, Gustin SM. New evidence for preserved somatosensory pathways in complete spinal cord injury: A fMRI study. Hum Brain Mapp. 2017;00(October). doi:10.1002/hbm.23868.
Figures