5394
Normalised Grey Matter and White Matter Volumes in the Neurologically Intact Conus Medullaris1Queen Square MS Centre, Department of Neuroinflammation, UCL Institute of Neurology, Faculty of Brain Sciences, University College London, London, United Kingdom, 2Uro-Neurology, The National Hospital for Neurology and Neurosurgery and UCL Institute of Neurology, London, United Kingdom, 3MRI 3T Research Centre, C. Mondino National Neurological Institute, Pavia, Italy, 4Brain and Behavioural Sciences, University of Pavia, Pavia, Italy
Synopsis
Magnetic Resonance Imaging derived measures of spinal cord (SC) grey matter (GM) and white matter (WM) volume are useful for indirectly assessing neurodegeneration over time (i.e. atrophy). However, for the correct interpretation of such morphometric analyses, one must take into consideration the natural variability that exists between subjects, which is unrelated to a disease process. Various normalisation strategies have been proposed for use in the upper SC, but evidence from similar applications in the lower SC is currently lacking. In this work, we present our first approach to normalisation of GM/WM volumes in the neurologically intact conus medullaris.
Introduction
Spinal cord (SC) grey and white matter (GM/WM) volume measures obtained by means of Magnetic Resonance Imaging (MRI) are useful for indirectly assessing the degree of atrophy (i.e. axonal loss) over time in neurological disease. Typically, these measures are obtained from the upper SC and are subsequently normalised in order to remove differences between subjects that are unrelated to a disease process. Such normalisation approaches are useful for improving statistical power for group comparisons and were first proposed in brain investigations. Recently, the feasibility of obtaining reliable GM/WM measures in the conus medullaris (CM) has been demonstrated1, opening up the possibilities to investigate the origins of symptoms such as sexual and bladder dysfunction, which are common in neurological disease. Extending the previous investigations of brain and upper SC volume normalisation to the CM is thus essential, and defines the main purpose of this work.Method
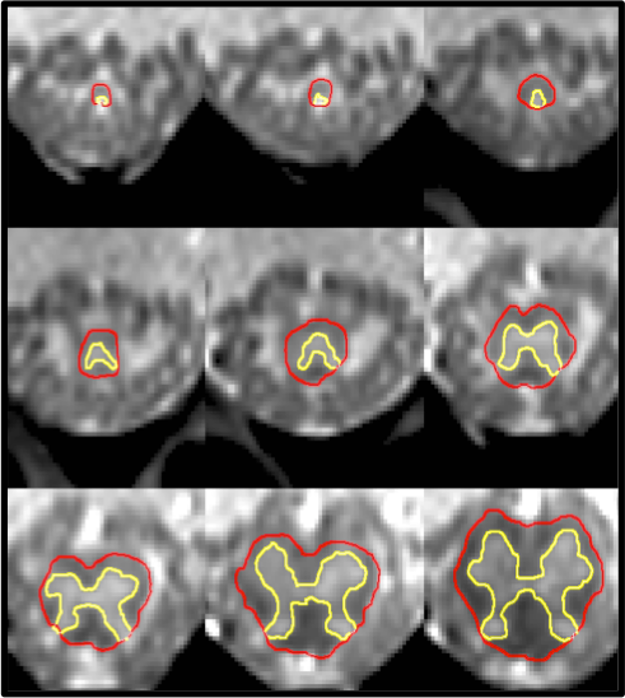
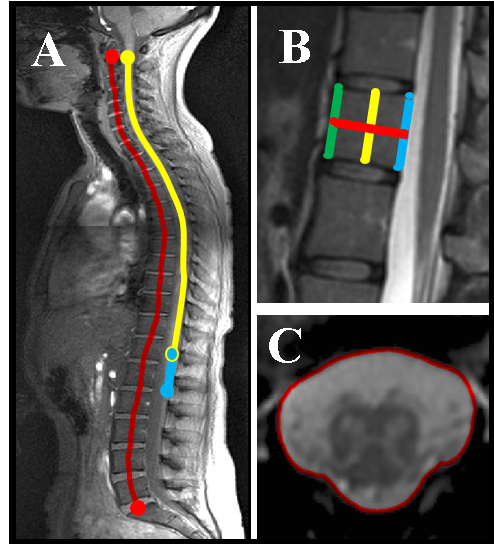
1) Participants: 23 healthy controls (HC) were recruited (mean age 47 years, 11 female, range 25-73). Informed consent was obtained from all participants and the study was approved by local ethics; 2) MR imaging: Using a Philips Achieva 3T and the product 15-channel SENSE spine coil, the lumbosacral SC was imaged axially with the slices perpendicular to the cord using a fat-suppressed 3D fast field echo sequence as follows: repetition time = 23 ms; echo time = 4.4 ms, flip angle α = 10°, field of view = 180 × 180 mm2, voxel size = 0.5 × 0.5 × 5 mm3, number of averages = 8, 19 slices and scanning time of 19:27 min. The first slice of the volume was positioned at the superior margin of the T11 vertebral body with the volume extending caudally towards the inferior margin of the L1 vertebral body covering both the lumbosacral enlargement (LSE) and CM in all subjects; 3) Image analysis: Image segmentation of the tapered lower end of the SC for total volume estimation of the CM (T-CMV), GM (T-GM-CMV) and WM (T-WM-CMV) was performed manually using JIM 6.0 (http://www.xinapse.com) as follows: the slice with the largest cross-sectional area between T11-L1 was first identified (LSE slice)2, and this was subsequently segmented along with all the remaining consecutive slices moving caudally from the LSE slice towards the tip of the CM (Figure 1). Normalisation metrics such as the thecal-sac cross-sectional area at T12 vertebra (TS_CSA_T12), the spine length from C2-L5 (Length_C2-L5), cord length from the LSE to the tip of the CM (Length_LSE_CMtip), cord length from C2 to the tip of CM (Length_C2_CMtip), cord length from C2 to the LSE (Length_C2_LSE), T12 anterior height (T12_AH), T12 central height (T12_CH), T12 posterior height (T12_PH) and T12 anteroposterior length (T12_AP) were obtained from a high resolution T2-weighted acquisition (Figure 2). 4) Statistical analysis: Normative T-CMV/T-GM-CMV/T-WM-CMV values were obtained and the potential effects of age, gender and normalisation covariates were investigated. First, gender effects were explored using analysis of covariance. In addition, multiple regression analysis was used to further explore the effect of age, gender and body height. Using the Pearson’s correlation coefficient, all spine and SC metrics having a coefficient greater than 0.45, with at least two of the three volume measures, were selected for subsequent normalisation using a previously described regression-based residual method3. The effect of normalisation by a particular regression model was assessed by comparing the per cent coefficient of variation (% COV) of each CM tissue volume before and after normalisation.Results
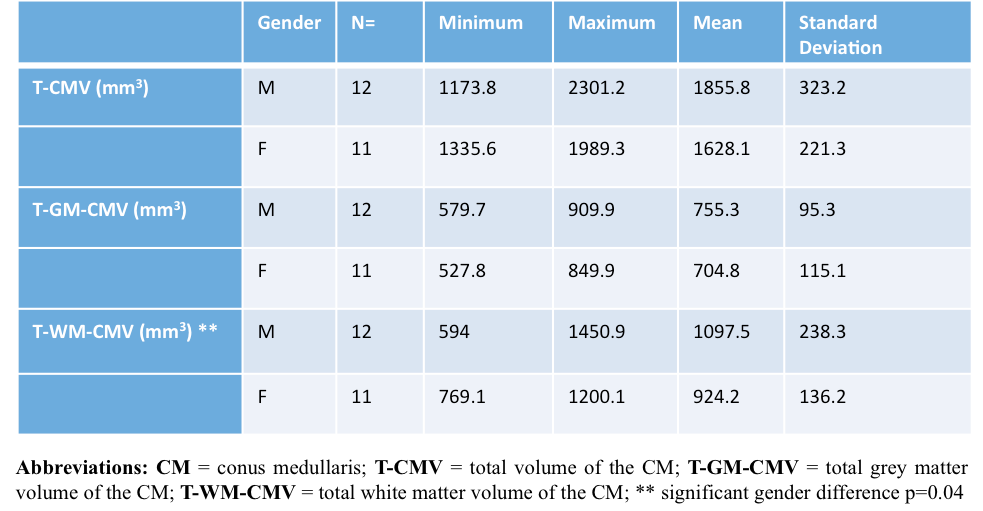
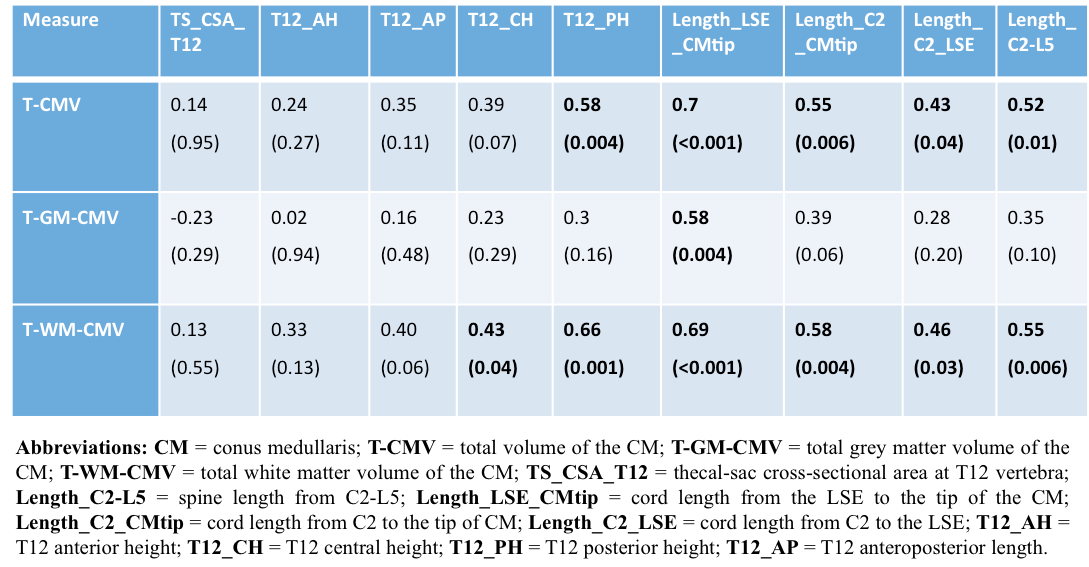
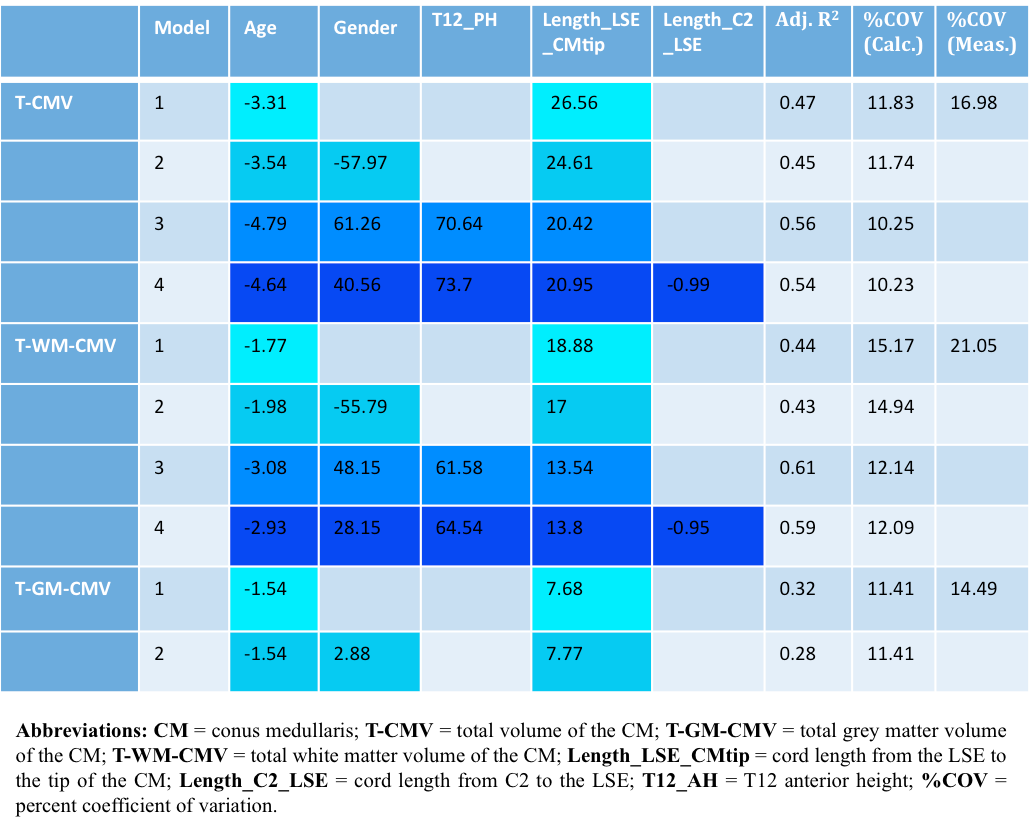
Table 1 summarizes the CM tissue-specific volumes by gender in 23 HC. In general, males had higher volumes than females, with significantly higher T-WM-CMV when adjusted for age. Results from the multiple regression analysis showed that gender and weight contributed the least in explaining the variance in volumes followed by height and age. Table 2 shows results from correlations between the CM volume measures and the spine and SC metrics, with the highest coefficients shown used in subsequent normalisations. Table 3 shows the %COV reductions per CM tissue-type for each model (i.e. combination of spine and SC metrics) with the highest adjusted R2 value.Discussion and Conclusion
In this work we have presented normative tissue-specific volumes in the CM obtained from a large number of healthy subjects and we have demonstrated the influence of age, gender, body height and weight on the observed inter-subject variability in these measures. In addition, we have presented a normalisation approach for the tissue-specific volumes by exploring various spine and SC metrics, demonstrating the feasibility of reducing the inter-subject variability considerably, thus enabling more effective future assessment of differences between health and neurological disease.Acknowledgements
The UK MS Society and the UCL-UCLH Biomedical Research Centre for ongoing support.
MDL received funding from the Swiss National Science Foundation (fellowship P2EZP3_148749 & P300PB_161087), joint research funding from UCL and the Neuroscience Center Zürich, and the UK Multiple Sclerosis Society. This work was also supported by the Medical Research Council, the UK Multiple Sclerosis Society (grant 892/08), the Brain Research Trust and by Capital Project number R&D03/10/RAG0449 from NIHR BRC UCLH/UCL.
CGWK received funding from ISRT, Wings for Life and the Craig H. Neilsen Foundation for the INSPIRED study.
References
1) Liechti M, Budtarad N, Altmann D et al. Feasibility of Grey Matter and White Matter Segmentation of the Conus Medullaris: A Pilot in Vivo Investigation in the Neurologically Intact Spinal Cord. In: Proc. Intl. Soc. Mag. Reson. Med. 25, 4675.
2) Yiannakas MC, Kakar P, Hoy LR et al. The Use of the Lumbosacral Enlargement as an Intrinsic Imaging Biomarker: Feasibility of Grey Matter and White Matter Cross-Sectional Area Measurements Using MRI at 3T. PLoS One 2014;9(8):e105544.
3) Papinutto N, Schlaeger R, Panara V et al. Age, Gender and Normalization Covariates for Spinal Cord Gray Matter and Total Cross-Sectional Areas at Cervical and Thoracic Levels: A 2D Phase Sensitive Inversion Recovery Imaging Study. PloS One 2015;10(3):e0118576.
Figures