5393
Investigating the value of arterial spin labeling (ASL) and intravoxel incoherent motion (IVIM) imaging on the diagnosis of nasopharyngeal carcinoma (NPC) in T1 stage1National Cancer Center/Cancer Hospital, Chinese Academy of Medical Sciences and Peking Union Medical College, Beijing, China, 2GE Healthcare, MR Research China, Beijing, China
Synopsis
T1-stage NPC was difficult to diagnosis using conventional MRI and additional examinations were often needed. This study aimed to investigate ASL and IVIM on diagnosing T1-stage NPC. We measured the BF by ASL and IVIM parameters (D, D*, f, fD*) of T1-stage NPC tumors and nasopharyngeal mucosa of healthy control. The mean BF and D* of T1-stage NPC were higher than those of healthy control. And the BF correlated positively with D* and fD*. Therefore, ASL and IVIM could reflect blood perfusion difference between T1-stage NPC and benign nasopharyngeal mucosa, which is potential to help the early diagnosis of NPC.
Purpose
Patients with T1 staged NPC usually demonstrate nasopharyngeal mucosal thickening without surrounding structures invasion. Using conventional MRI is difficult to accurately diagnosis T1 staged NPC and additional examinations are needed, such as nasopharyngoscope1. Previous studies indicated that the perfusion provided by ASL and IVIM were different between benign head/neck tumor and benign disease/normal muscle2, 3. This study investigated the diagnostic value of ASL and IVIM on T1 staged NPC in comparison to benign nasopharyngeal mucosa.Material
A total of 13 diagnosed T1 staged NPC patients and 14 healthy volunteers were enrolled. MR examinations include 3D peudo-continuous ASL and IVIM imaging. The mean value of ASL based blood flow (BF) and the IVIM derived parameters (pure molecular diffusion, D; pseudo-diffusion coefficient, D*; perfusion fraction, f; the multiplication of the two parameters, fD*) of NPC from patients and nasopharyngeal mucosa from healthy control were analyzed with independent sample t test. Receiver operating characteristic (ROC) curve was used to quantify the diagnostic cutoff and accuracy.Results
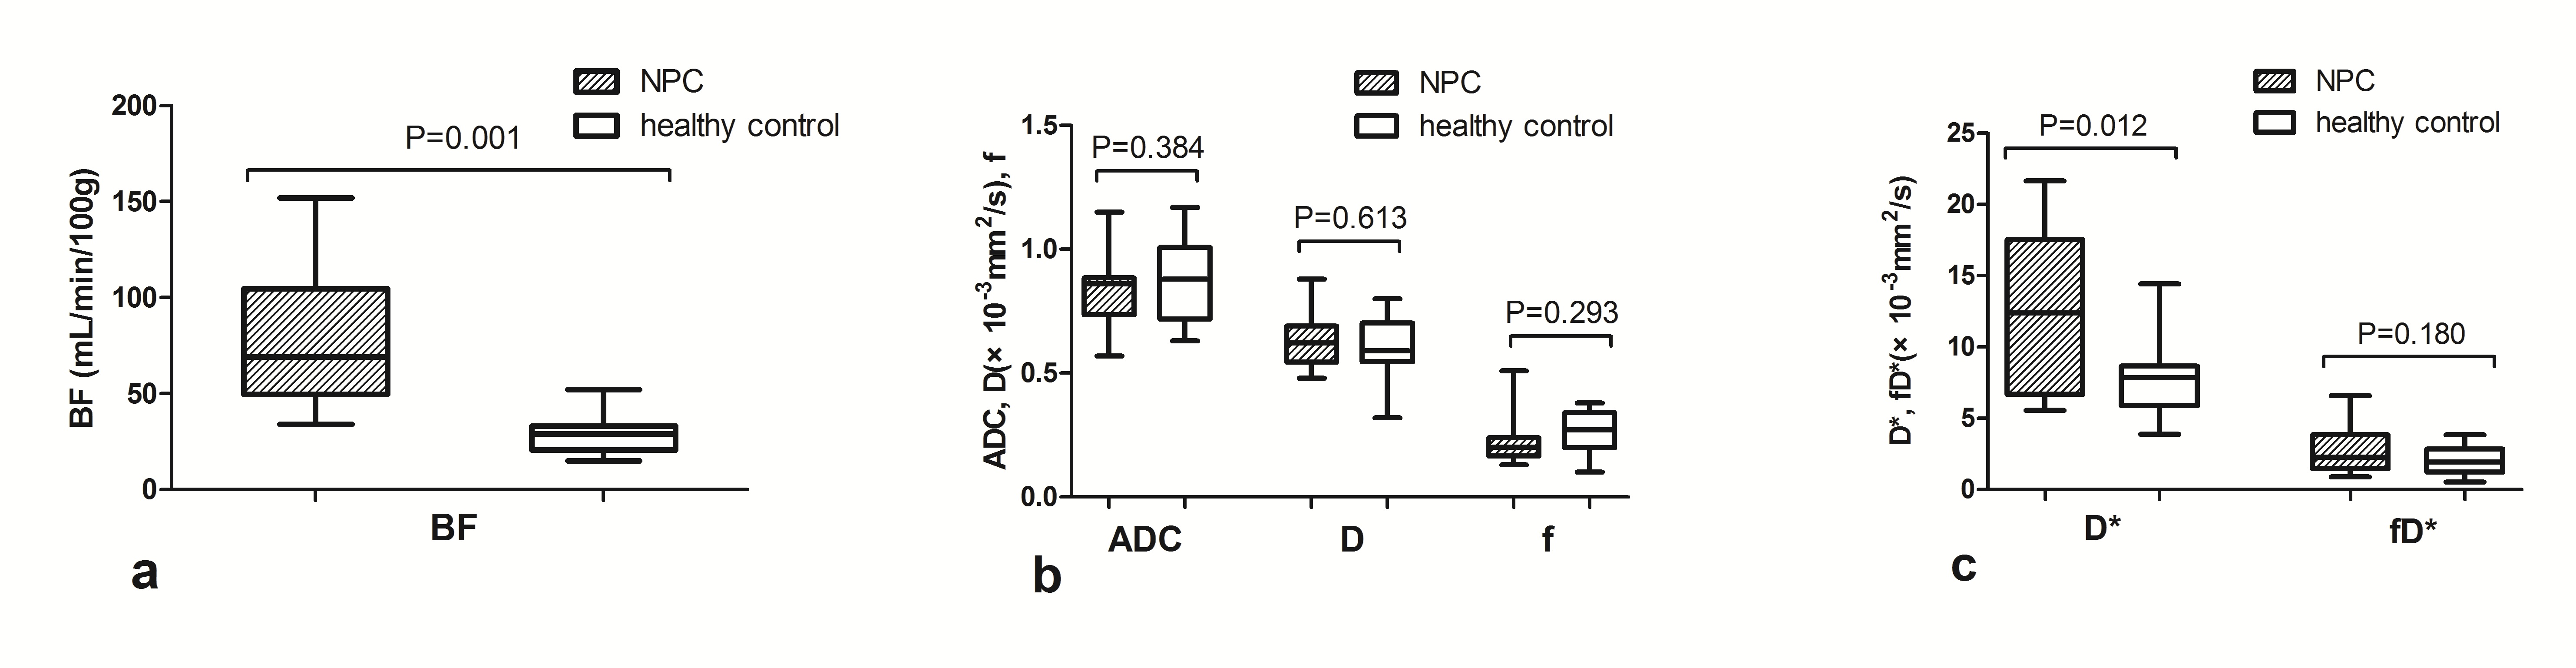
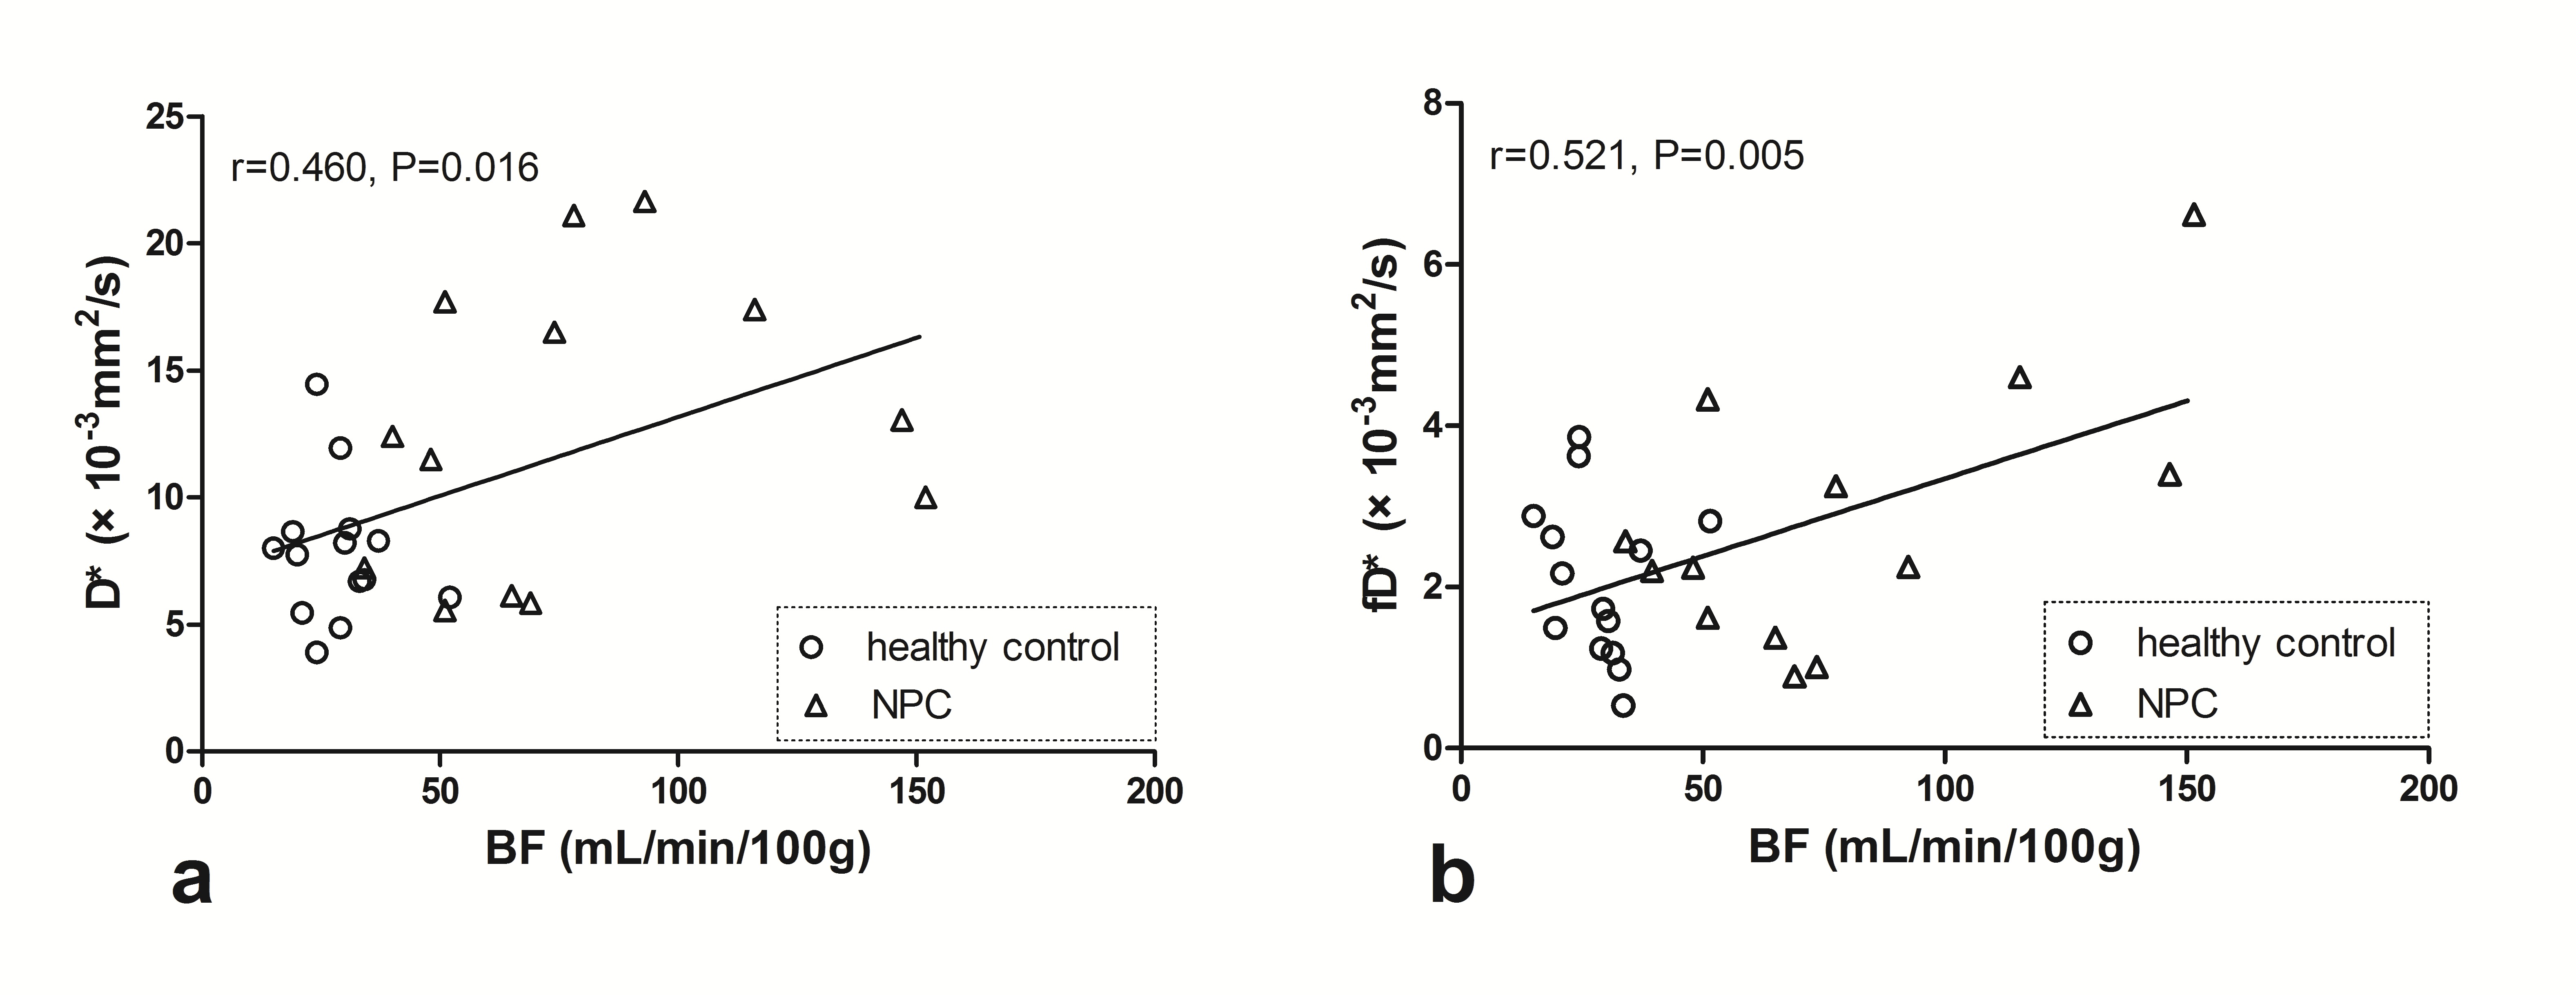
The mean BF and D* of T1 staged NPC from patients were higher than those of nasopharyngeal mucosa from healthy control (78.04±38.47 mL/100g/min vs. 28.46±9.23 mL/100g/min, p value: 0.001, 0.012, Fig.1) with AUC of 0.967 and 0.747, respectively. No statistical difference was found of ADC, D and f value between two groups. Setting the BF cutoff at larger than 34 mL/100g/min, the sensitivity, specificity and accuracy reached 100% (13/13), 85.71% (12/14) and 92.59% (25/27) on differentiating the T1 staged NPC from nasopharyngeal mucosa, respectively. The BF of ASL showed positive correlation with D* and fD* of IVIM (r=0.458 and 0.521, p=0.016 and 0.005, Fig.2).Discussion and conclusion
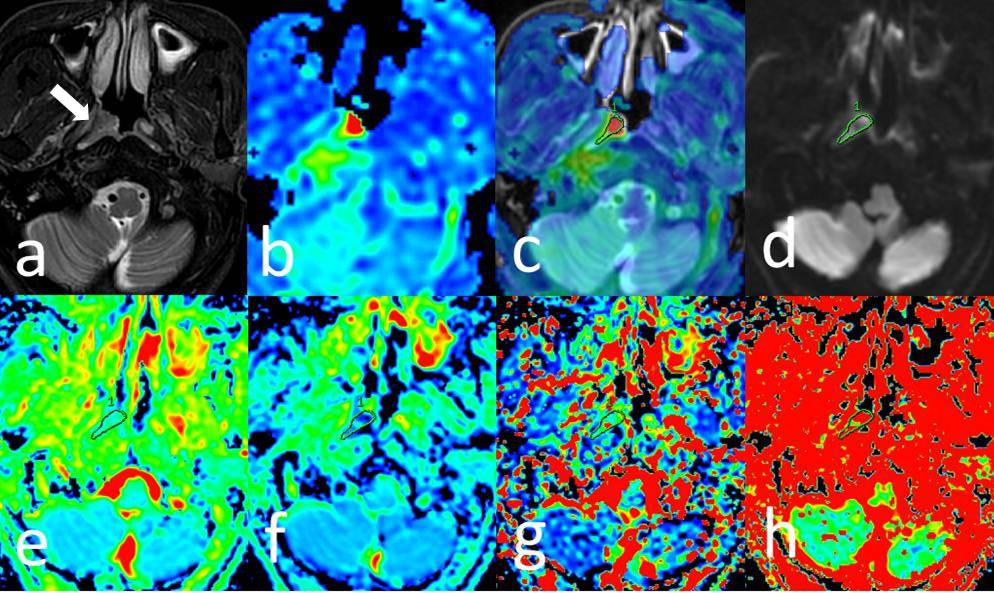
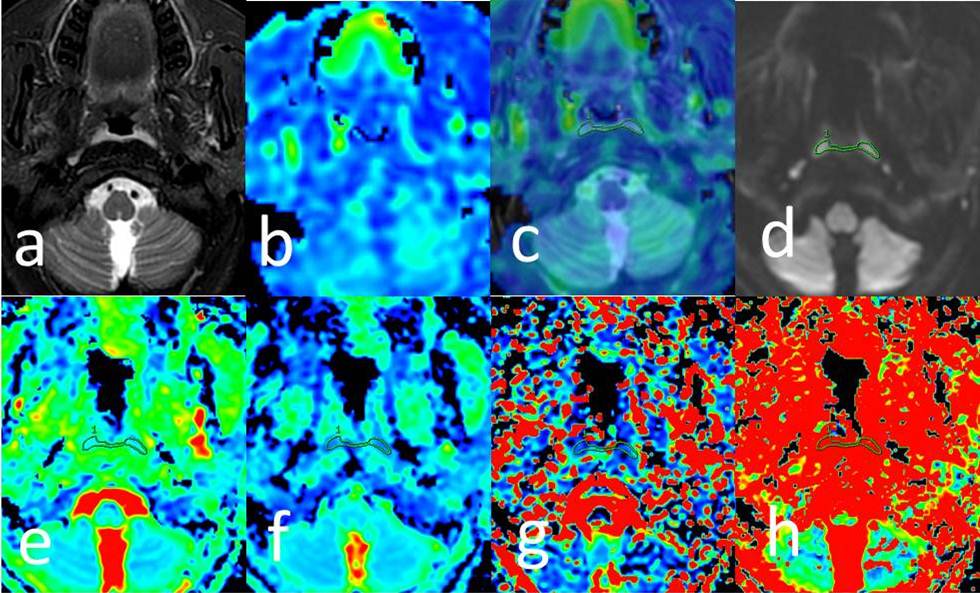
Typical cases of T1 staged NPC and nasopharyngeal mucosa are shown in Fig.3 and Fig.4 respectively. Same as other studies in malignancies with different pathological types and stage of NPC4, 5, the perfusion level was also an important marker to distinguish benign and malignant nasopharyngeal diseases. However, in this study, the ADC and D did not exhibit statistical difference between NPC and nasopharyngeal mucosa, which may be due to relatively slight diffusion restriction in early stage NPC or this limited sample. Therefore, as the non-invasive technique, both ASL and IVIM could be taken as an effective marker to improve the diagnosis accuracy of NPC in early stage. At the same time, ASL seems more promising than IVIM. In addition, BF of tumor and healthy control had slight correlation with D* and moderate correlation with fD*, which suggested that D* and fD* might better reflect the perfusion of nasopharynx tissue than f value.Acknowledgements
No acknowledgement found.References
1. King AD, Vlantis AC, Tsang RK, et al. Magnetic resonance imaging for the detection of nasopharyngeal carcinoma. AJNR Am J Neuroradiol 2006, 27:1288-91.
2. Lin M, Yu X, Ouyang H, et al. Consistency of T2WI-FS/ASL fusion images in delineating the volume of nasopharyngeal carcinoma. Sci Rep 2015, 5:18431.
3. Zhang SX, Jia QJ, Zhang ZP, et al. Intravoxel incoherent motion MRI: emerging applications for nasopharyngeal carcinoma at the primary site. Eur Radiol 2014, 24:1998-2004.
4. Jia QJ, Zhang SX, Chen WB, et al. Initial experience of correlating parameters of intravoxel incoherent motion and dynamic contrast-enhanced magnetic resonance imaging at 3.0 T in nasopharyngeal carcinoma. Eur Radiol 2014, 24:3076-87.
5. Lemke A, Laun FB, Simon D, et al. An in vivo verification of the intravoxel incoherent motion effect in diffusion-weighted imaging of the abdomen. Magn Reson Med 2010, 64:1580-5.
Figures