5389
Generalised kurtosis imaging approach for glioblastoma evaluation1Neuroimaging, N.N. Burdenko NMRCN, Moscow, Russian Federation, 2Department of Psychology, University of Oslo, Oslo, Norway
Synopsis
Primary brain gliomas are very a widespread type of intra-axial brain tumours. Brain gliomas have different cellular origins and can be differentiated by WHO 2016 classification. The most aggressive type of glioma is the glioblastoma (GB). Thus, a correct and reliable grading of gliomas, in particular, the GB, is critical for a patient treatment and prognosis. Diffusion kurtosis imaging (DKI) has been applied to glioma validation in order to perform non-invasive evaluation. DKI allowed one to obtain information about microstructure and inhomogeneity differentiation. In the present work we demonstrate advantages of generalised DKI approach for GB detection and evaluation.
Introduction
A reliable and accurate tumour grading is an important problem of modern non-invasive imaging techniques1. Current revised WHO 2016 differentiation is based on histopathological and molecular features of the tumour tissue and is combined into integrated diagnosis2. One of the most aggressive form of intra-axial brain tumours is the glioblastoma (GB). Therefore, fast and robust visualisation of GB dynamics plays a decisive role in patient treatment and prognosis. Diffusion kurtosis imaging (DKI) is relatively novel and very promising method for tumour discrimination comparing to the conventional diffusion tensor metrics3,4. Recently, a generalised model of the diffusion signal attenuation was proposed5. Additional parametrisation of the cumulant signal expansion allowed Jensen and colleagues5 significantly to increase a sensitivity of the kurtosis metrics. In the present work we provide comparison between the conventional and generalised kurtosis metrics for clinical applications such as GB detection and evaluation of the glioma heterogeneity.Method and Materials
We scanned two confirmed GB patients on a 3T GE Signa HDxt scanner (GE Healthcare) equipped with a 8 channel head coil. Spin-echo EPI sequence was used, voxel size was 3 mm3, FOV 240 mm2, b-values were 0, 1000 and 2500 s/mm2 with 60 diffusion gradient directions for each non-zero b-value. Informed consent was obtained from the legal representatives of the patients before any study-related procedures. The study was approved by the local ethical committee. The generalised DKI signal model using the cumulant expansion gives5:
$$ ln[S(b,α)] = ln[S_0] - bD + \frac{K}{6} · D^2b^2 + (α-1) \frac{K^2}{54} · D^3b^3 + O(b^4)$$
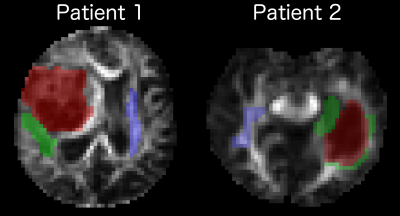
In a special case α = 1, Eq. (1) reduces to the conventional DKI signal model6. For the generalised DKI model we used the α = 2/7. Estimation of the conventional kurtosis metrics was performed using a linear weighted algorithm6 and generalised kurtosis metrics were estimated by a non-linear constrained optimisation algorithm exploiting the in-house Matlab scripts (MathWorks, Natick, MA USA). Three regions of interest (ROI) were manually segmented by the trained neuroradiologist for each patient: tumour, edema, and contralateral normal appeared white mater (NAWM) (see Fig. 1).
Results
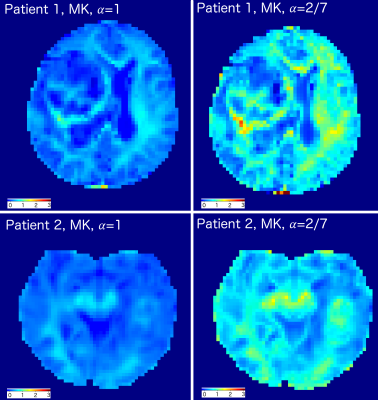
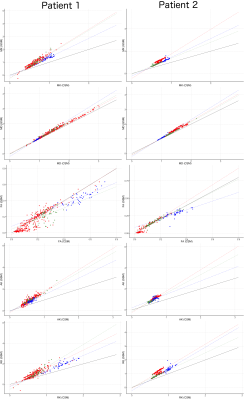
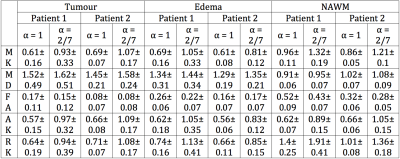
The estimated mean values and standard deviations of the scalar diffusion metrics for each ROIs are presented in Table 1. Note, that all mean DKI values of generalised model were 25-40% higher than for conventional DKI model. The estimated MK maps for both models are shown in Fig. 2. The scatter plots of the estimated diffusion scalar metrics for different ROIs are presented in Fig.3. We performed the Mann-Whitney tests for the diffusion values from the different ROIs. The statistical results for the DKI models are presented in Table 2.Discussion
Diffusion kurtosis imaging is used for a better visualisation and microstructure evaluation of gliomas, in particular, in the case of GB. The generalised DKI metrics proved their higher sensitivity comparing to the conventional DKI metrics in the microstructure and heterogeneity evaluations in tumour and edema vs normal white matter. In contrast to the conventional diffusion metrics such as FA or MD, the kurtosis scalar metrics provided additional information about the tumour microstructure and glioma complexity. The generalised MK allowed us to emphasise the structural changes in tumour and edema (see Fig. 2). Quantitative DKI metrics highlighted the heterogeneous tissue changes in glioma and performed a useful basis for the comparison with NAWM values (see Tabs. 1,2). We have to emphasise that the significant improvements in the tumour tissue detection are done due to the generalised DKI model (see Figs. 2 and 3). In particular, the generalised DKI metrics allowed us to strengthen the contrast between tumour and edema values (see Figs. 2 and 3).Conclusion
The generalised kurtosis model of the diffusion signal attenuation demonstrated its superiority in the case of GB evaluation. The general kurtosis metrics such as mean, axial or radial kurtosis can be used for finer and reliable glioma differentiation in accordance with the WHO 2016 grades.Acknowledgements
No acknowledgement found.References
[1] Maximov et al., Phys. Med. 40 (2017) 24.
[2] Lous et al., Acta Neuropathol. 131 (2016) 803.
[3] Hempel et al., J Neuroradiol. (2017) S0150-9861 (17) 30172.
[4] Jiang et al., Oncotarget 6 (2015) 42380.
[5] Jensen et al., Proc. ISMRM (2017) 1731.
[6] Veraart et al., Neuroimage 81 (2013) 335.
Figures


