5388
Spatially constrained mathematical models for diffusion weighted imaging of prostate cancer xenografts in mice: evaluation of therapy response1Department of Future Technologies, University of Turku, Turku, Finland, 2Department of Diagnostic Radiology, University of Turku, Turku, Finland, 3A.I. Virtanen Institute for Molecular Sciences, University of Eastern Finland, Kuopio, Finland, 4Turku PET center, Turku, Finland, 5Department of Oncology and Radiotherapy, Turku University Hospital, Turku, Finland
Synopsis
Tumor growth in mice preclinical prostate cancer model (human prostate cancer cells, PC-3) was followed for 4 weeks by weekly DWI in control group (n=10) and treatment group (n=9) receiving Docetaxel. DWI data sets were acquired using 12 b-values the range of 0-2000 s/mm2. The DWI signal decays were fitted using monoexponential, biexponential, kurtosis and stretched exponential models/functions. Independent least squares fitting and spatially constrained Maximum Penalized Likelihood Estimation have been applied. The spatially constrained Maximum Penalized Likelihood Estimation revealed the effect of treatment in mice subjects, while conventional LSQ fitting failed to reveal significant difference between control and treatment.
Purpose
To evaluated prostate cancer (PCa) tumor progression and treatment using spatially constrained Maximum Penalized Likelihood Estimation (MPLE) for diffusion weighted imaging (DWI) of prostate cancer xenografts in mice.Materials and Methods
Human prostate cancer cells, one million PC-3 (Anticancer Inc., USA), were inoculated subcutaneously in immunodeficient mice (n=19, HSD: Athymic Nude Foxn 1nu, Harlan Laboratories, Indianapolis, IN, USA). The mice were divided into 2 groups: 1. control group (n=10), 2. treatment group (n=9). The treatment group received Docetaxel (Docetaxel, Actavis, Espoo, Finland) given once a week for three weeks as i.p. injections. The dose was 15mg/kg. Tumor growth in both of the groups was followed by weekly MRI examinations under using a 7T MR scanner (7T Pharmascan, Bruker GmbH, Ettlingen, Germany), a 72 mm volume transmitter (Bruker GmbH) and 10 mm surface receiver coil (Bruker GmbH). Multislice T2-weighted anatomical images covering the whole tumor area were obtained using the following parameters. TR/TE 2500/33 ms, FOV = 30 × 30 mm2, matrix size 256 × 256, slice thickness 1 mm. The whole tumor was visualized. T2-weighted anatomical images were used to to localize a slice with maximum tumor diameter for DWI measurements. Diffusion weighted single shot spin-echo echo planar imaging was applied with the parameters: TR/TE 3000/30 ms, FOV 30 × 15 mm2, matrix 128 ×64, slice thickness 1 mm, three orthogonal diffusion directions, and two different sets of b-values: low b-value set b-value set (12 b-values in total): 0, 100, 300, 500, 700, 900, 1100, 1300, 1500, 1700, 1900, 2000 s/mm2. For further analysis, the mean value of the signal from three directions was calculated. The following four mathematical functions/models were applied to the DWI signal obtained using low and high b-values:
1. Mono-exponential model (1): $$S(b)=S_{0}e^{-bADC_{m}}$$ Eq. 1
2. Stretched exponential model (2): $$S(b)=S_{0}e^{-bADC^{\alpha}}$$ Eq. 2
3. Kurtosis model (3): $$S(b)=S_{0}(e^{-bADC_{k}+1/6b^{2}ADC_{k}^{2}K})$$ Eq. 3
4. Bi-exponential model for high b-values (4): $$S(b)=S_{0}(fe^{-bD_{f}}+(1-f)e^{-bD_{s}})$$ Eq. 4
The DWI signal decay of each individual voxel has been fitted using four mathematical functions/models, as described above, to generate parametric maps of the parameters. The fitting procedure on voxel level, least square fitting (LSQ), has been performed using the Levenberg–Marquardt algorithm in Python programming language and following multiple initialization values to prevent local minima in the fitting procedure. Furthermore, all of the parameters except of the Mono-exponential model’s parameter (ADCm) have been fitted by spatially constrained Maximum Penalized Likelihood Estimation (MPLE).
Under the assumption that the real and imaginary parts of the image are corrupted by Gaussian noise, the magnitude data is estimated to follow Rician distribution:
$$p(Y_{v}|\theta_{v})=\frac{Y_{v}}{\sigma^2}exp(-\frac{Y_{v}^2+F_{v}^2}{2\sigma^2})I_{0}(\frac{Y_{v}F_{v}}{\sigma^2})$$ Eq. 5
Where $I{0}$ is the modified first order Bessel function of the first kind and $\sigma^2$ is the noise variance.
The joint PDF of $ F{v}$’s is the likelihood function of the sample, the log likelihood function of the Rician distributed image is written as: $$ logL\sim \sum_{i=1}^{N} log I_{0}(\frac{Y_{v}F_{v}}{\sigma^2})-\sum_{i=1}^{N}(\frac{F^2}{2\sigma^2})$$ Eq. 6
From which the maximum likelihood estimator can be constructed and parameters set $\theta$ can be estimated according to: $$\theta_v=arg\left \{ \underset{\theta}{max}(logL)\right \}$$ Eq. 7
Maximizing the likelihood provides a sufficient fit to the data but it also can result in fitting the noise within data. A shrinkage approach is required to minimize the effect of noisy parameters to the fit. Therefor maximize the penalized log likelihood term given by:
$$\theta_v=arg\left \{ \underset{\theta}{max}(logL-\lambda W R_v)\right \}$$ Eq. 8
The neighborhood kernel used is a $3*3$ matrix. For solving the nonlinear optimization problem of PMLE a Bound Optimization by Quadratic approximation is utilized from the Nlopt python library. For estimation of $sigma^2$ is calculated separately from the images’ background noise.
The effect of treatment against tumor progression was tested with each model parameter by comparing the mean intensity values between the control and the treatment groups. Differences below p<0.01 after correction for multiple comparisons were considered statistically significant.
Results
LSQ based model parameters (Figure 1), ADCm (Mono-exponential), ADCs and Alpha (Stretched exponential), ADCk and K (Kurtosis), Df, Ds and f (Bi-exponential), did not result in any significant separation of control and treatment in any of the 4 weeks. Contrarily, MPLE (Figure 2) based model parameters, ADCm(t=8.280, p<0.01), ADCs(t=8.722, p<0.01) and Alpha(t=-6.077, p<0.01), were able to distinguish between control and treatment groups after three weeks of treatment, and ADCk(t=8.480, p<0.01) after four weeks of treatment. An example of LSQ and MPLE and derived parametric maps is shown in Figure 3.Discussion and Conclusion
MPLE revealed the effect of treatment in mice subjects, where conventional LSQ fitting failed to reveal significant difference between control and treatment. MPLE based Stretched-exponential parameters, ADCs and Alpha were able to show the effect of treatment starting from week 3 of the study.Acknowledgements
No acknowledgement found.References
1. Stejskal EO. Use of spin echoes in a pulsed magnetic-field gradient to study restricted diffusion and flow. J Chem Phys 1965;43;3597–3603
2. Kopf M, Corinth C, Haferkamp O, Nonnenmacher TF. Anomalous diffusion of water in biological tissues. Biophys J 1996; 70:2950-2958.
3. Jensen JH, Helpern JA. MRI quantification of non-Gaussian water diffusion by kurtosis analysis. NMR Biomed 2010; 23:698-710.
4. Mulkern RV, Gudbjartsson H, Westin CF, et al. Multi-component apparent diffusion coefficients in human brain. NMR Biomed 1999; 12:51-62.
Figures
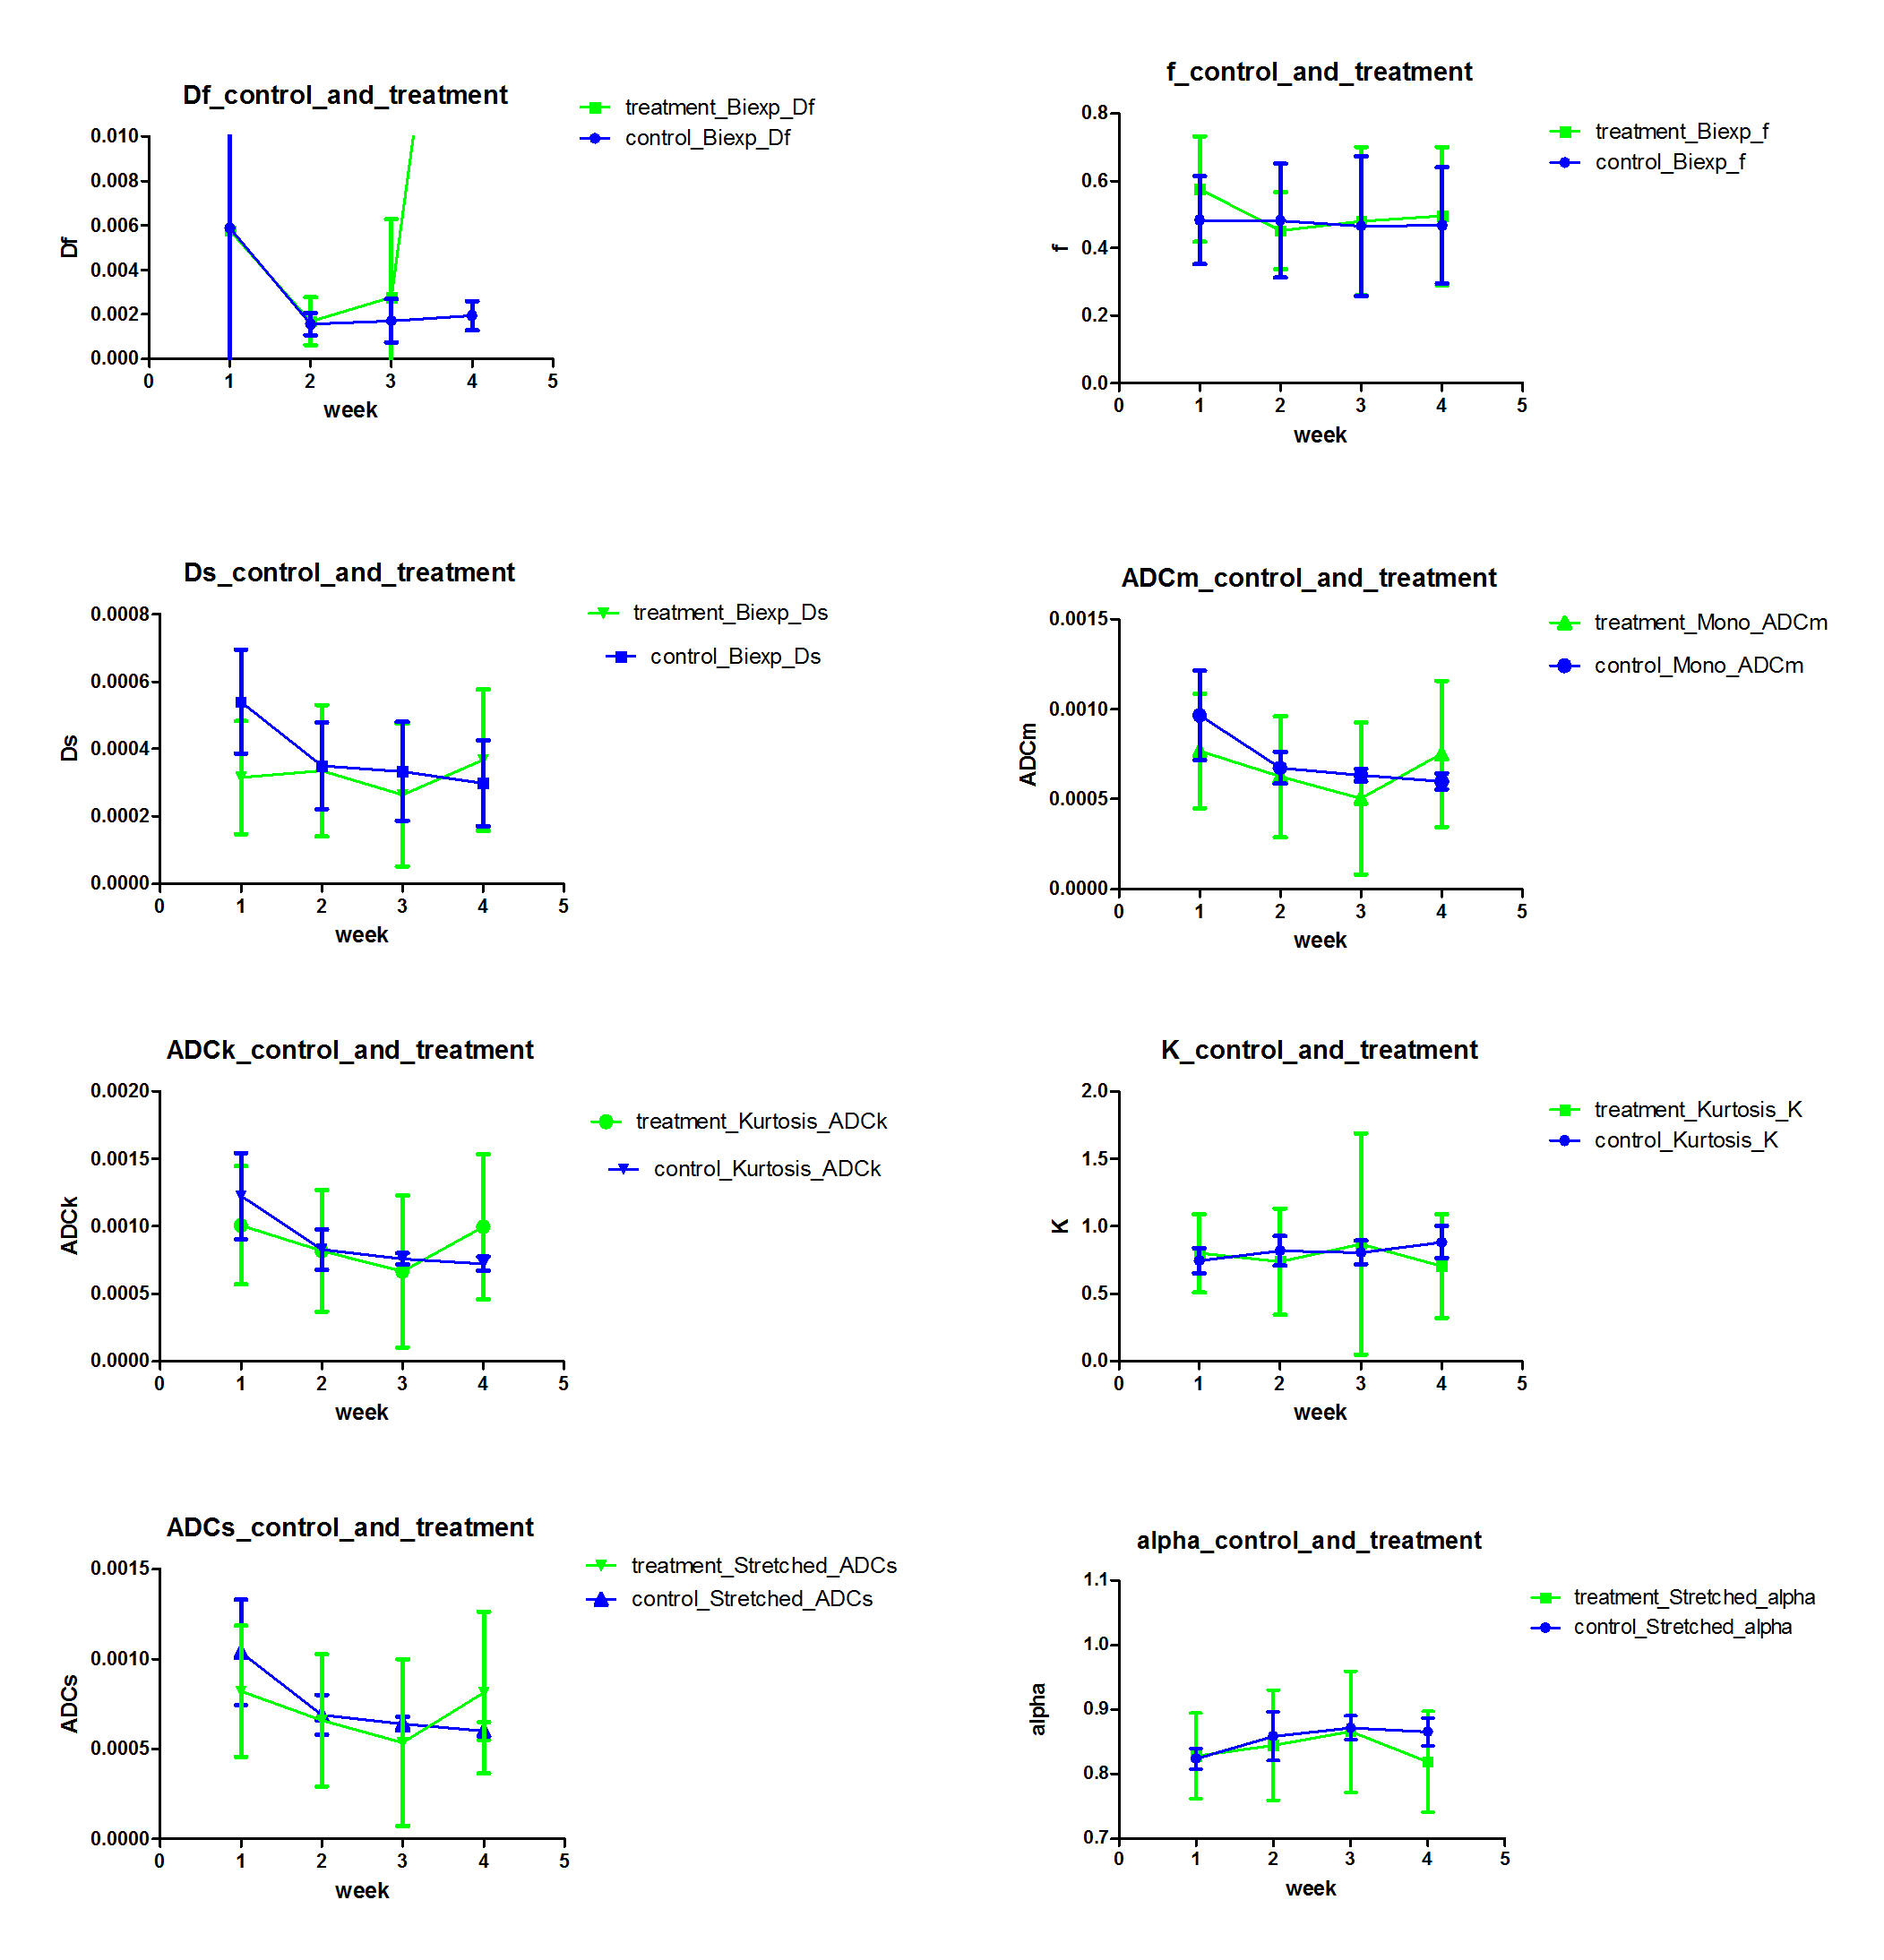
Figure 1
Parameter values estimated using all four mathematical functions/models using independent least square fitting. The error bars extend from minimal to maximal values and box is median value.
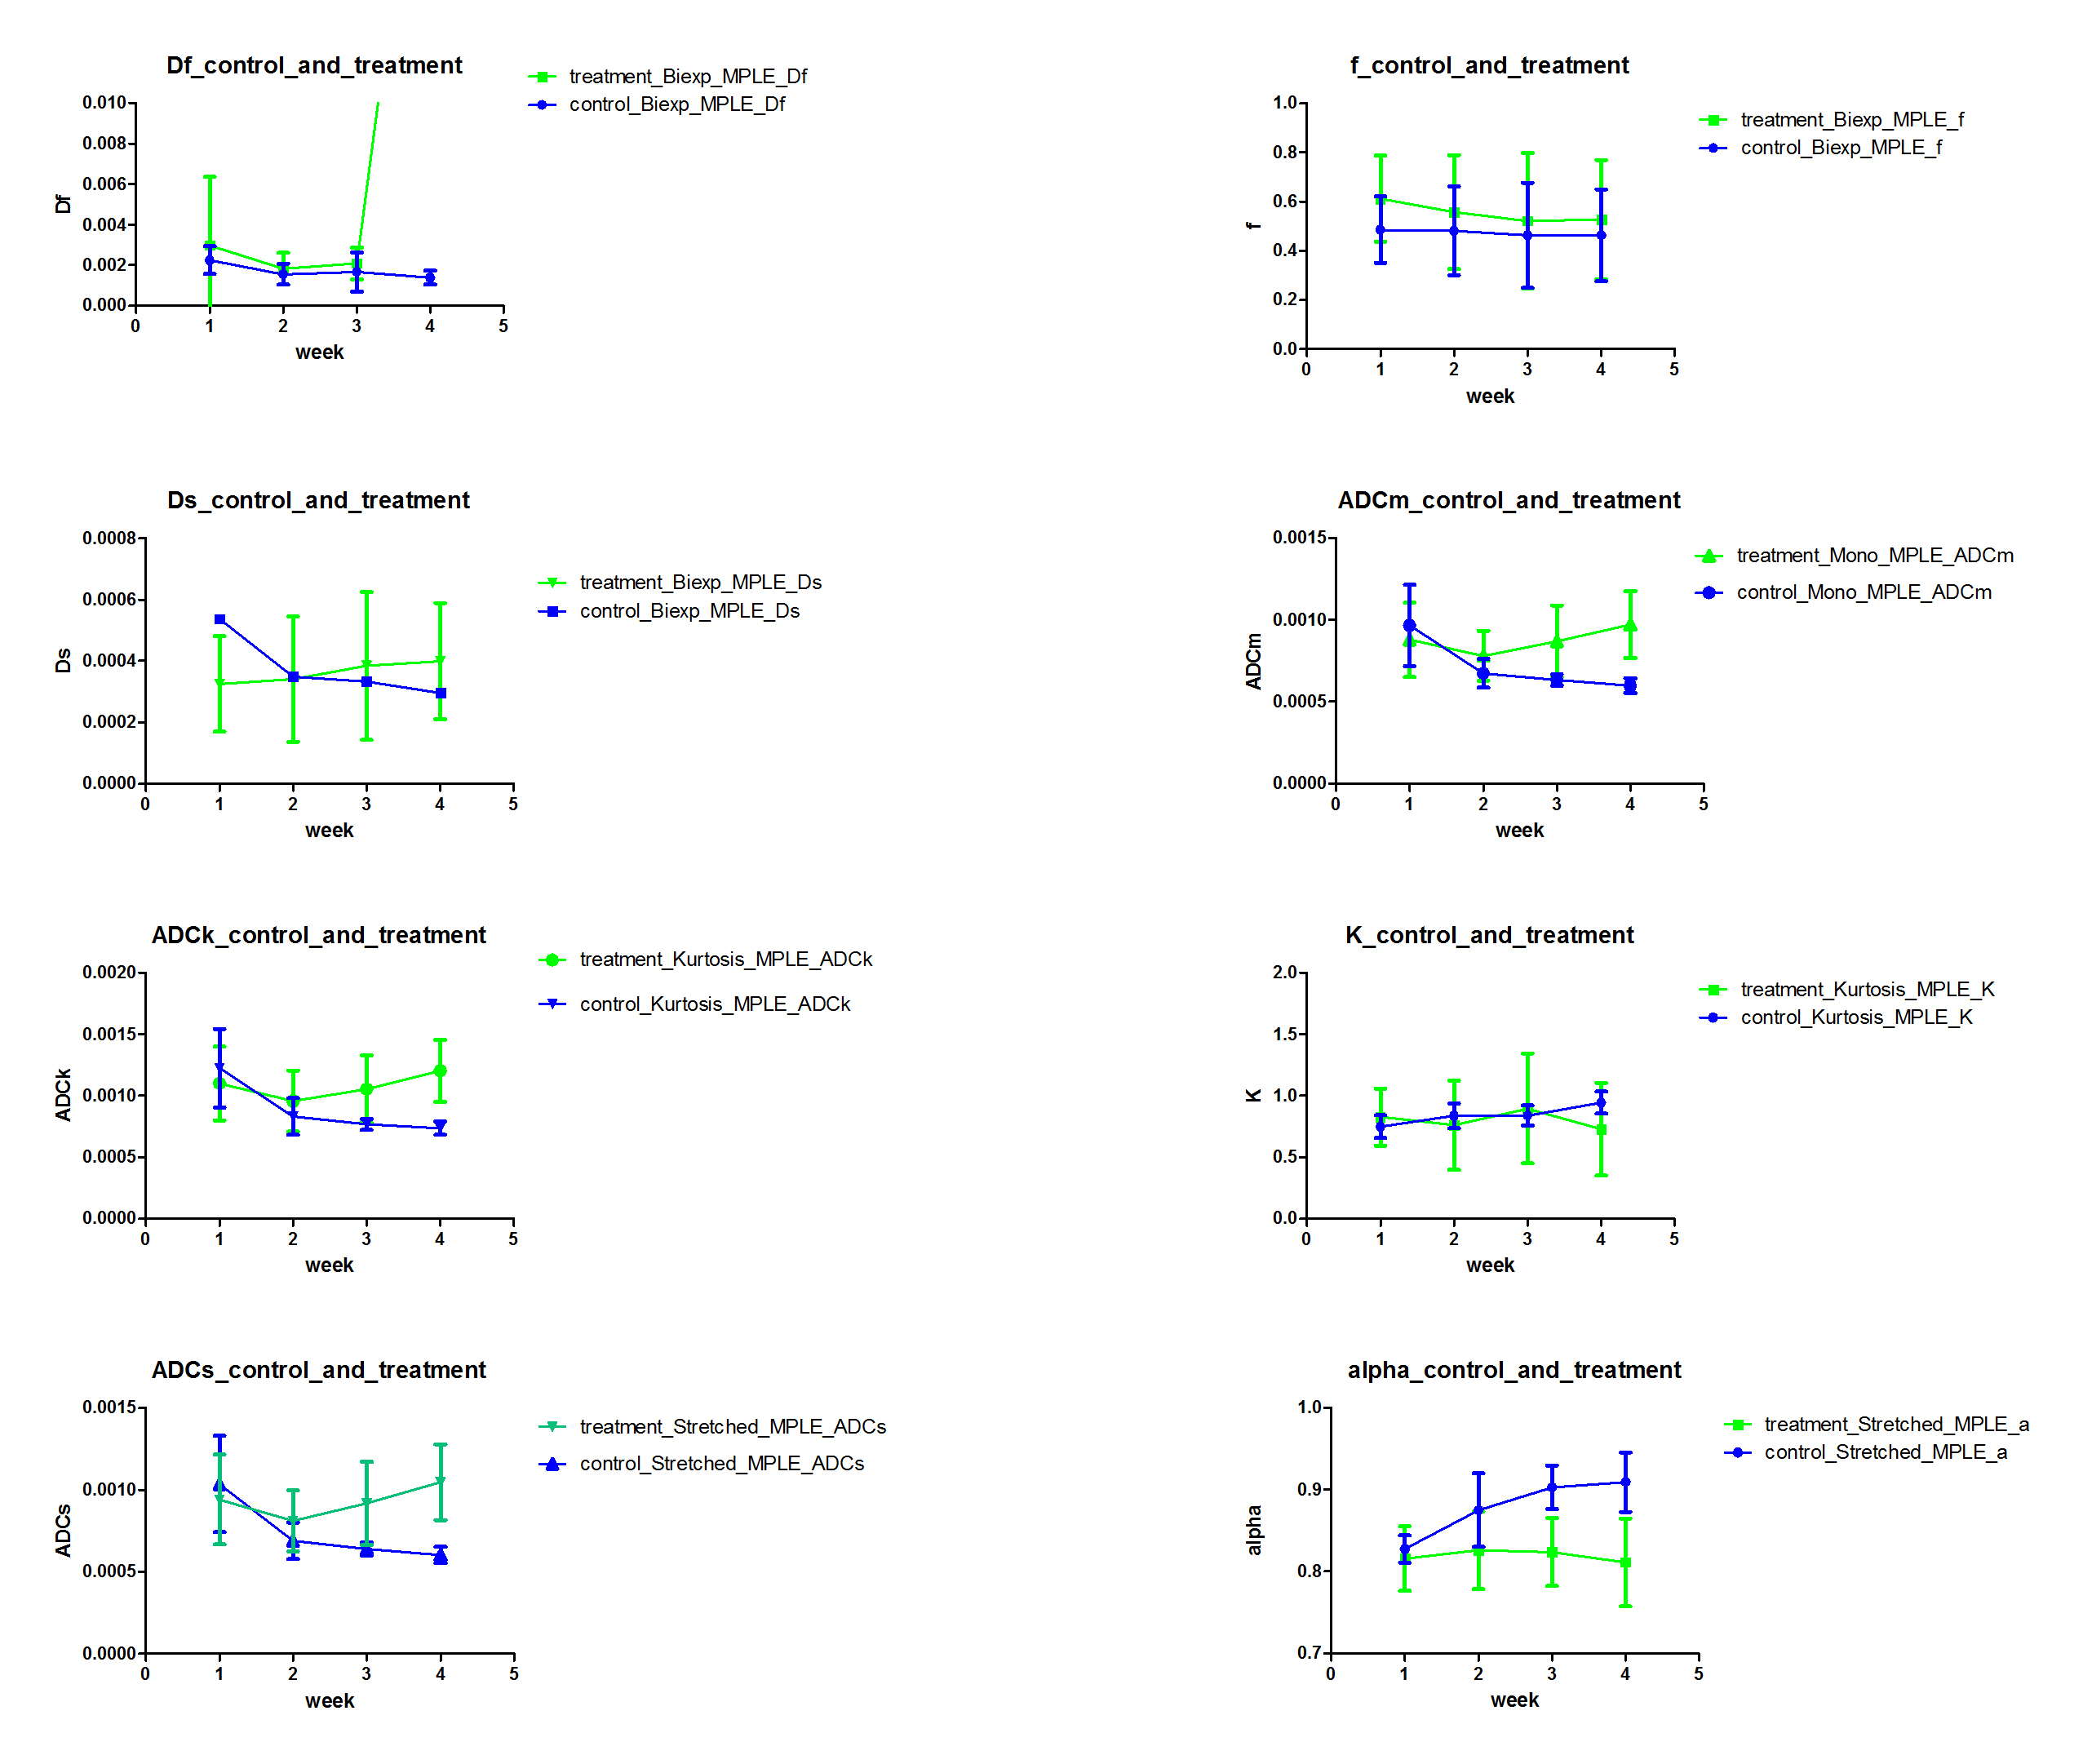
Figure 2
Parameter values estimated using all four mathematical functions/models using spatially constrained Maximum Penalized Likelihood Estimation. The error bars extend from minimal to maximal values and box is median value.
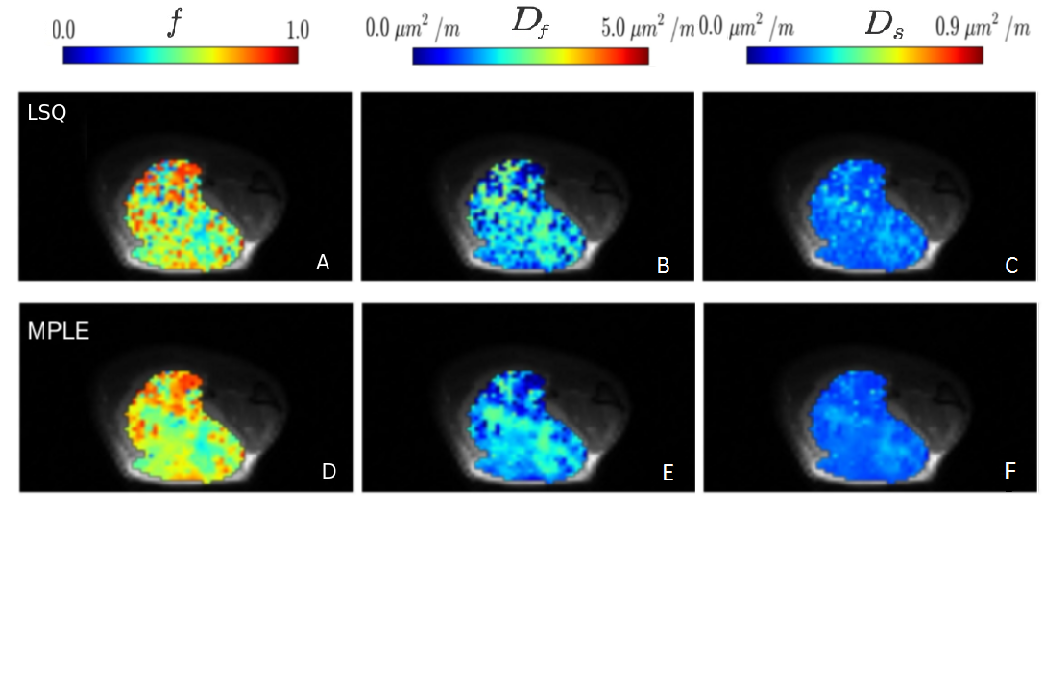
Figure 3
Representative voxel-wise fitting results of the biexponential functions for one PC-3 tumor xenograft with independent least square fitting (LSQ), A-C, and spatially constrained Maximum Penalized Likelihood Estimatio (MPLE), A-C.