5387
Alteration in Diffusion Characteristic of Cerebrospinal Fluid after Neurological Disease in Rats1Research Center of Translational Image, Teipei Medical University, Taipei, Taiwan, 2Radiology, School of Medicine, College of Medicine, Taipei Medical University, Taipei, Taiwan, 3Anatomy and Cell Biology, School of Medicine, College of Medicine, Taipei Medical University, Taipei, Taiwan, 4Biomedical Imaging and Radiological Science, China Medical University, Taichung, Taiwan
Synopsis
While the quantitative maps conducted by diffusion weighted or diffusion tensor imaging were applied to the brain parenchyma to describe the tissue type and fate, the diffusion coefficient in the cerebrospinal fluid (CSF) was not well explored. In this study, significant lower mean of diffusion constant (D-value) and change in the histogram of D-value were observed in stroke animals compared with intact rats and the mTBI animals, suggesting the brain lesion or damage may alter the diffusion characteristics in CSF.
INTRODUCTION
The diffusion coefficient calculated from diffusion-weighted imaging (DWI) reflects the characteristics of random Brownian motion of water molecules. The quantitative maps converted from the diffusion constant, such as apparent diffusion coefficient (ADC), fractional anisotropy (FA), axial or transverse diffusion, etc. have been applied in the brain parenchyma to describe the cellular density, white matter integrity and orientation of the fibers, respectively.1 In addition to the structure of the cell membranes and cell organs in tissues, the diffusion coefficient is also affected by the viscosity and temperature of the solution.2,3 In some intracranial diseases, such as multiple sclerosis, severe traumatic brain injury, cerebral infarction etc., the increase of protein concentration in the cerebrospinal fluid (CSF) has been observed.4,5,6 However, rather than the brain parenchyma, to date, the diffusion coefficient in the CSF after neurological disease is not well explored. We, thus, hypothesized that the damage or lesion in the brain may alter the diffusion characteristics in the CSF. In this study, the animals with clinical prevalent neurological disease, namely ischemic stroke and mild traumatic brain injury, were performed with diffusion weighted MRI at the assigned time point after the brain insult to well control the lesion progression and consistency of physiological status. This is the first study to demonstrate that the diffusion constant of the CSF was altered after prominent brain injury, such as stroke.
METHODS
Twenty-six male Sprague-Dawley rats including intact animals (n = 8), animals with ischemic stroke (n = 9) and that with mild traumatic brain injury (mTBI) (n = 9) were used in this study. For animals with ischemic stroke, rats were anesthetized with 1-2 % isoflurane following by permanent occlusion of the right middle carotid artery (MCAo).7 For mTBI animals, rats were anesthetized with Chloral Hydrate (400 gw/kg) and followed by the impact acceleration injury (IAI) to mimic the pathological outcomes in mTBI patients found in motorcycle accidents in Taiwan.8 Animal MR imaging was acquired at 24 hours after MCAo and at 50 days after mTBI on a Brucker 7T PharmaScan scanner. Animals were anesthetized under 1.5-2 % isoflurane for MRI. Diffusion data were acquired using the four-shot spin-echo EPI with TR/TE = 3000/30 ms, FOV = 2.56 × 2.56 cm, matrix size = 192 × 192, 16 slices, slice thickness of 1 mm, δ/Δ = 4/12 ms, number of b0 = 1, number of directions = 6, b-value = 1000 s/mm2 and number of averages = 4. Image processing and the average of diffusion constant (D-value) at different directions were calculated based on the previous study.7,9 Histogram analysis was also performed.10,11 Significant changes in D-value and histogram parameters among intact, stroke and mTBI animals were assessed using a two-tailed one-way ANOVA with the Tukey’s analysis as the post hoc test. Significant level was set at P < 0.05. Error bars were STD.RESULTS & DISCUSSION
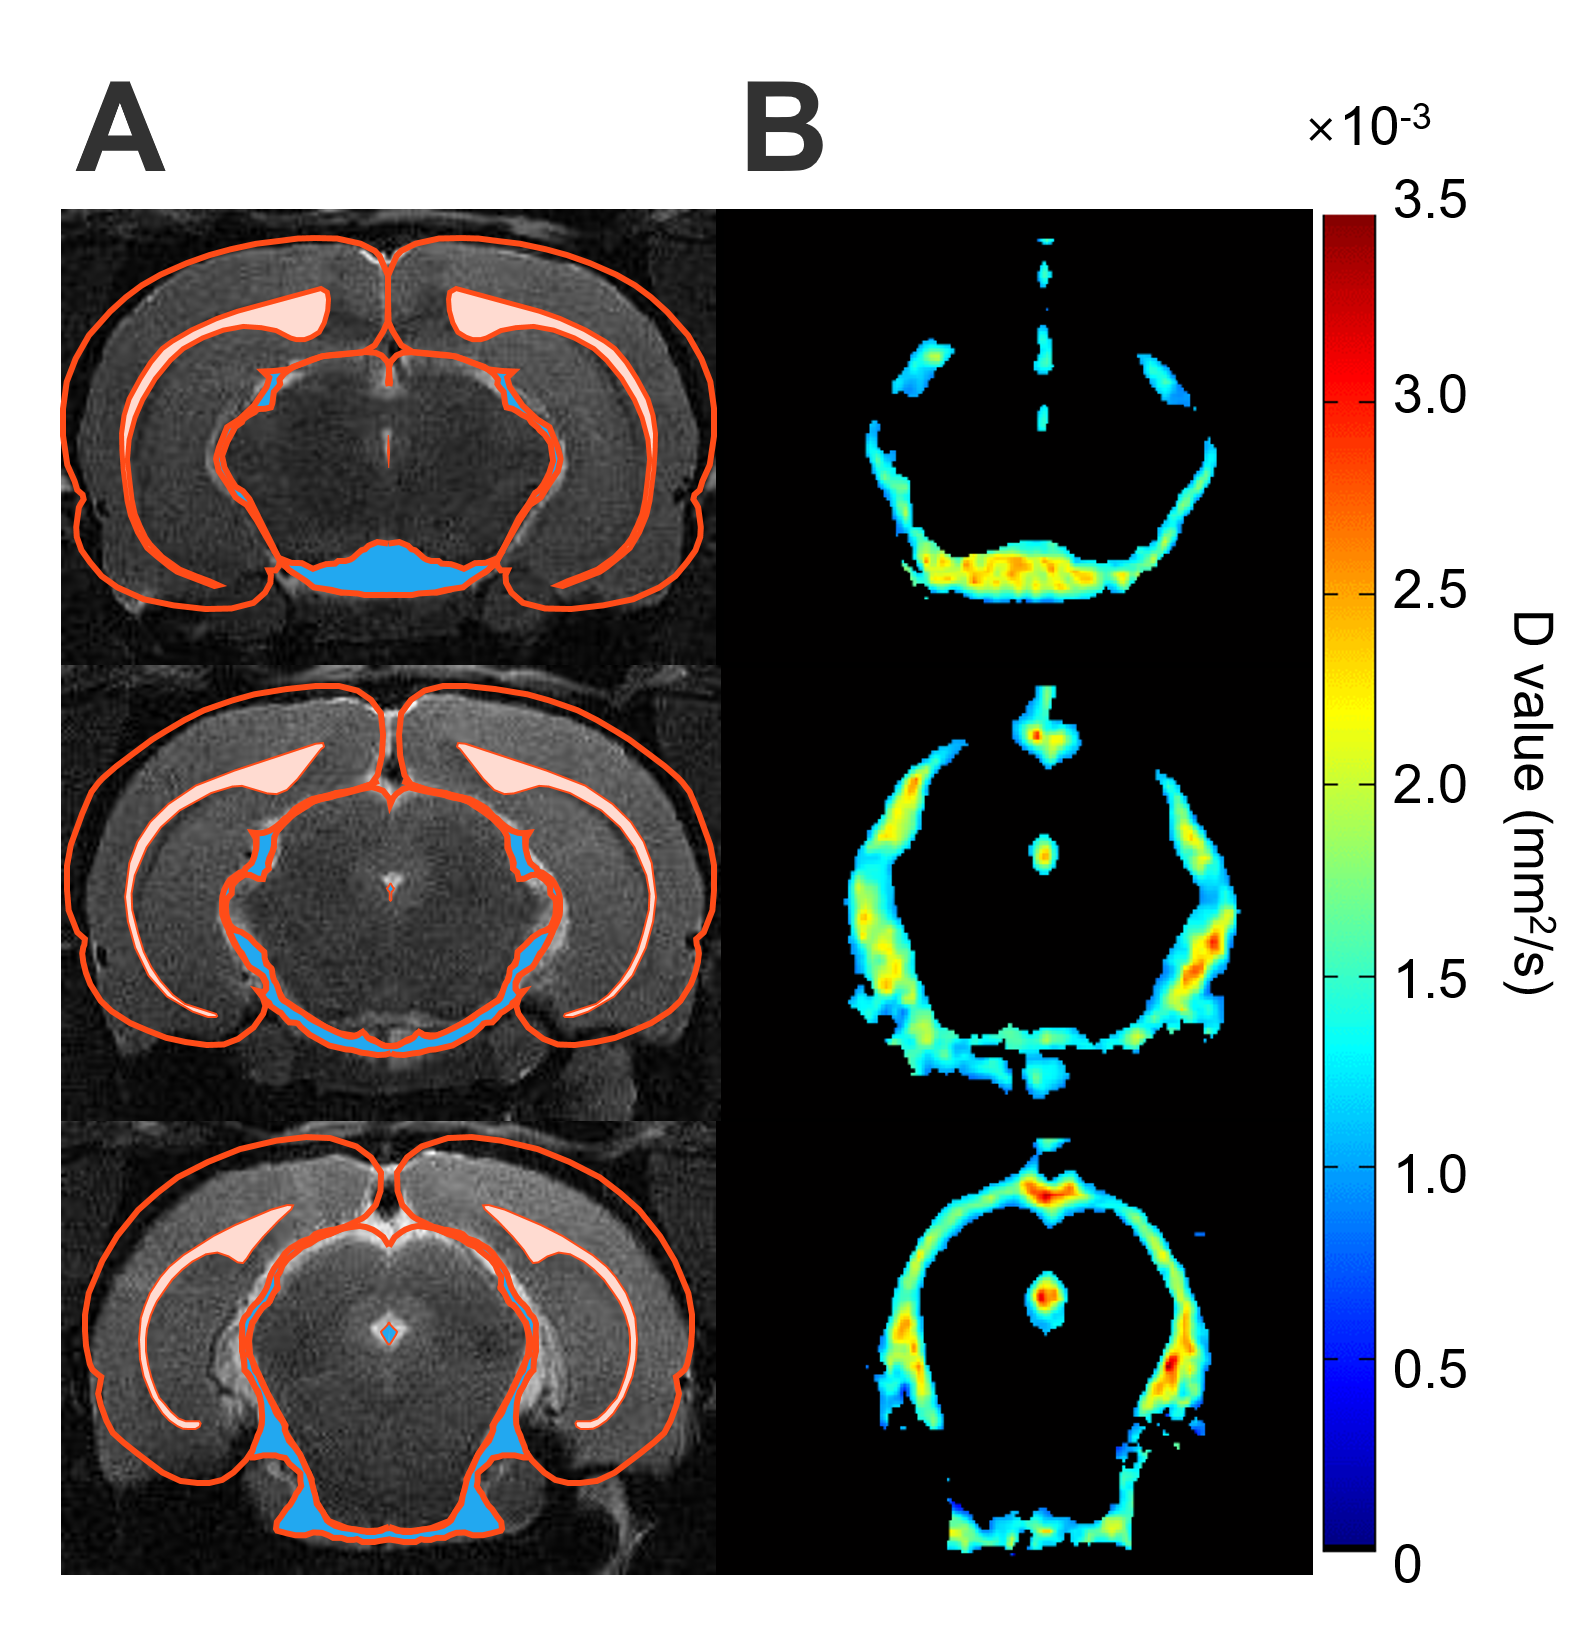
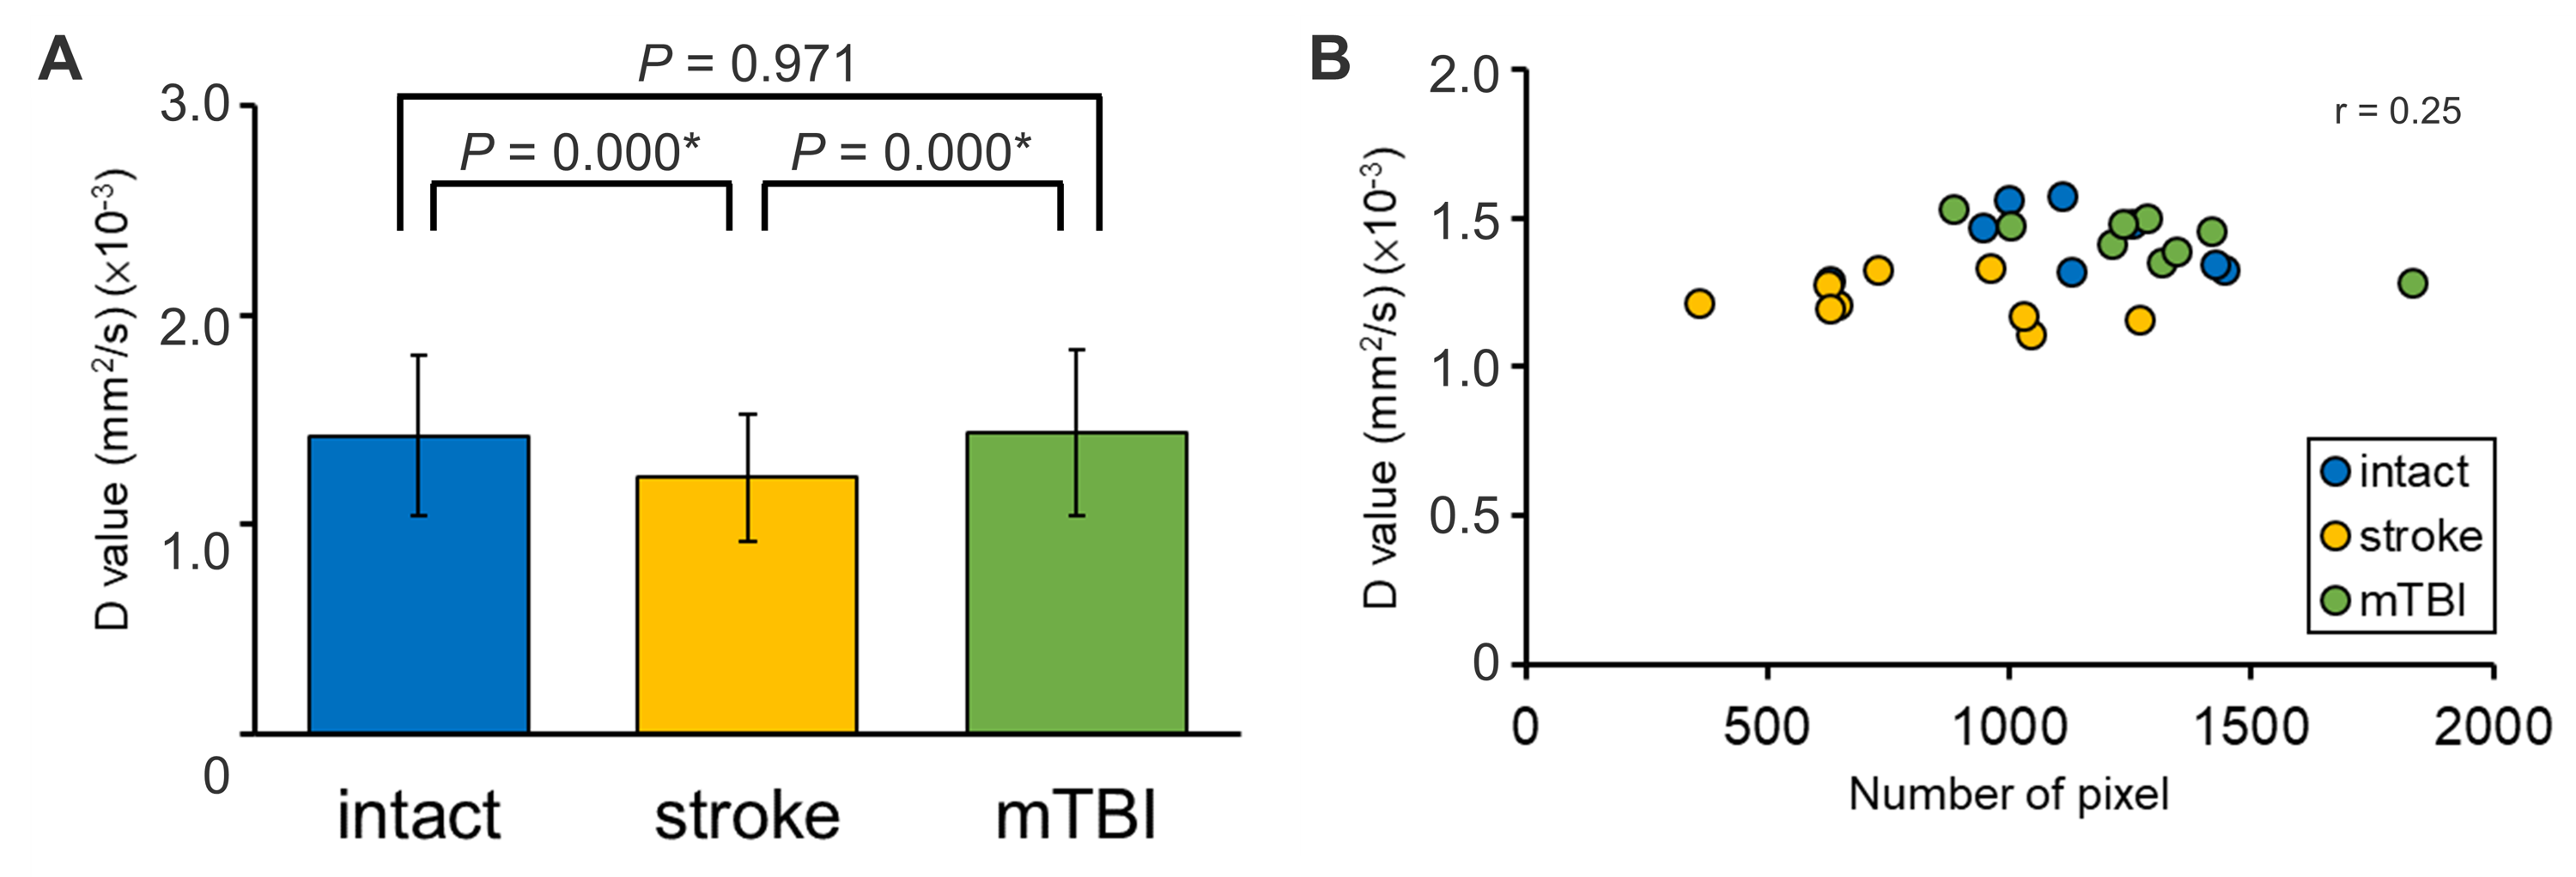
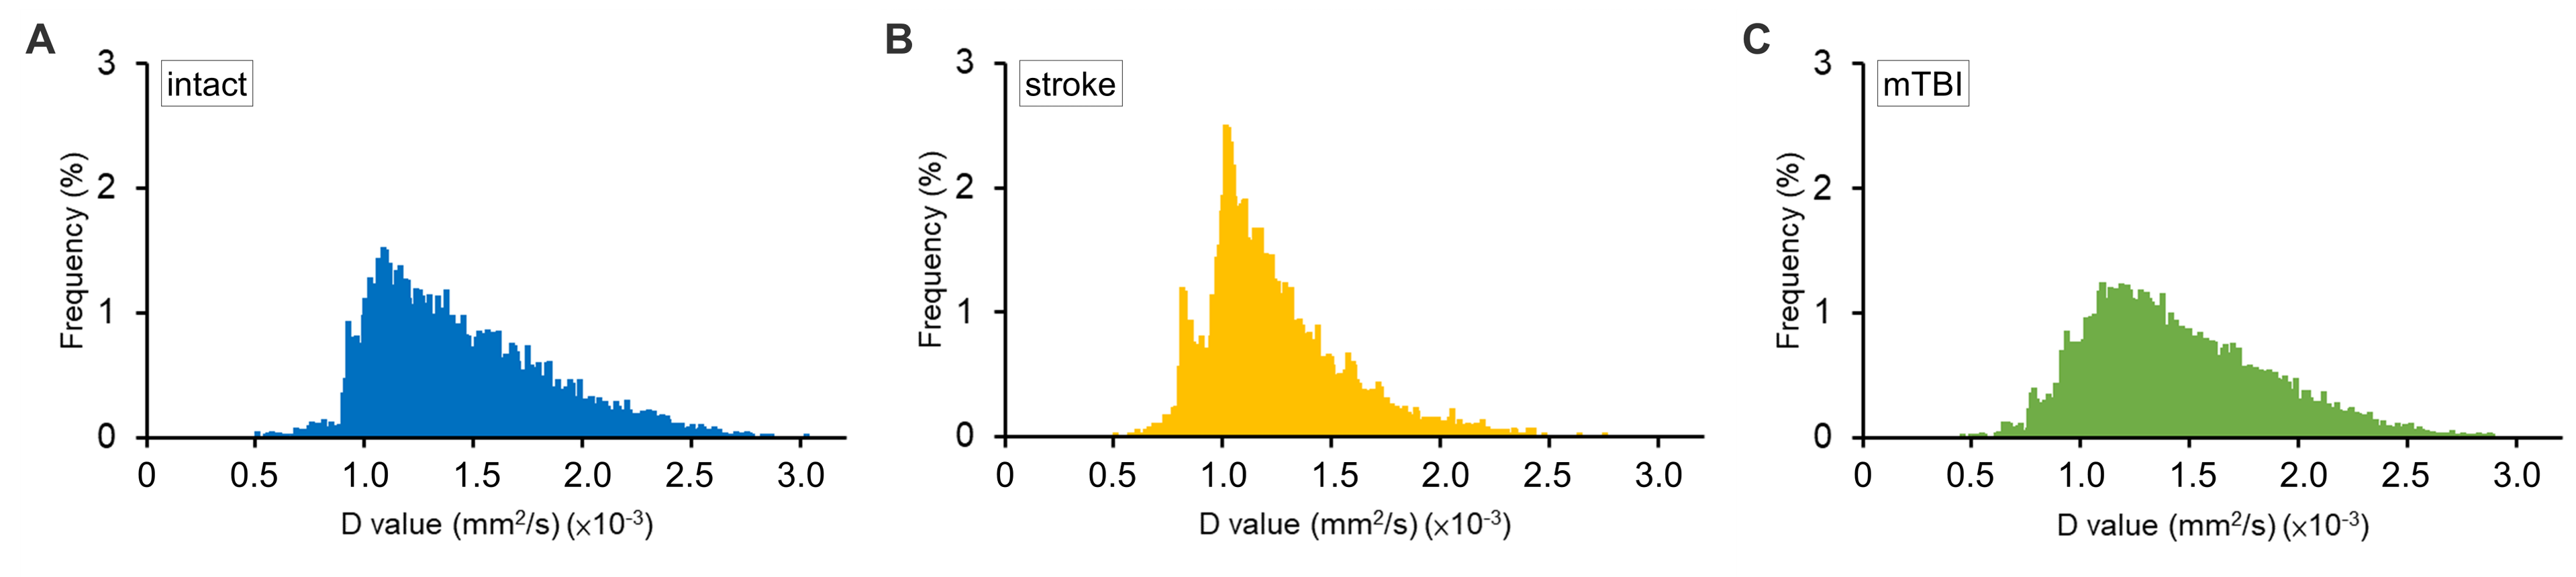
Due to the limited pixels in the ventricles, the CSF-enriched regions between the cerebellum and cerebrum in rat brains were selected to represent the diffusion characteristics of CSF (Figure 1). Stroke animals showed significant lower mean of D-value ((1.22 ± 0.88) ×10-3 mm2/s, P < 0.05 , Figure 2A and Table 1) compared with intact rats ((1.42 ± 0.11) ×10-3 mm2/s) and the mTBI animals ((1.43 ± 0.08) ×10-3 mm2/s). No significant correlation between the D value and the number of pixel was shown among animals (r = 0.25, P > 0.05, Figure 2B), suggesting that the lower D-value in stroke animals was not due to the lower number of pixels. In histogram analysis, the right-skewed and leptokurtic distribution was observed in stroke animals (Figure 3). Significant lower mean, the 50th and the 75th percentile of D-value (P < 0.05, Table 1) in stroke rats may imply the increase of viscosity due to leakage of protein into CSF after MCAo. In addition, significant higher skewness and kurtosis values in stroke rats may further suggest the difference in CSF composition after MCAo compared with the intact brain or the brain with relative mild injury. Our future studies will quantify the viscosity of CSF in disease model and how the content of CSD alters the D-value.Acknowledgements
This study was funded in part by Ministry of Science and Technology (104-2923-B-038 -003 -MY3, MOST 105-2628-B-038-002-MY2, MOST 106-2218-E-039-001-MY3,106-2314-B-038 -024 -MY2, and MOST 106-2314-B-038-079), Taipei, Taiwan.References
- Assaf Y, Pasternak O. Diffusion tensor imaging (DTI)-based white matter mapping in brain research: a review. J Mol Neurosci. 2008;34(1):51-61.
- Sakai K, Nakai R, Tazoe J, et al. How does the protein content of CSF affect for DWI thermometry?: Initial results of phantom and subarachnoid hemorrhage patient study. International Journal of Complex Systems – Computing, Sensing and Control. 2015;3(2):169-180.
- Clark CA, Le Bihan D. Water diffusion compartmentation and anisotropy at high b values in the human brain. Magn Reson Med. 2000;44(6):852-859.
- Kabat EA, Moore DH, Landow H. An electrophoretic study of the protein components in cerebrospinal fluid and their relationships to the serum proteins. J Clin Invest. 1942;21(5):571-577.
- Conti A, Sanchez-Ruiz Y, Bachi A, et al. Proteome study of human cerebrospinal fluid following traumatic brain injury indicates fibrin(ogen) degradation products as trauma-associated markers. J Neurotrauma. 2004;21(7):854-863.
- Rand J S, Parent J, Percy D, et al. Clinical, cerebrospinal fluid, and histological data from thirty-four cats with primary noninflammatory disease of the central nervous system. Can Vet J. 1994;35(3):174-181.
- Kuo D P, Lu C F, Liou M, et al. Differentiation of the Infarct Core from Ischemic Penumbra within the First 4.5 Hours, Using Diffusion Tensor Imaging-Derived Metrics: A Rat Model. Korean J Radiol. 2017;18(2):269-278.
- Kao Y C J L, C.F.; Chen, C.Y. Behavioral and Image Evidence for Mild Traumatic Brain Injury in Rats with the Skull Helmet ISMRM Preceeding, 2017.
- Tazoe J, Yamada K, Sakai K, et al. Brain core temperature of patients with mild traumatic brain injury as assessed by DWI-thermometry. Neuroradiology. 2014;56(10):809-815.
- Just N. Improving tumour heterogeneity MRI assessment with histograms. Br J Cancer. 2014;111(12):2205-2213.
- Baek HJ, Kim HS, Kim N, et al. Percent change of perfusion skewness and kurtosis: a potential imaging biomarker for early treatment response in patients with newly diagnosed glioblastomas. Radiology. 2012;264(3):834-843.
Figures