5384
Brain activations during a motor cortex paradigm: a diffusion MRI signal perspective.1Image Sciences Institute, UMC Utrecht and University Utrecht, Utrecht, Netherlands, 2Department of Radiology, UMC Utrecht, Utrecht, Netherlands, 3Department of Neurology, BG-University Hospital Bergmannsheil, Ruhr-University Bochum, Bochum, Germany, 4C.J. Gorter Center for High Field MRI, Leiden University Medical Centre, Leiden, Netherlands, 5Spinoza Centre for Neuroimaging, Amsterdam, Netherlands
Synopsis
Brain activations during task are commonly investigated by gradient-echo functional MRI (GE-fMRI), which is sensitive to blood volume changes and blood deoxygenation. Recent studies have shown that diffusion MRI, which is regarded as static in the time-scale of minutes, might be sensitive to changes in activated areas. We investigated changes in signals acquired during a motor cortex paradigm using GE-fMRI and diffusion fMRI (dfMRI). We observed causality between the task and the dfMRI acquired at different diffusion weightings. These preliminary results suggest that the observed changes in the dfMRI signal might not be a pure result of blood volume alterations.
Purpose
Diffusion MRI (dMRI) exploits the random motion of water molecules to provide information about tissues microstructure. Generally, the dMRI signal is assumed to be stable and repeatable within subjects over short time intervals. However, evidence suggests that the dMRI signal might be sensitive to physiological changes in the human brain over short time-scale, for example during a visual stimulus(1).
Compared to earlier attempts, which mainly focused on the visual cortex and separately acquired different diffusion-weightings(1–3), in this work we investigated the sensitivity of multi b-value diffusion signals acquired in a single sequence during a motor cortex paradigm.
Methods
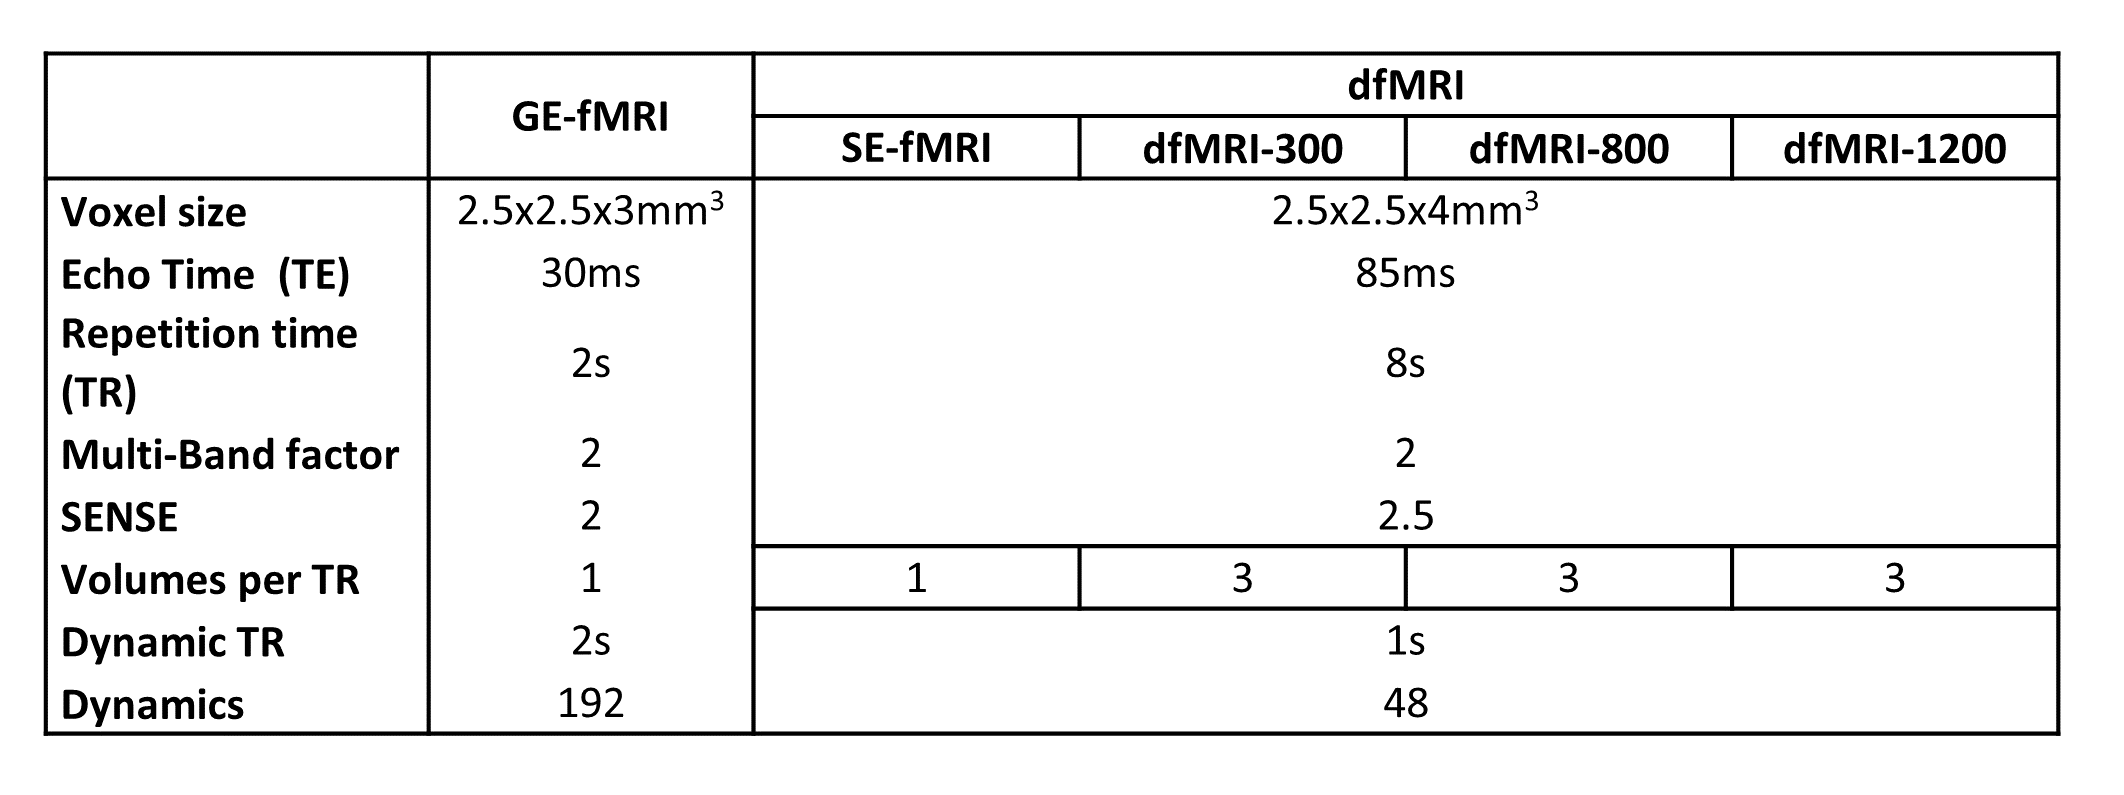
Data of three healthy volunteers were acquired at 3T Philips scanner using a 32ch head coil. The acquisition included three functional sequences, a gradient-echo EPI T2* fMRI (GE-fMRI), and two functional dMRI (dfMRI) sequences (see Table 1). The first dfMRI acquisition comprised of 7 volumes, 1 b=0s/mm2 (spin-echo fMRI, SE-fMRI), 3 b=300s/mm2 (dfMRI‑300) and 3 b=800s/mm2 (dfMRI-800). The later 2 were acquired with orthogonal gradients and geometrically averaged. Additionally, a dfMRI sequence was acquired on one of the subjects changing the maximum b-value to b=1200s/mm2 (dfMRI-1200).
The subjects performed a finger tapping task, which was repeated 6 times and included 32s of activation alternated with 32s of rest. Data was processed for motion and eddy current correction(4), then dfMRI was non-linearly warped to the fMRI space. Time-courses of mean diffusivity (MD) values were computed from corresponding time-points of b=0-300s/mm2, b=0-800s/mm2, b=300-800s/mm2, b=0-1200s/mm2, and b=300-1200 s/mm2 (MD-dfMRI).
Statistical analysis of the GE-fMRI data was performed voxel-wise with FSL FEAT(5) using standard settings and cluster thresholding (Z ≥ 2.3, p ≤ 0.05). The region of interest (ROI) corresponding to brain activation was defined by thresholding the fMRI Z-score maps above 7. Signals from SE-fMRI, dfMRI and MD-dfMRI, were averaged within the ROI and their z-score computed, i.e. the demeaned and divided by standard deviation (SD), to investigate causality with the task.
Finally, the same voxel-wise statistical analysis above described was performed on dfMRI and MD-dfMRI adjusting cluster significance to Z≥0.05, p≤0.05.
Results
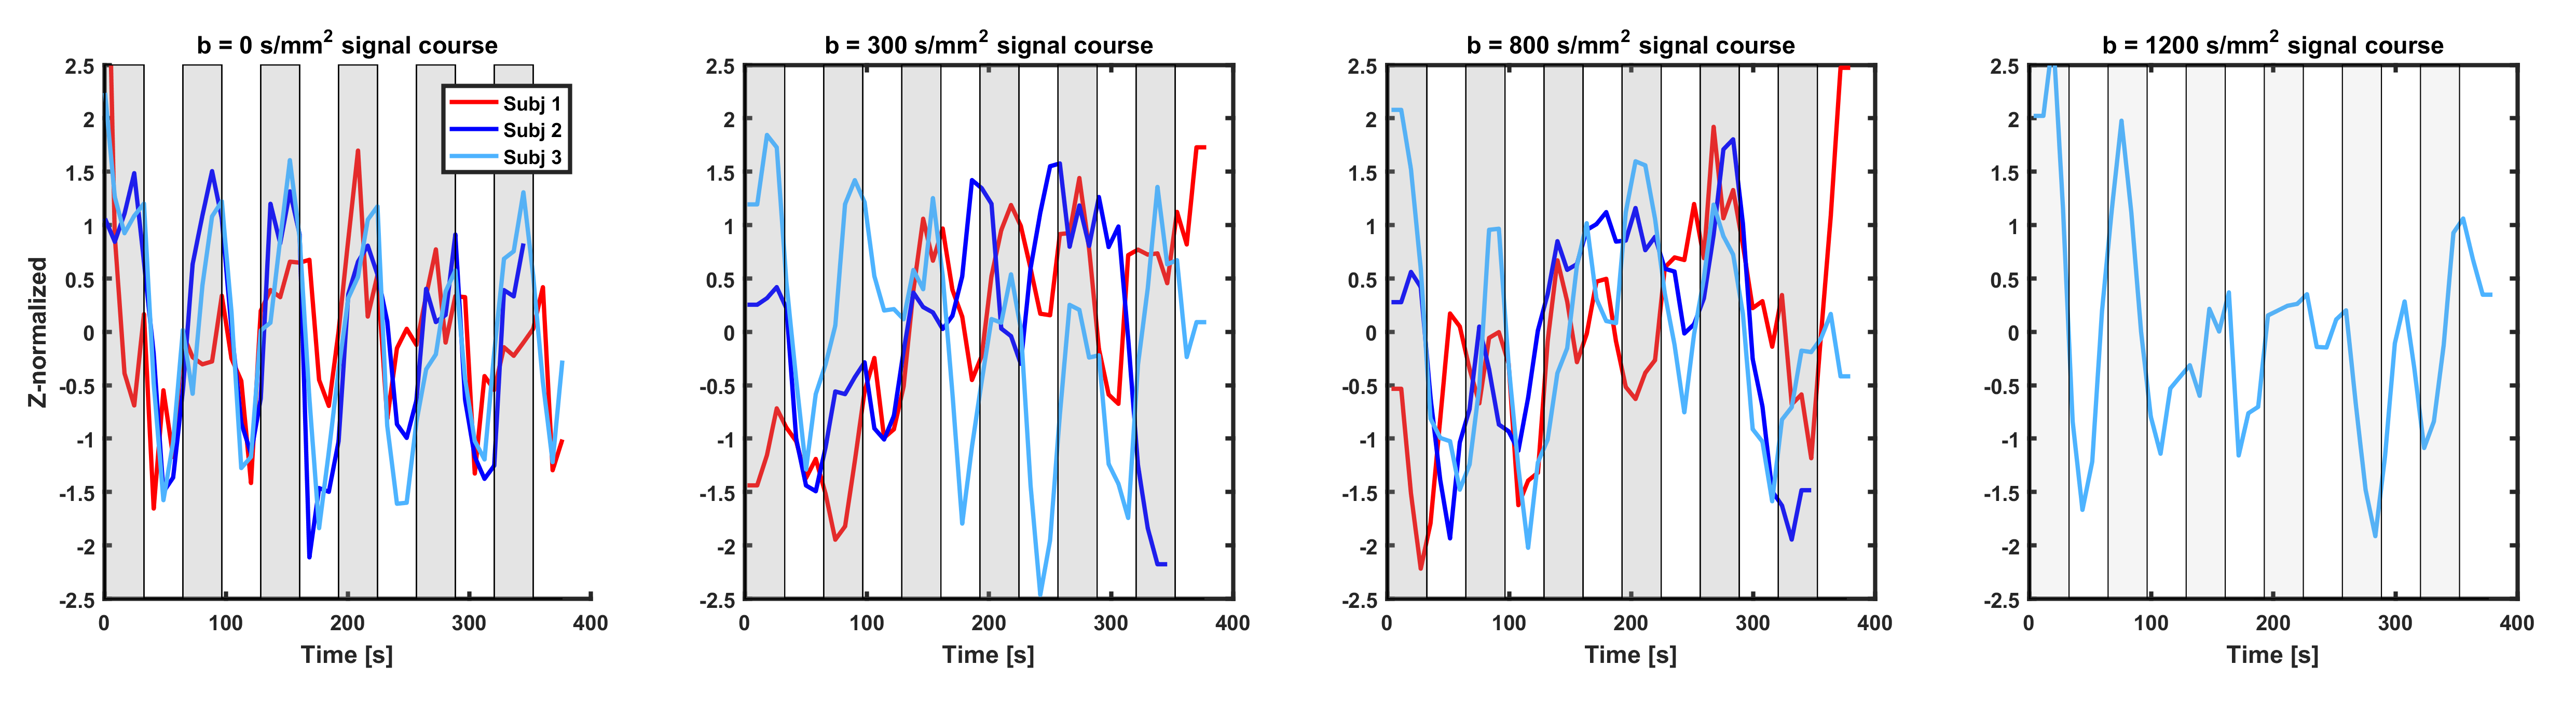
As expected, the GE-fMRI showed bi-lateral motor cortex activation. The SE-fMRI and dfMRI time-courses overlaid on the activation blocks for the three subjects are shown in Figure 1. The SE-fMRI and dfMRI-300 signal of all subjects followed the functional paradigm, with signal increases (1.5SD for SE-fMRI, 1SD for dfMRI-300) during task followed by decrease at rest (-1.5SD for SE-fMRI, up to -2SD for dfMRI-300). Similar patterns were observed for the dfMRI-800 and dfMRI-1200 (on average between -1SD and +1SD), but were characterized by higher signal instability.
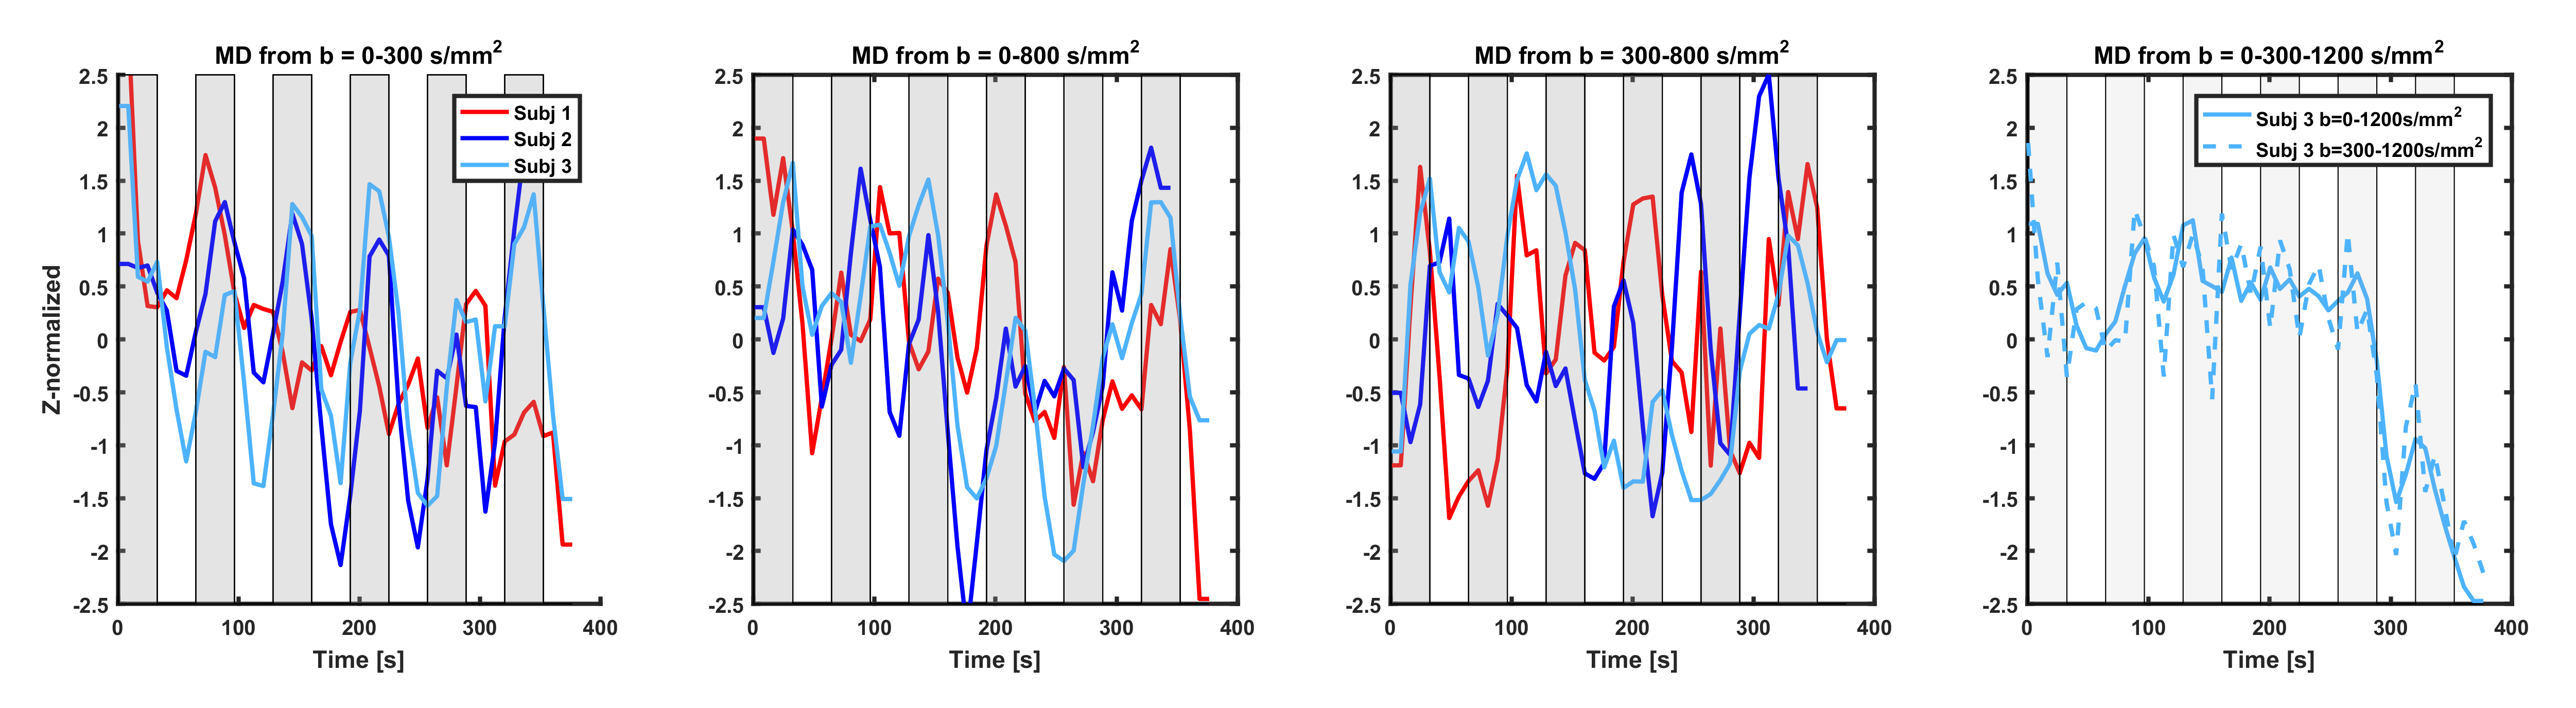
Figure 2 shows the same analysis for the MD-dfMRI signals. Dependency of the signals on the task was observed for all subjects, with MD increase during task and decrease during rest. MD-dfMRI computed from b=300-800s/mm2 also showed high causality with the task, but was more unstable.
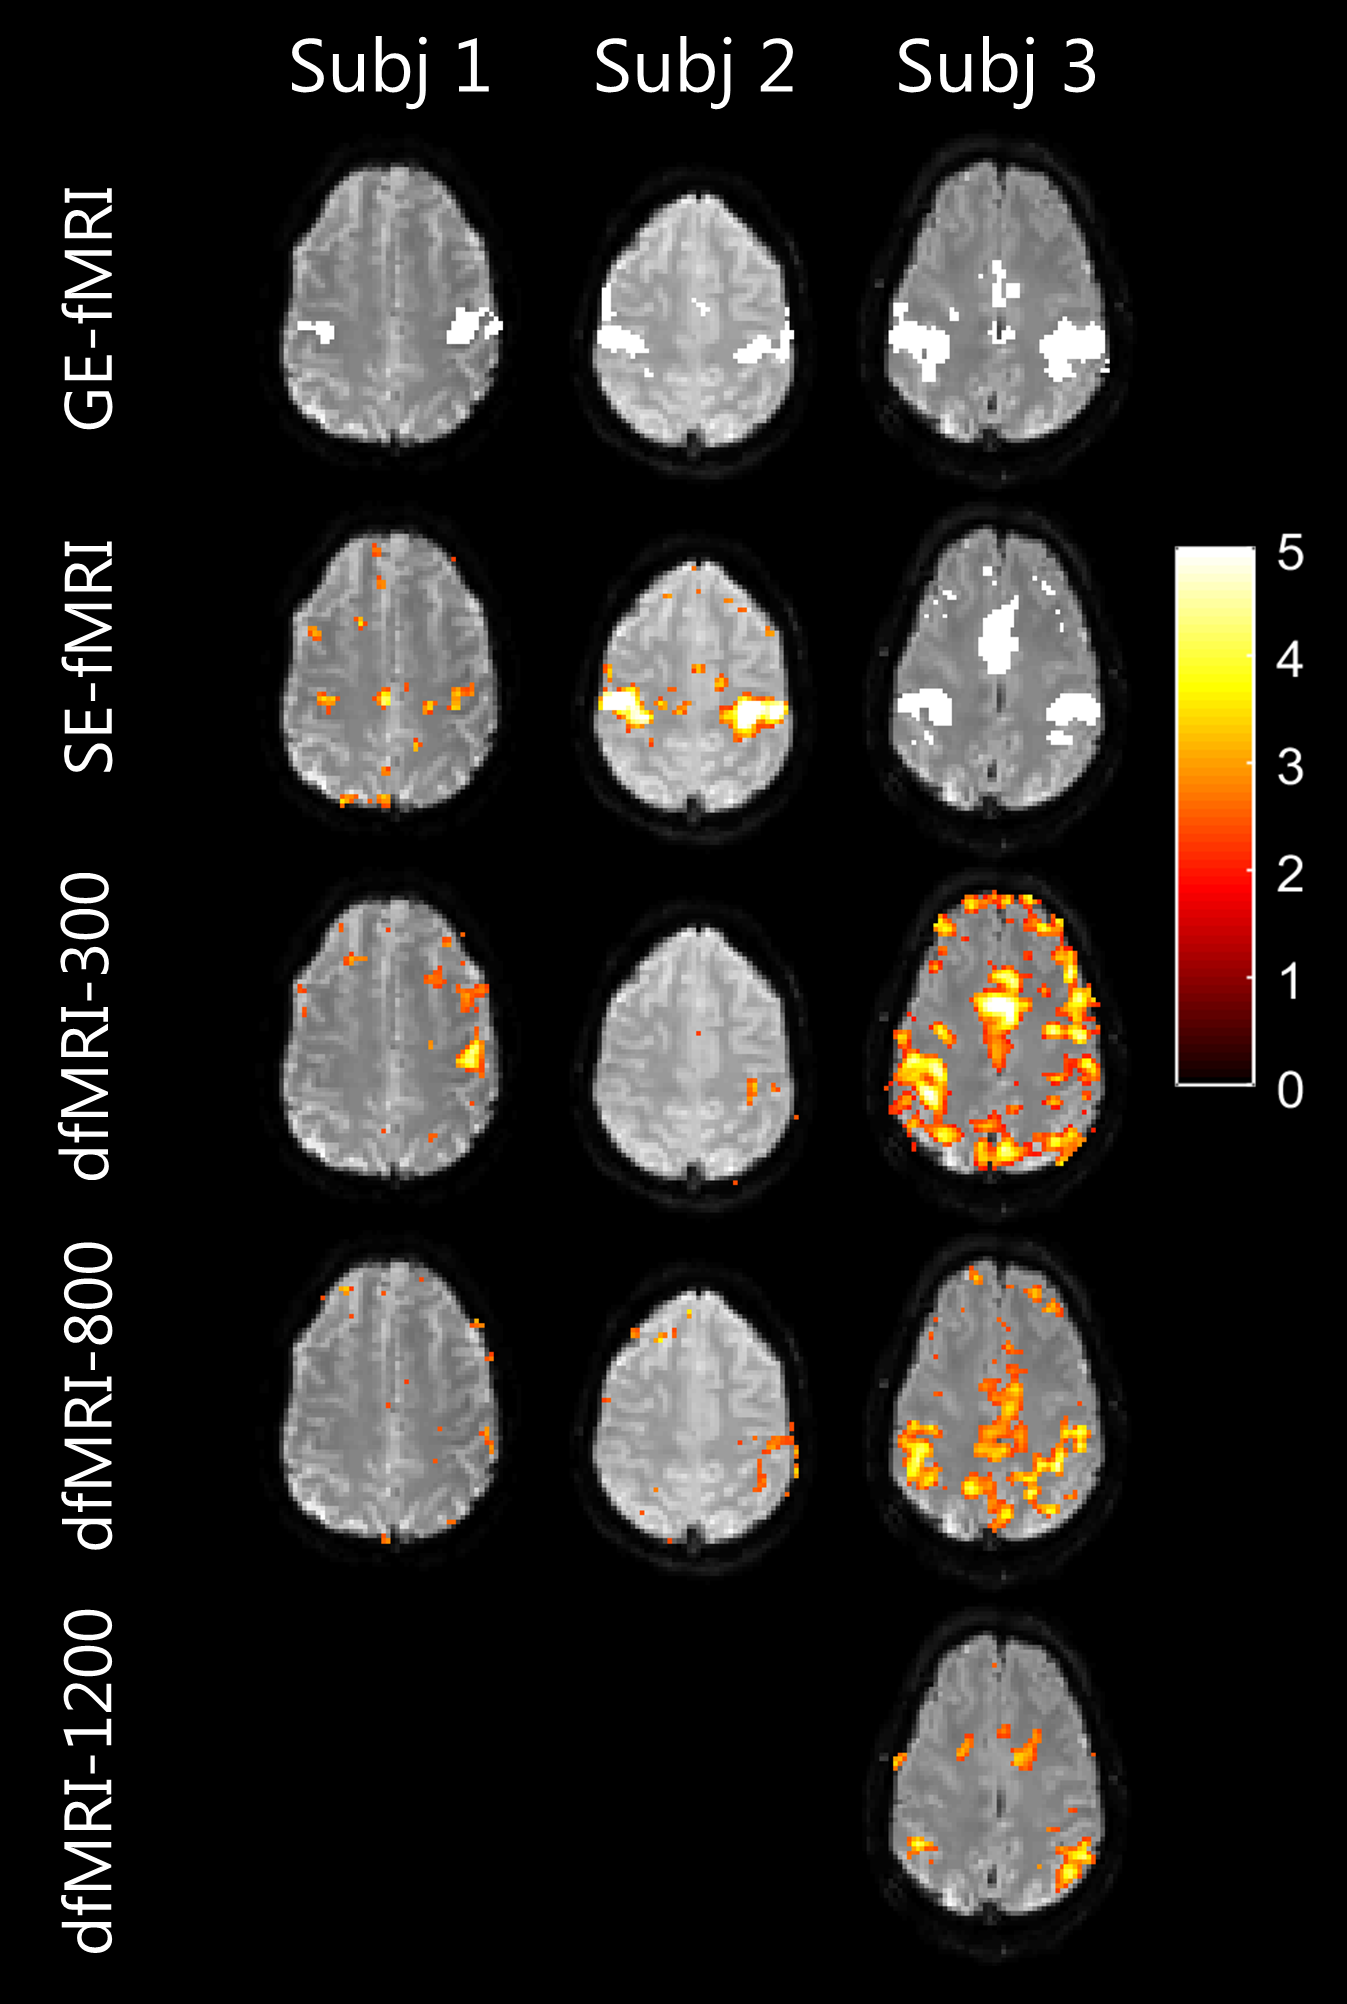
Figure 3 shows the voxel-wise activation maps corresponding to GE-fMRI, SE-fMRI and dfMRI acquisitions. The bi-lateral motor activation was observed for GE-fMRI and SE-fMRI. Bi-lateral activation for one subject and single-sided activation for two subjects were observed for dfMRI-300 and dfMRI-800, while no activations was observed at b=1200s/mm2. The number of false positives increased with the stronger diffusion weighting.
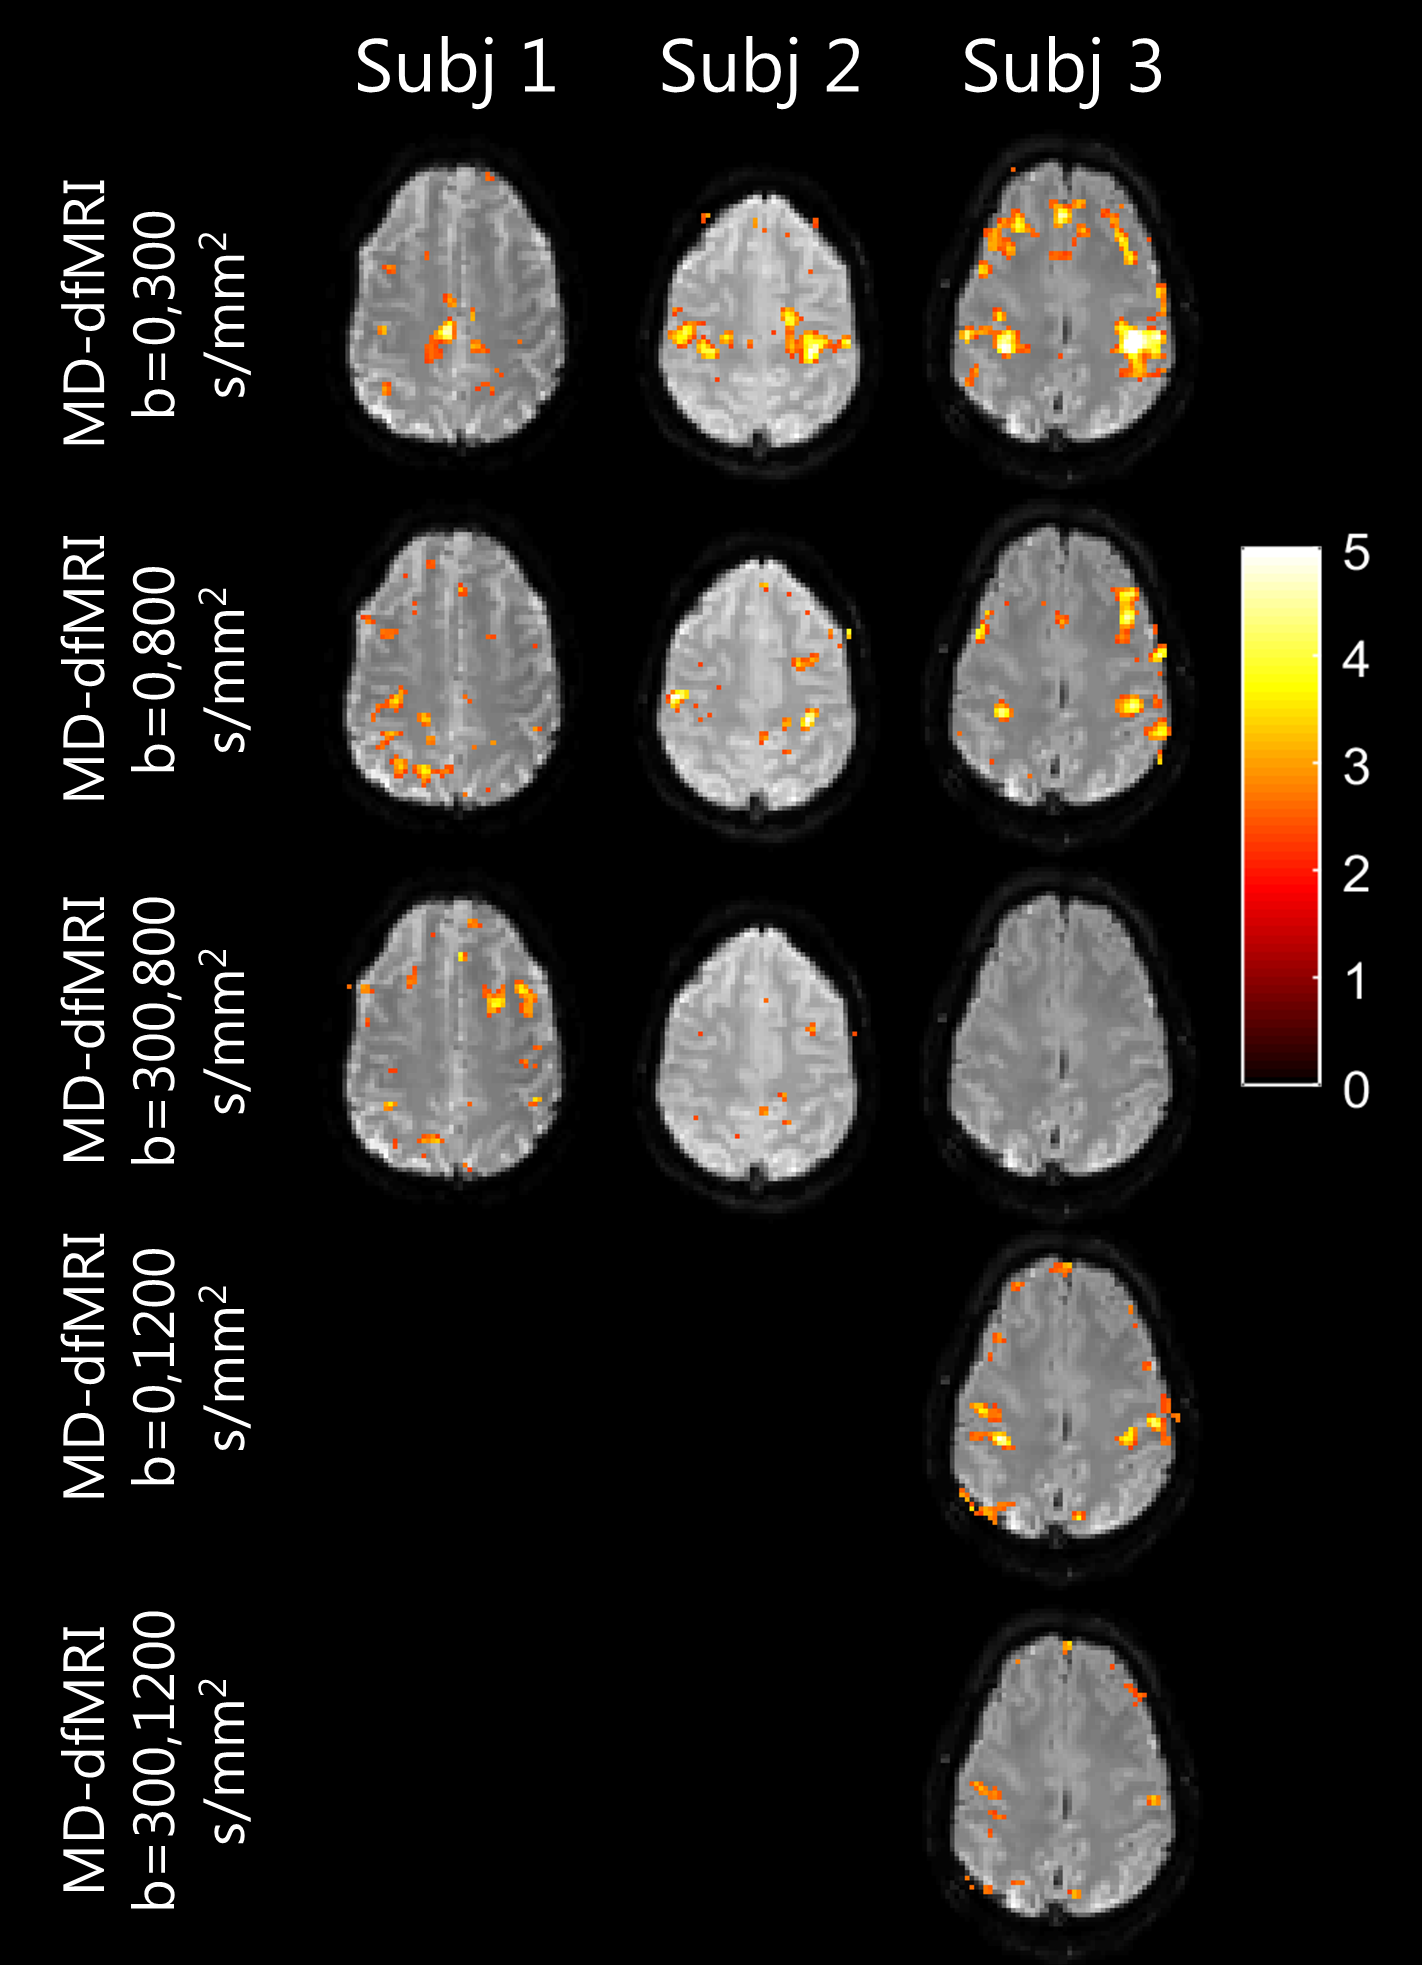
Activations maps computed on MD-dfMRI maps are shown in Figure 4. The bi-lateral motor activations were visible on all MD-dfMRI maps using the non-weighted image except for b=0-300s/mm2 of subject 1.
Discussion
Clear correspondence between task and signal fluctuations were found on all measured b‑values in the dfMRI data, in line with earlier reports (2,3,6,7).
Signal fluctuations in the SE-fMRI are likely modulated by T2 related BOLD changes as a result of blood flow, volume and oxygenation changes, and likely the result of blood volume changes. These processes could affect diffusion-weighted SE images in general, explaining the observed dfMRI fluctuations. However, for the MD signal changes this is unlikely as the computation of MD cancels out the inherent T2 weighting. Further investigation on a larger number of subjects as well as numerical simulations of the underlying processes are needed to further validate these observations.
Conclusions
In this study we observed correspondence between a functional paradigm using finger tapping and the dMRI signal measured in the motor cortex at multiple b-values, which possibly suggests diffusion MRI is sensitive to biophysical changes behind brain activation.Acknowledgements
This research is supported by VIDI Grant 639.072.411 from the Netherlands Organisation for Scientific Research (NWO)References
1. Nicolas R, Gros-Dagnac H, Aubry F, Celsis P. Comparison of BOLD, diffusion-weighted fMRI and ADC-fMRI for stimulation of the primary visual system with a block paradigm. Magn. Reson. Imaging 2017;39:123–131. doi: 10.1016/j.mri.2017.01.022.
2. Federau C, O’Brien K, Birbaumer A, Meuli R, Hagmann P, Maeder P. Functional mapping of the human visual cortex with intravoxel incoherent motion MRI. PLoS One [Internet] 2015;10:e0117706. doi: 10.1371/journal.pone.0117706.
4. Leemans A, Jeurissen B, Sijbers J, Jones DK. ExploreDTI: a graphical toolbox for processing, analyzing, and visualizing diffusion MR data. In: International Society for Magnetic Resonance in Medicine. Hawaii; 2009.
4. Le Bihan D, Urayama S, Aso T, Hanakawa T, Fukuyama H. Direct and fast detection of neuronal activation in the human brain with diffusion MRI. Proc. Natl. Acad. Sci. U. S. A. [Internet] 2006;103:8263–8. doi: 10.1073/pnas.0600644103.
5. Jenkinson M, Beckmann CF, Behrens TEJ, Woolrich MW, Smith SM. FSL. Neuroimage [Internet] 2012;62:782–90. doi: 10.1016/j.neuroimage.2011.09.015.
6. Williams RJ, McMahon KL, Hocking J, Reutens DC. Comparison of block and event-related experimental designs in diffusion-weighted functional MRI. J. Magn. Reson. Imaging 2014;40:367–375. doi: 10.1002/jmri.24353.
7. Aso T, Urayama S, Poupon C, Sawamoto N, Fukuyama H, Le Bihan D. An intrinsic diffusion response function for analyzing diffusion functional MRI time series. Neuroimage [Internet] 2009;47:1487–95. doi: 10.1016/j.neuroimage.2009.05.027.
Figures