5380
Towards a ‘resolution limit’ for DW-MRI tumour microstructural models: what microstructural changes can be distinguished?1Informatics, Imaging and Data Sciences, The University of Manchester, Manchester, United Kingdom, 2CRUK and EPSRC Cancer Imaging Centre in Cambridge and Manchester, Manchester, United Kingdom, 3Bioxydyn Ltd., Manchester, United Kingdom
Synopsis
The ability to detect specific changes in tumour tissue using diffusion-weighted (DW) MRI microstructural models depends on the accuracy and precision of parameter estimates, as well as the magnitude of specific biological changes. This work investigates the SNR requirements that data must meet in order to yield sufficiently precise estimates for detecting apoptotic cell shrinkage. Given the relative changes in cell size, R, and intracellular volume fraction, fi, as a result of apoptosis, simulations indicate that detecting changes in R require ~4-fold higher SNR than detecting changes in fi. Comparing the magnitude of biological changes with measurement accuracy and precision should form part of the validation process for potential biomarkers.
Introduction
Diffusion-weighted (DW) MRI
microstructural model parameters potentially provide a more specific
characterisation of tumour tissue than phenomenological parameters such as the
apparent diffusion coefficient (ADC)1,2. In particular, estimating
cell size, R, and volume fraction, fi, potentially allows different
forms of cell death to be distinguished, as they affect R and fi in
different ways; for example, cell shrinkage is a hallmark of apoptosis3.
The success of using microstructural models to distinguish between distinct microstructural changes depends on the accuracy and precision of model parameter estimates, as well as the magnitude of specific biological changes. For example, if typical changes in R are smaller than the precision with which R can be estimated, such changes will not be detected. This work investigates the signal-to-noise ratio (SNR) required for obtaining sufficiently precise estimates such that apoptotic cell shrinkage can be detected.
Methods
The PGSE signal was modelled analytically by combining restricted diffusion inside a sphere with hindered extracellular diffusion, with five parameters: cell radius, R, intracellular volume fraction, fi, intra- and extra-cellular diffusivities, Di and De, and T2. Starting from a plausible ‘baseline’ model of tumour tissue with R = 10 μm, fi = 0.60, two possible microstructural changes were considered: (i) mimicking apoptosis (cell size decrease, cell density constant)4 and (ii) mimicking a loss of cells (cell density decrease); see Figure 1. In addition, equivalent changes were applied to two other 'baseline' microstructures, with different initial cell sizes (R=13 μm, fi=0.60, and R=7 μm, fi=0.60). Di = 1 μm2/ms, De = 2 μm2/ms and T2 = 125 ms were assumed for all microstructures2,5.
Similar to the resolution limit for axonal diameter estimates6, we define the ability to detect a change in a parameter, p, in terms of a two sample z-test, with α = 0.05:
$$\sqrt{\mathrm{SE}^{2}_{p_1} + \mathrm{SE}^{2}_{p_2}} \leq \frac{\Delta p}{1.96} \quad\quad\quad\quad\quad\quad (1)$$
where $$$\mathrm{SE}_{p_n}$$$ is the standard error on the nth estimate of parameter p, and $$$ \Delta p = |p_2 - p_1|$$$ is the magnitude of the parameter change; p={R, fi}, n={1, 2}. The effect of SNR on $$$\mathrm{SE}_{p_n}$$$ was evaluated using Monte Carlo simulations with noisy synthetic data, generated from the microstructures using an optimised7 clinical acquisition, extending the approach described previously8 (Figure 2). The model was fitted to the noisy signals (with SNR defined based on the b = 0 s/mm2 signal at TE = 100 ms), here focussing on fits with Di and De fixed to their ground truth values, for simplicity. $$$\mathrm{SE}_{R_n}$$$ and $$$\mathrm{SE}_{f_{{i}_{{n}}}}$$$ were estimated as the standard deviation of 1000 iterations, excluding fits with extreme values (within 1% of the fit constraints).
Results and discussion
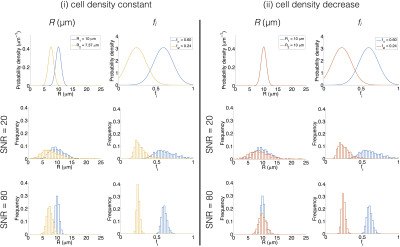
Figure 3 (top row) illustrates the theoretical broadest Gaussian PDFs consistent with successfully resolving the changes in R and fi. At SNR = 20, precision depends on the microstructure, but is sufficient to detect the change in fi in both cases (Figure 3, middle row). However, SNR is insufficient to detect the change in R for case (i), implying that the two cases cannot be distinguished. At SNR = 80, precision varies less between different microstructures, and is sufficient to detect the change in R, for case (i), and changes in fi, for cases (i) and (ii) (Figure 3, bottom row).
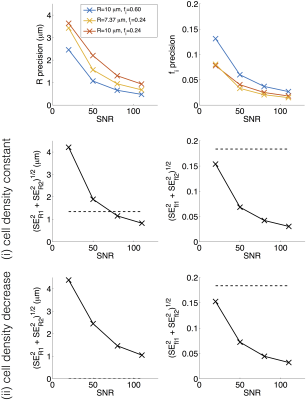
Figure 4 (top row) plots $$$\mathrm{SE}_{R}$$$ and $$$\mathrm{SE}_{f_{{i}}}$$$ against SNR, for the three microstructures. In addition to the general trend to better precision at higher SNR, generally R is estimated more precisely at higher fi, and fi estimated more precisely at lower fi. Figure 4 (middle/bottom rows) plots the ‘resolution limit’ (Equation 1, left hand side) against SNR. Dashed lines show the threshold (Equation 1, right hand side), indicating that SNR ≈ 80 is required for detecting ∆R in case (i) while SNR < 20 is sufficient for detecting ∆fi in both cases.
Similar trends were observed for the two other ‘baselines’, suggesting that the findings may be generalised to other microstructures. Similar results were also observed for other PGSE acquisitions, suggesting that the general trends are not dependent on the scan parameters. Note that these results reflect a best-case scenario, as Di, De, and T2 are assumed to be known and unchanging.
Conclusion
The precision of DW-MRI microstructure estimates depends on specific microstructural properties as well as SNR. Given the relative changes in R and fi as a result of apoptosis, simulations indicate that detecting changes in R require ~4-fold higher SNR than detecting changes in fi. Comparing the magnitude of expected biological changes with the accuracy and precision of measurements should form part of the validation process9 for potential biomarkers.Acknowledgements
This work was supported by CRUK [C8742/A18097]. This is a contribution from the Cancer Imaging Centre in Cambridge & Manchester, which is funded by the EPSRC and Cancer Research UK.References
1Panagiotaki et al., Cancer Res. 2014;74:1902-1912. 2Reynaud et al., NMR Biomed. 2016;29:1350-1363. 3Bortner and Cidlowski, Biochem Pharm. 1998;56:1549-1559. 4Poulsen et al. Am J Physiol Cell Physiol. 2010;298:C14-C25. 5Oh et al., Journal Magn Reson Imaging. 2005;21:701-708. 6Nilsson et al., NMR Biomed. 2017;30:e3711. 7Atkinson et al., Optimum Experimental Designs, OUP, 2007. 8McHugh et al., ISMRM 2016; abstract 2861. 9O’Connor et al., Nat Rev Clin Oncol. 2017;14:169-186.Figures


