5379
Diffusion-weighted imaging reveals microstructural alterations in a transgenic rat model of Alzheimer’s disease - validation against immunohistochemistry1Division of Neuroscience and Experimental Psychology, University of Manchester, Manchester, United Kingdom, 2Division of Informatics, Imaging and Data Sciences, University of Manchester, Manchester, United Kingdom, 3Bioxydyn Ltd, University of Manchester, Manchester, United Kingdom
Synopsis
Diffusion-weighted imaging (DWI) holds the promise of detecting very subtle neuronal changes in Alzheimer’s disease (AD). We compare the sensitivity of different DWI metrics to microstructural change in a transgenic rat model of AD. We find genotype-related differences in regions known to be affected in AD, with NODDI metrics showing greater sensitivity than FA and MD. However, no genotype-related difference in neuronal density is detected using immunohistochemistry staining for NeuN suggesting that the DWI changes reflect alterations in the neuronal structure (dendritic density or myelination) rather than density. DWI metrics are however correlated with neuronal density on a regional basis.
Introduction
Imaging measurements that are sensitive to the earliest signs of dementia are useful for diagnosis and disease monitoring and in clinical trials of new treatments. Diffusion-weighted imaging (DWI) metrics show promise in identifying these early changes in loss or disconnection of neurons, before the later stage of atrophy occurs. Certain techniques such as Neurite Orientation Dispersion and Density Imaging (NODDI)$$$^1$$$ claim to be sensitive to specific cell types. However, this specificity is uncertain as alterations to non-neuronal cells could also impact on diffusion metrics. In this study we compare the sensitivity of different DWI metrics to microstructural change in a rat model of Alzheimer’s disease (AD) and also validate the metrics against immunohistochemistry measurements of neural density.Methods
Two groups of 18 month-old rats were scanned on a 7T Bruker BioSpec MRI system: 8 TgF344-AD (TG) and 8 wildtype (WT). All experiments were carried out in accordance with the Animal Scientific Procedures act 1986 and approved by the University of Manchester Local Ethical Review Committee. Rats were anesthetized with 4% isoflurane and maintained with 2.5% isoflurane in 100% O2.
Multi-shell diffusion data were acquired using a pulsed gradient spin echo multi-shot EPI sequence with acquisition parameters as described in Figure 1. Pre-processing in FSL allowed correction of eddy-current distortions. A standard atlas of the rat brain$$$^2$$$ was used to identify brain regions by warping the atlas images onto the high resolution T1-weighted images and eroding the regions to avoid mis-registration errors. Maps of Mean Diffusivity (MD) and Fractional Anisotropy (FA) were calculated in FSL and NODDI parameters were calculated using Matlab. The median value of each diffusion metric in each brain area in each rat was calculated.
For immunohistological validation, the rat brain sections (20µm) were stained with anti-NeuN antibody (MAB377). Photographs of each brain section were taken in a red and green channel capturing both auto-fluorescence (green) and NeuN (red). ImageJ was used to convert images to binary form and the green channel was subtracted from the red and the % of the stain on the subtraction image was taken as a measure of neural density.
The effect of genotype on each diffusion metric and NeuN was tested in each region using an un-paired t-test. The relationship between each diffusion metric and NeuN was tested using Pearson’s correlation.
Results
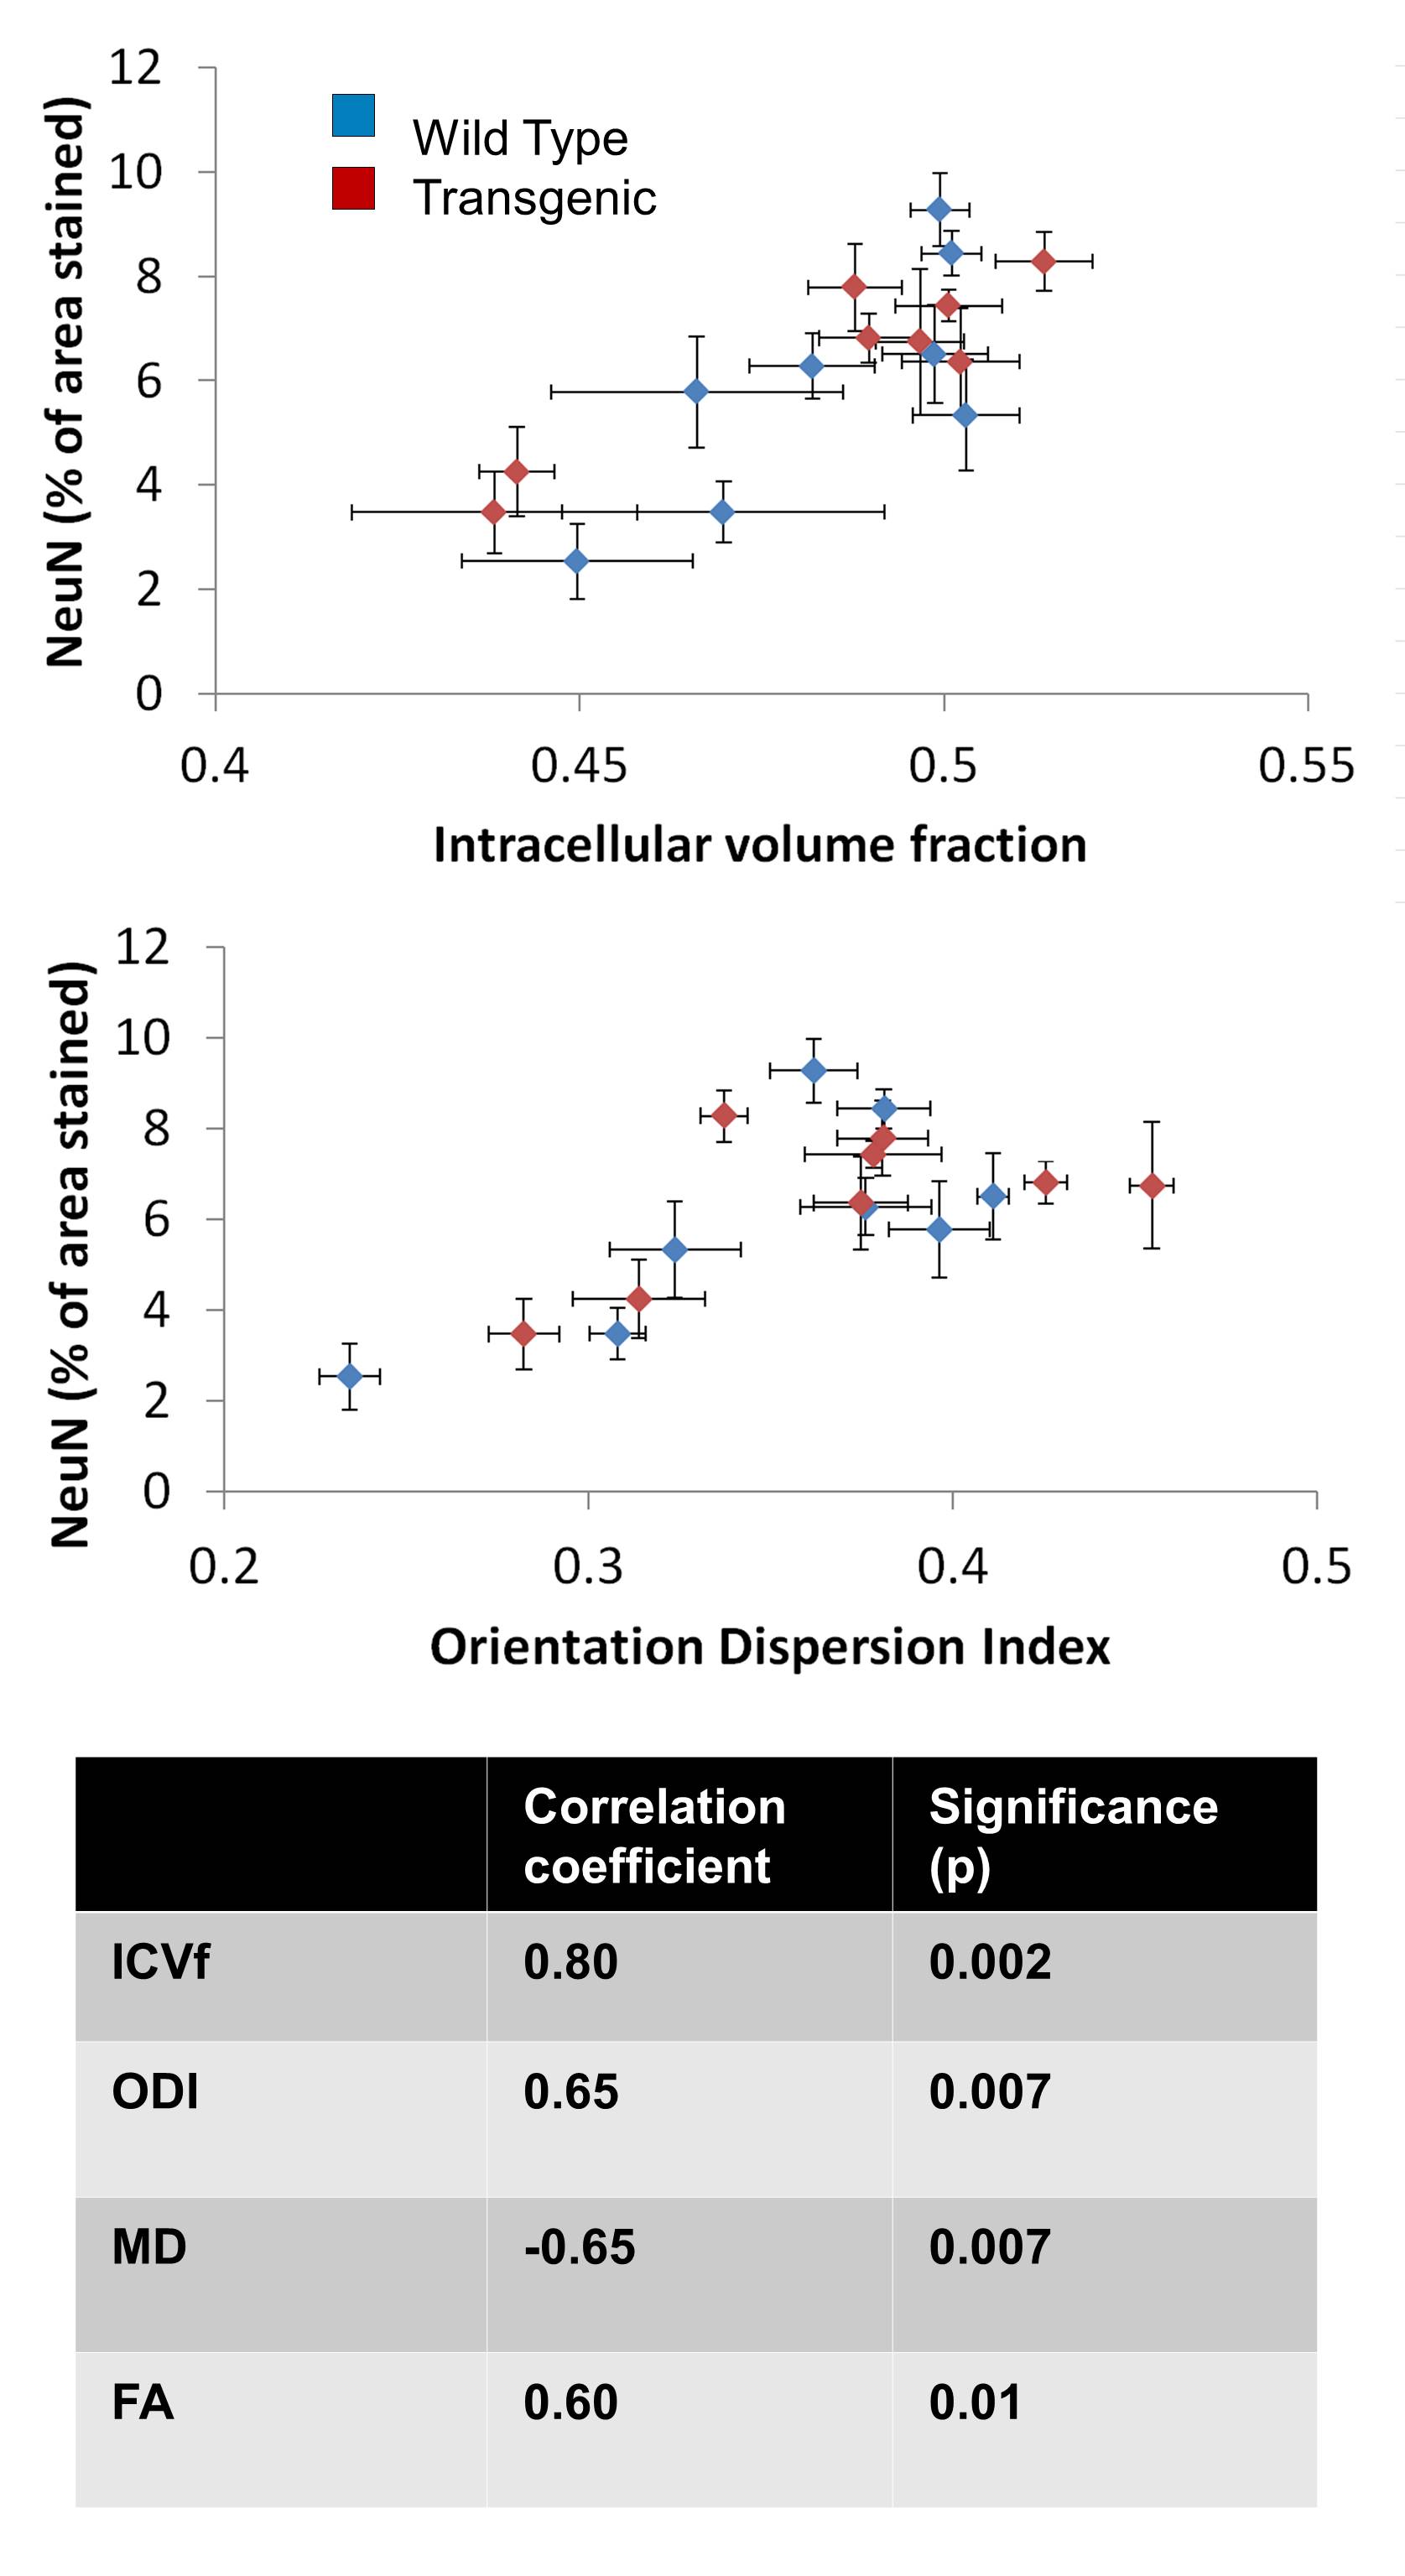
Figure 1 shows a typical example of the diffusion metric maps, with good image quality. Figure 2 shows the effect of genotype on the regional DWI metrics and NeuN. Note the striking similarity in regional patterns of NeuN and the diffusion metrics, which was found to be significant on statistical testing (Figure 3). Figure 3 confirms that the DWI metrics do significantly relate to neural density on a regional basis.Discussion
We find genotype-related differences in cingulate cortex, temporal cortex, entorhinal cortex and hippocampus (Figure 2), all regions known to be affected early in AD$$$^3$$$ showing high Aβ plaque load. We also find changes in the somatosensory cortex. In these regions, ICVf is increased, ODI is increased and FA is decreased. This is in agreement with previous work showing lower FA and higher ODI and ICVf in cingulate cortex and hippocampus in transgenic rats at age 24 compared to 10 months$$$^4$$$. In general the NODDI metrics of ICVf and ODI appear more sensitive to disease-related differences than the conventional metrics of FA and MD, with the dispersion-related metrics showing the highest sensitivity. The lack of significant difference in NeuN between the genotypes is somewhat surprising and in disagreement with previous work$$$^5$$$. Our finding of no disease-related difference in neural density suggests that the differences in the DWI metrics may be related to something else; perhaps alterations in the neuronal structure (eg dendritic density or myelination) rather than their density, or perhaps related to Aβ plaques. However, clearly there is a strong correlation between the DWI metrics and NeuN on a regional basis (Figure 3) with increased neural density relating to higher ICVf and higher ODI.This suggests that DWI metrics are affected by multiple cellular properties i.e. they do relate to neural density but it is not changes to neural density that is causing the observed disease-related change.Conclusion
We find evidence that DWI metrics are sensitive to disease-related change in a transgenic rat model of AD. Comparisons with immunohistochemistry show a significant relationship between neural density and DWI metrics on a regional basis, but no evidence that the disease-related changes are due to differences in neural density. It is important to validate diffusion metrics for each application in order to understand the cause of the disease-related change.Acknowledgements
Engineering and Physical Sciences Research Council (EPSRC) UK Grant ref EP/M005909/1.References
1. Zhang H, Schneider T,
Wheeler-Kingshott CA, & Alexander DC (2012) NODDI: Practical in vivo
neurite orientation dispersion and density imaging of the human brain. Neuroimage 61(4):1000-1016.
2. Schwarz AJ, et al. (2006) A stereotaxic MRI
template set for the rat brain with tissue class distribution maps and
co-registered anatomical atlas: Application to pharmacological MRI. NeuroImage 32(2):538-550.
3. Braak H &
Braak E (1991) Neuropathological stageing of Alzheimer-related changes. Acta Neuropathologica 82(4):239-259.
4. Fick RHJ, et al. (2017) Comparison of Biomarkers
in Transgenic Alzheimer Rats Using Multi-Shell Diffusion MRI. Computational Diffusion MRI: MICCAI
Workshop, Athens, Greece, October 2016, eds Fuster A, Ghosh A, Kaden E,
Rathi Y, & Reisert M (Springer International Publishing, Cham), pp 187-199.
5. Cohen RM, et al. (2013) A Transgenic Alzheimer
Rat with Plaques, Tau Pathology, Behavioral Impairment, Oligomeric A beta, and
Frank Neuronal Loss. Journal of
Neuroscience 33(15):6245-6256.
Figures
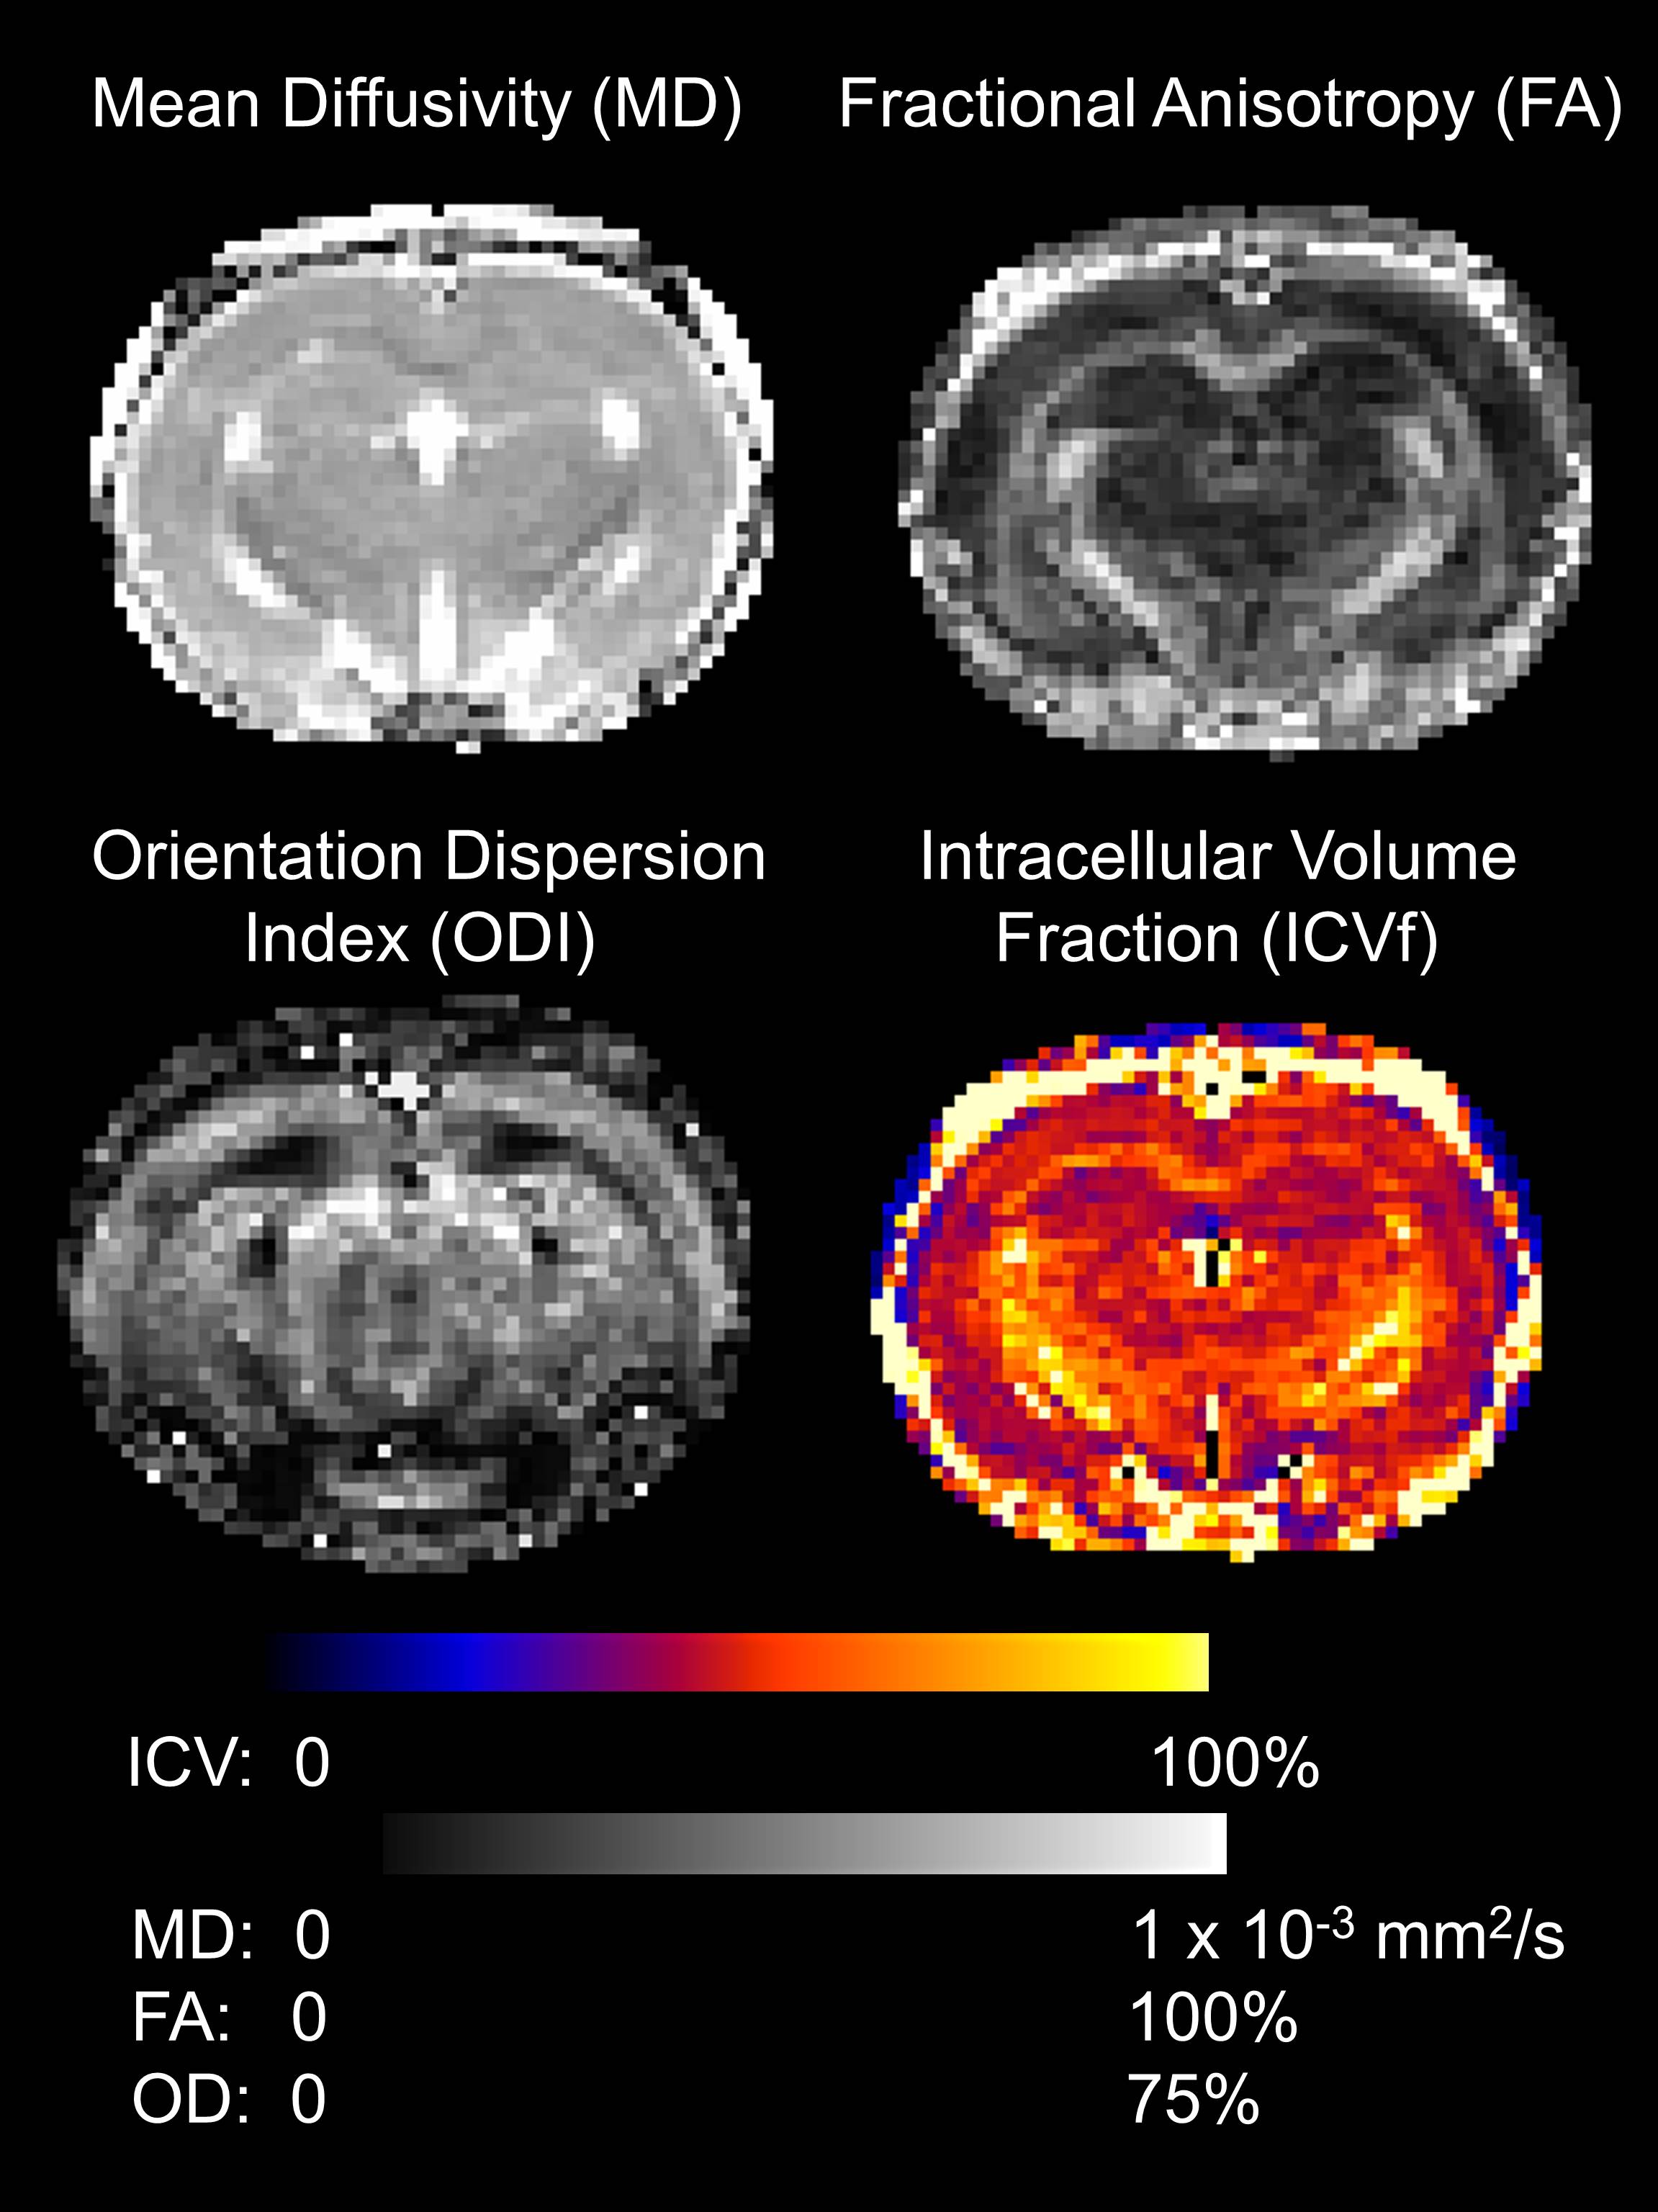
Acquisition parameters: b = 2000 s/mm2 in 30 non-collinear directions, b = 700 s/mm2 in 20 non-collinear directions and 5 b = 0 with each shell. TE = 33ms, TR = 4000ms, 2 EPI segments, in-plane resolution of 0.31 x 0.31 mm and 30 coronal slices of 1.0 mm thickness. Maps of Mean Diffusivity (MD) and Fractional Anisotropy (FA) were calculated in FSL using conventional diffusion tensor analysis and NODDI parameters were calculated using Matlab.
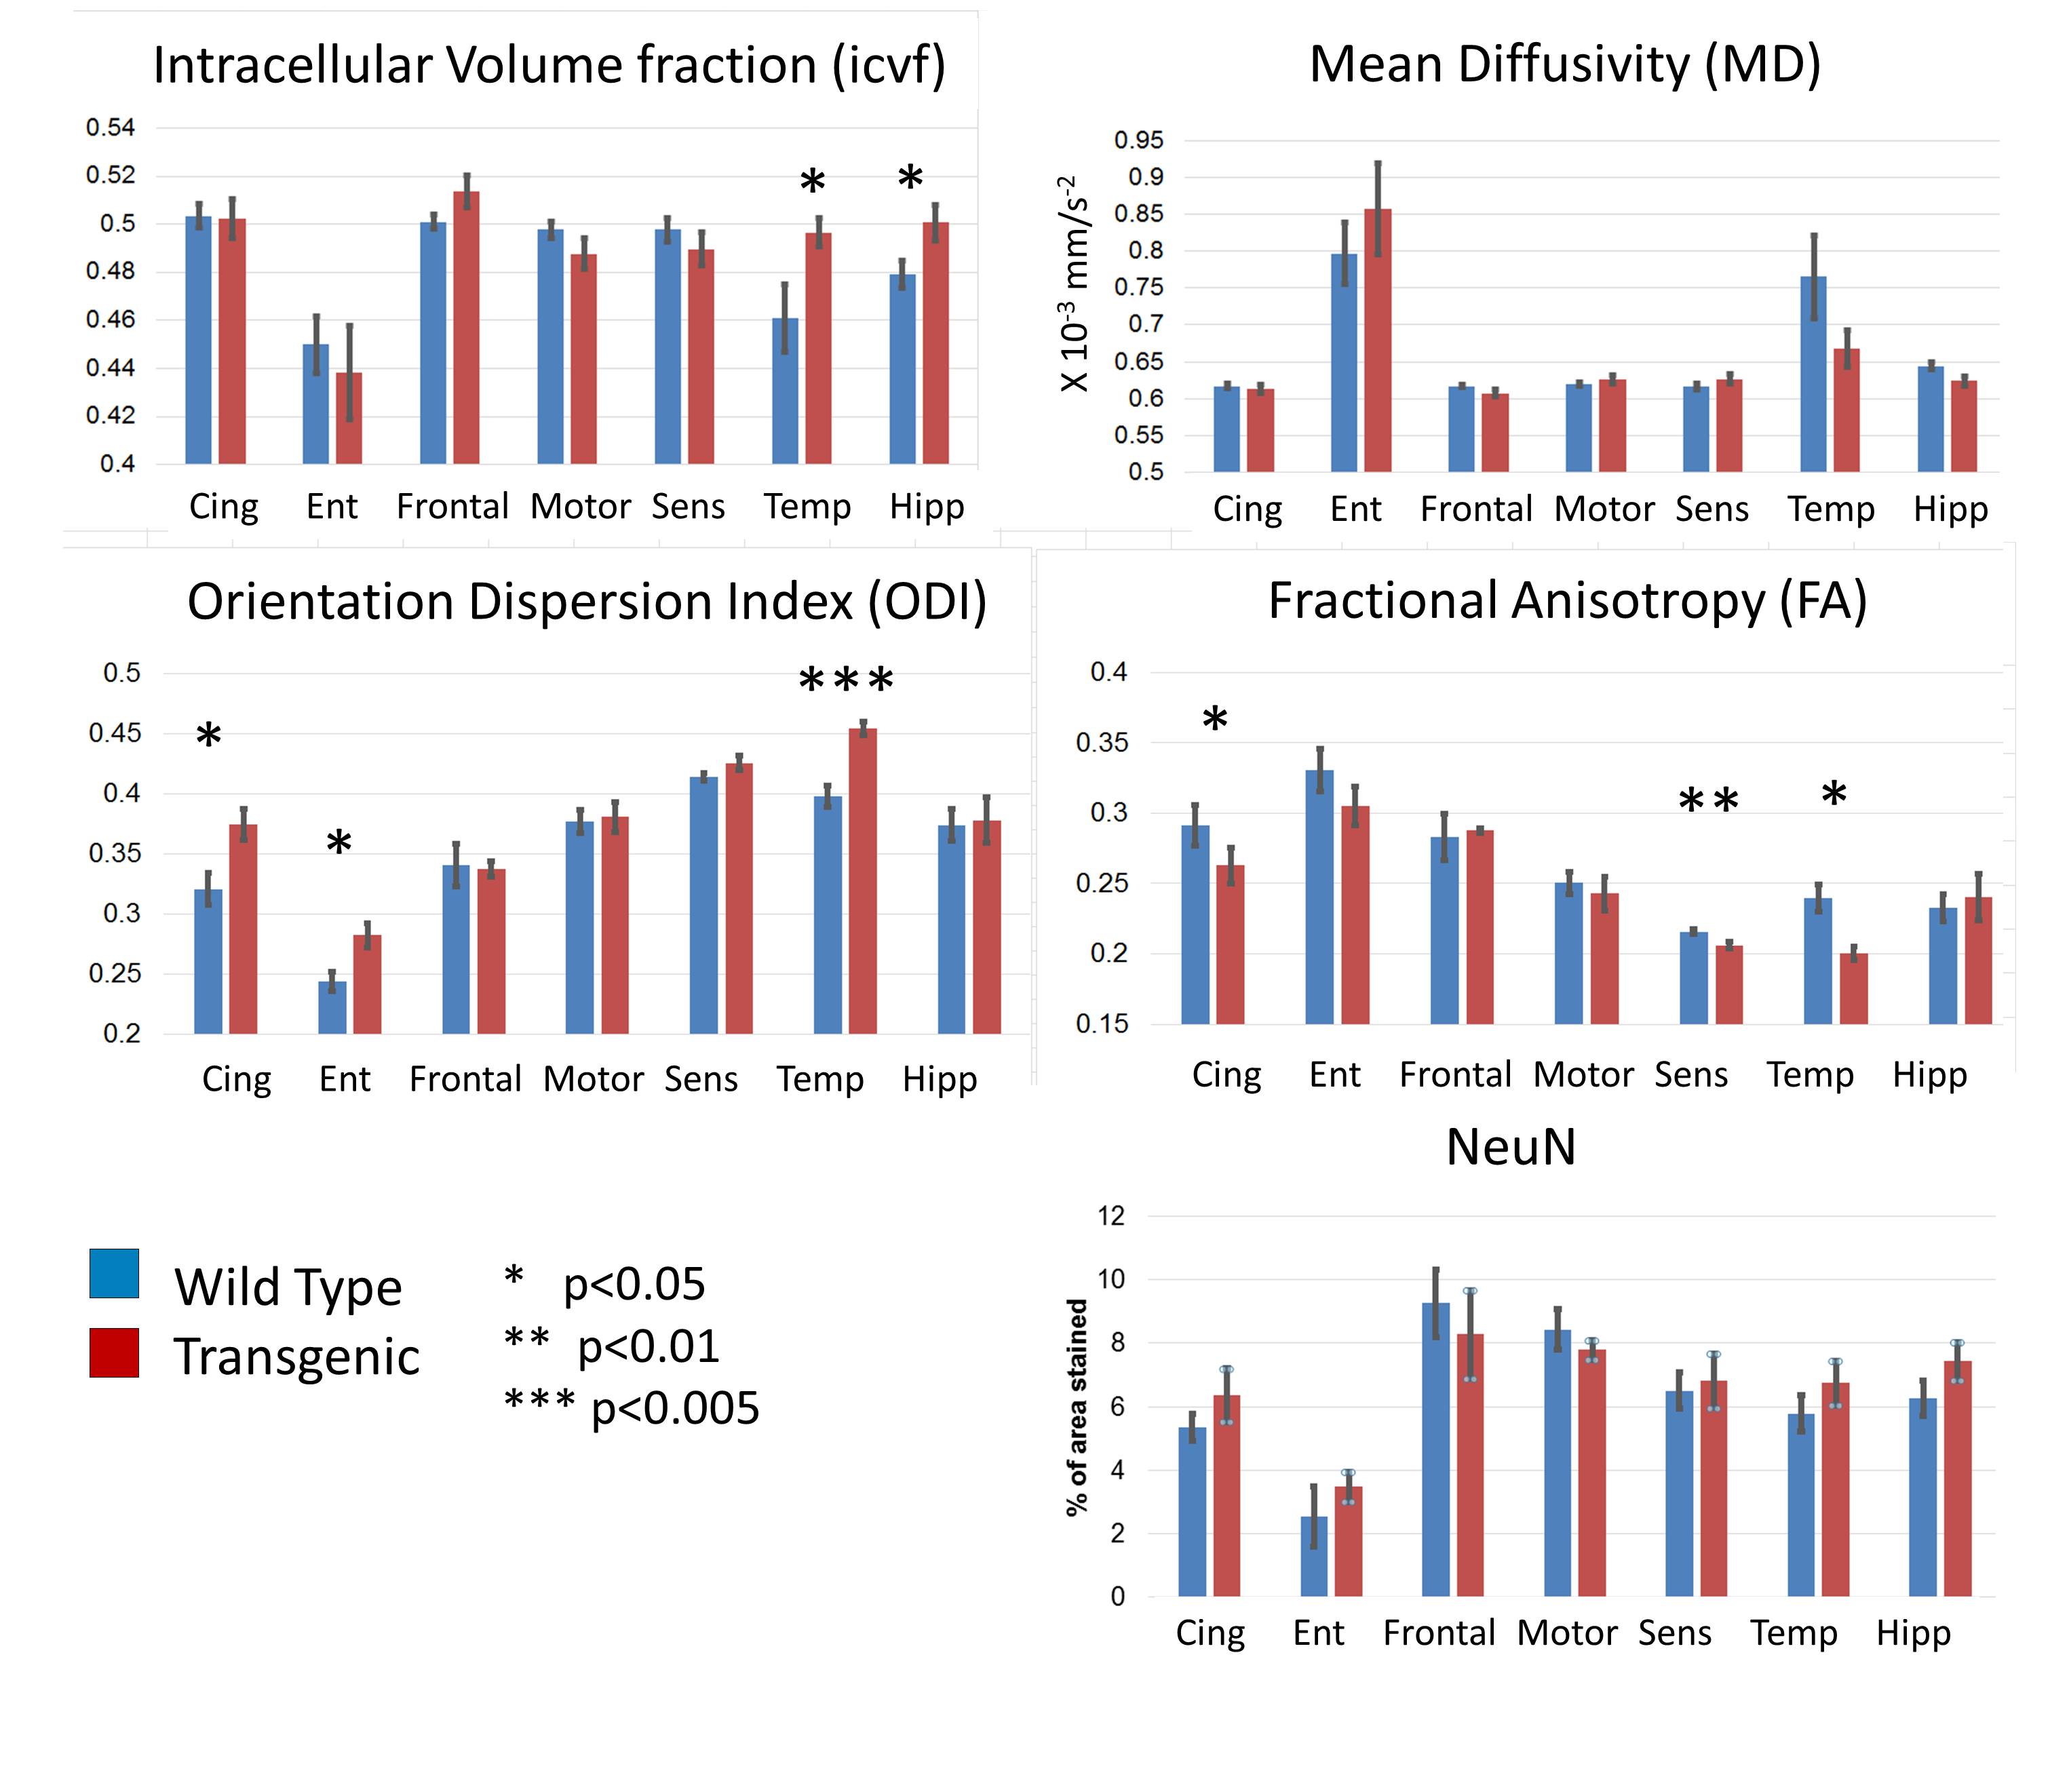
Regions: Cingulate Cortex (Cing), Entorhinal Cortex (Ent), Frontal Cortex (Frontal), Motor Cortex (Motor), Somatosensory Cortex (Sens), Temporal Cortex (Temp) and Hippocampus (Hipp).