5376
Non-invasive quantification of inflammation, axonal and myelin injury in MS: a 7T DBSI study1DINOGMI, University of Genoa/IRCCS AOU San Martino-IST, Genoa, Italy, 2Radiology, Washington University School of Medicine, St. Louis, MO, United States, 3Department of Advanced Biomedical Sciences, University of Naples "Federico II", Naples, Italy, 4Department of Neurology, Icahn School of Medicine at Mount Sinai, New York, NY, United States, 5Hope Center for Neurological Disorders, Washington University School of Medicine, St. Louis, MO, United States, 6Biomedical Engineering, Washington University, St. Louis, MO, United States, 7Biomedical MR Laboratory, Washington University School of Medicine, St. Louis, MO, United States
Synopsis
Diffusion basis spectrum imaging (DBSI) has successfully distinguished co-existing pathological processes in CNS diseases, such as multiple sclerosis (MS). The aim of our study was to determine the feasibility of DBSI in MS patients at 7T and to investigate the underlying pathological substrates of different lesion types and normal appearing white matter (NAWM).
For the first time, we proved the feasibility of DBSI at 7T, validating the specificity of the different metrics to diverse pathological substrates. Additionally, we employed DBSI metrics to characterize focal and diffuse tissue damage in different MS phenotypes, confirming their utility as biomarkers of tissue-specific microstructural damage.
Purpose
Diffusion basis spectrum imaging (DBSI) has successfully distinguished co-existing pathological processes in CNS diseases such as MS [1]. The aim of our study was to determine the feasibility of DBSI in MS patients at 7T and to investigate the underlying pathological substrates of different lesion types and normal appearing white matter (NAWM).Methods
$$$26$$$ MS patients ($$$16$$$ with relapsing [RR-MS] course, [$$$8$$$ females mean age $$$36±10.2$$$ years], and $$$10$$$ with progressive [P-MS] course, [$$$9$$$ females mean age $$$55.8±5.5$$$ years]) and $$$14$$$ healthy controls (HC), [$$$4$$$ females mean age $$$41.9±11.7$$$ years], were prospectively enrolled.
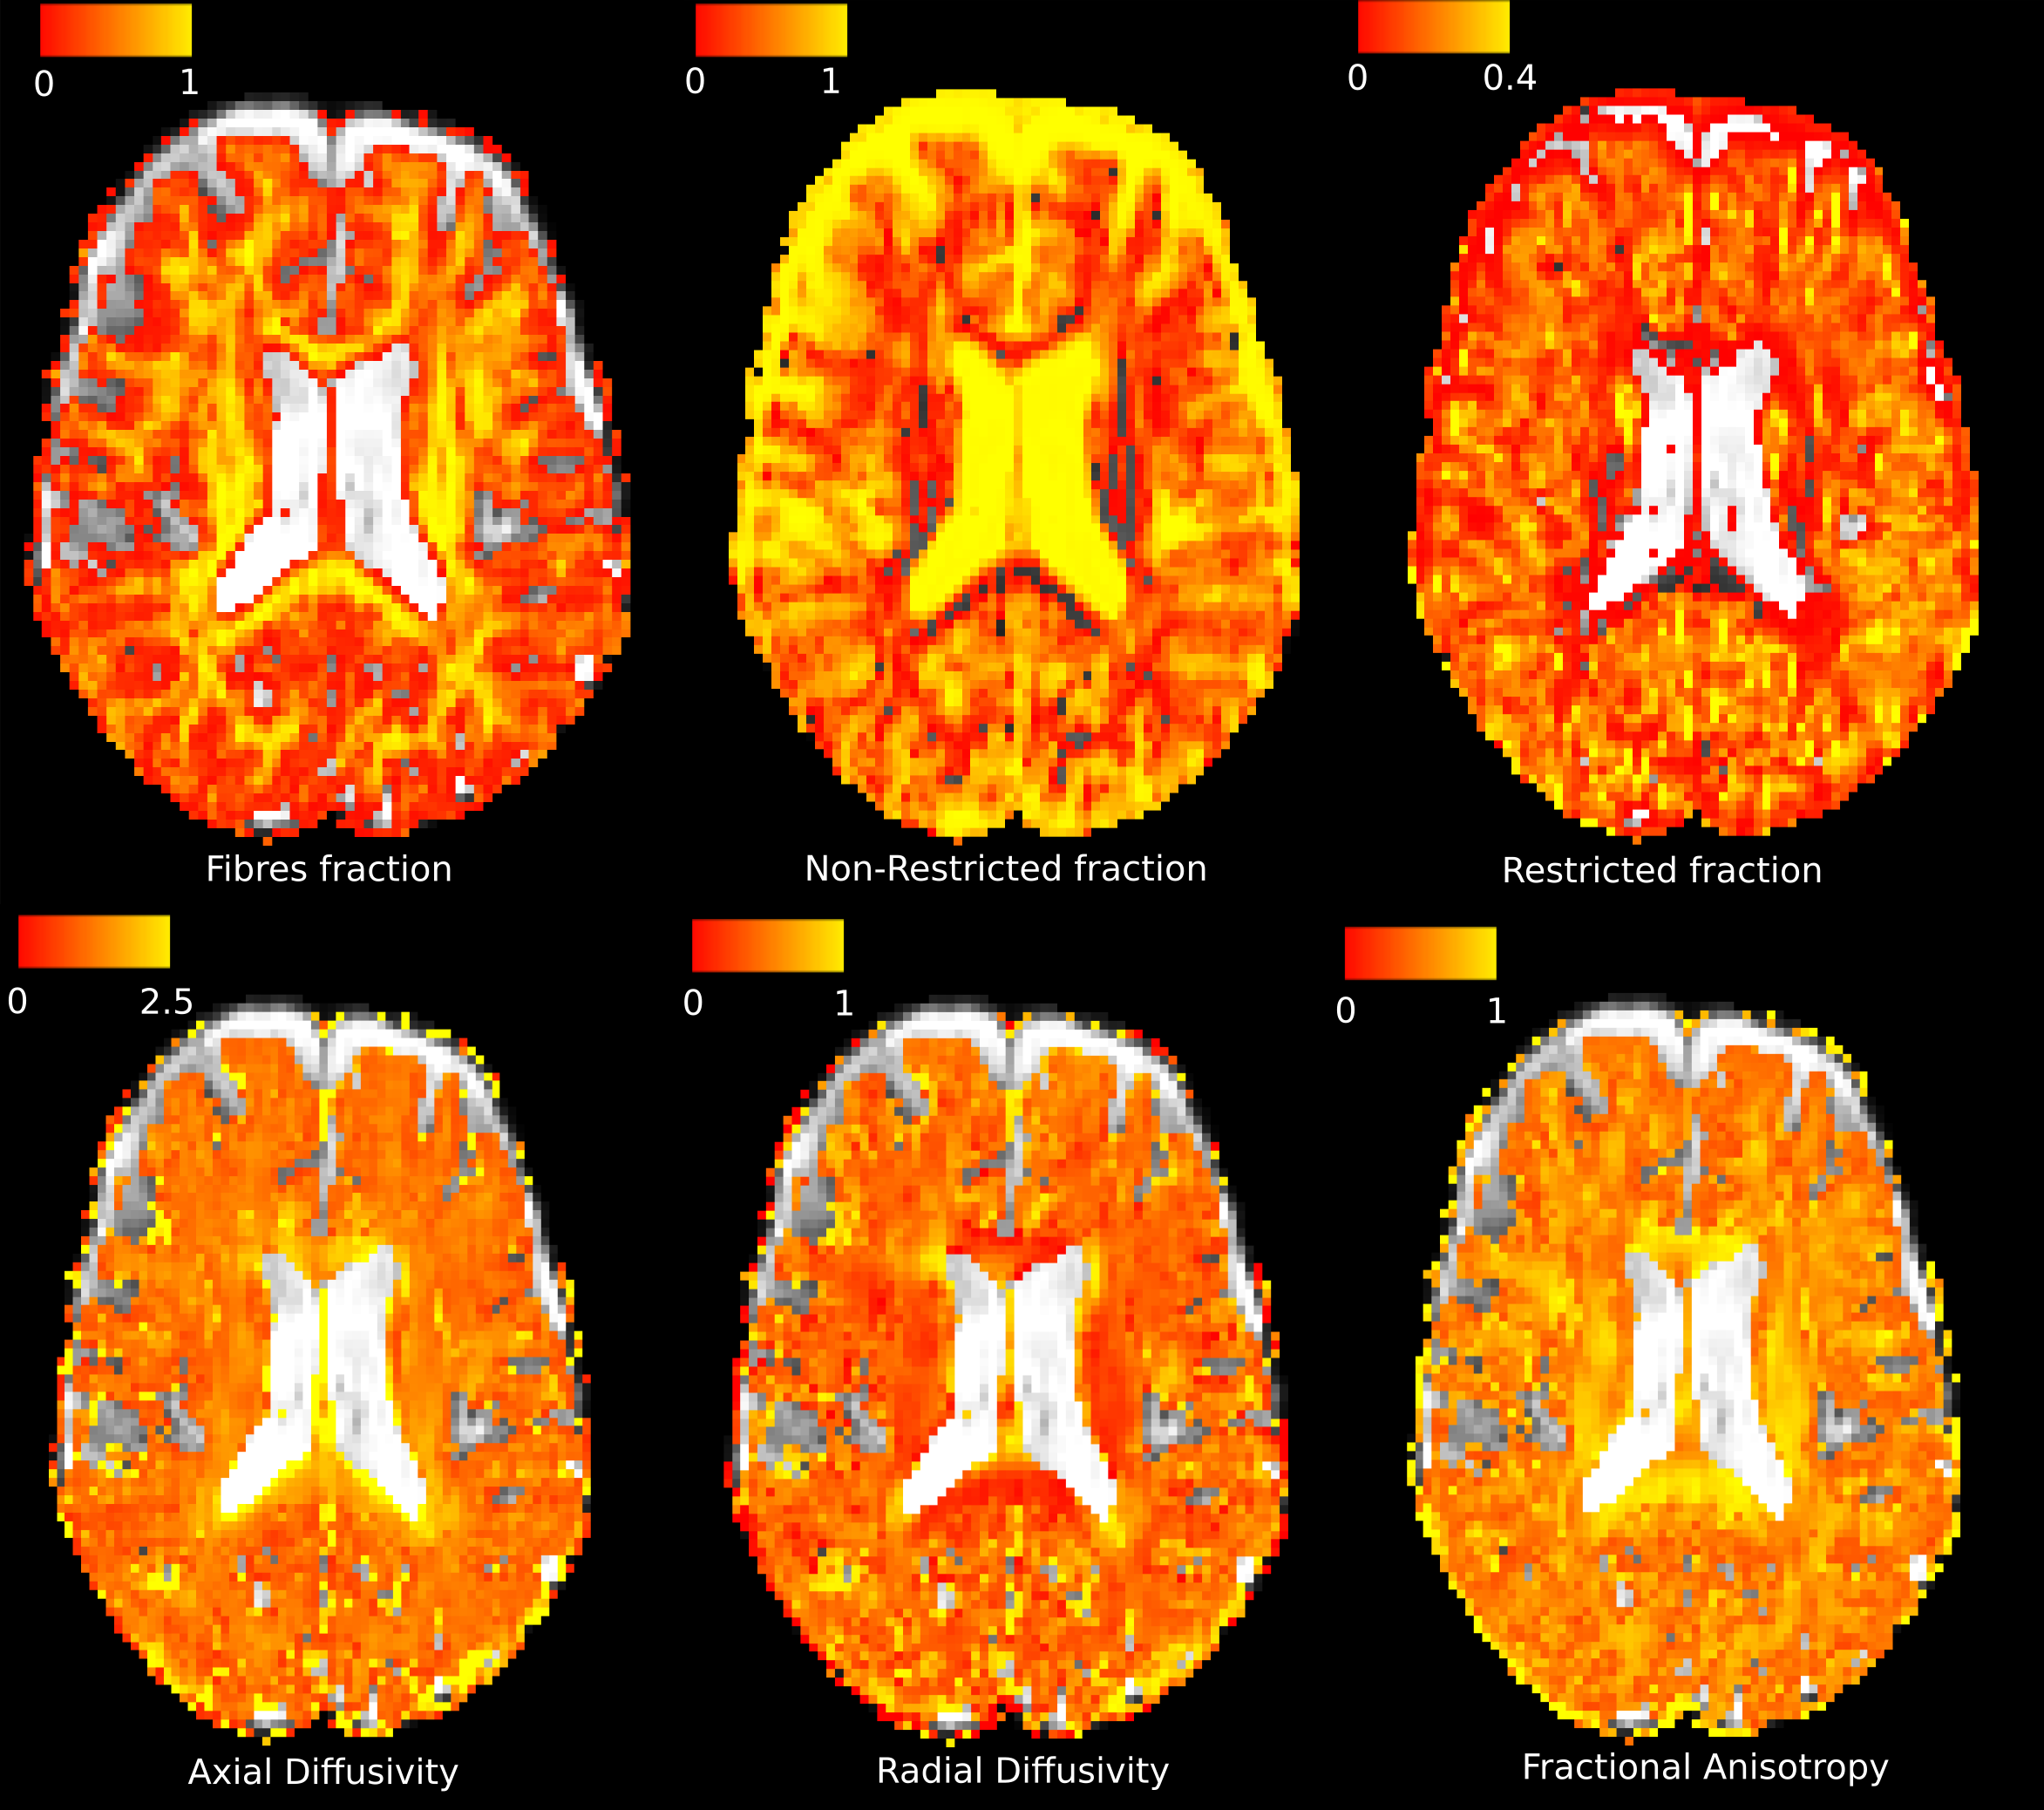
Diffusion-weighted images were collected on a Siemens MAGNETOM 7T scanner, with voxel size $$$2x2x2mm^3$$$, 99-direction diffusion weighting scheme selected as prescribed in diffusion spectrum imaging in human brain [2] and maximum b-value$$$=2000s/mm^2$$$. Also a 3D T2-weighted image and T1-weighted magnetization-prepared rapid gradient echo (MPRAGE) image with voxel size $$$0.7x0.7x0.7mm^3$$$ were acquired. DBSI images were corrected for motion and eddy currents. DBSI specific maps of fibres fraction (reflecting total content of fibres), non-restricted fraction (reflecting tissue destruction), restricted fraction (reflecting cellularity), axial diffusivity (reflecting fibres injury), radial diffusivity (reflecting myelination), FA (reflecting intact fibres integrity) were computed (Figure 1).
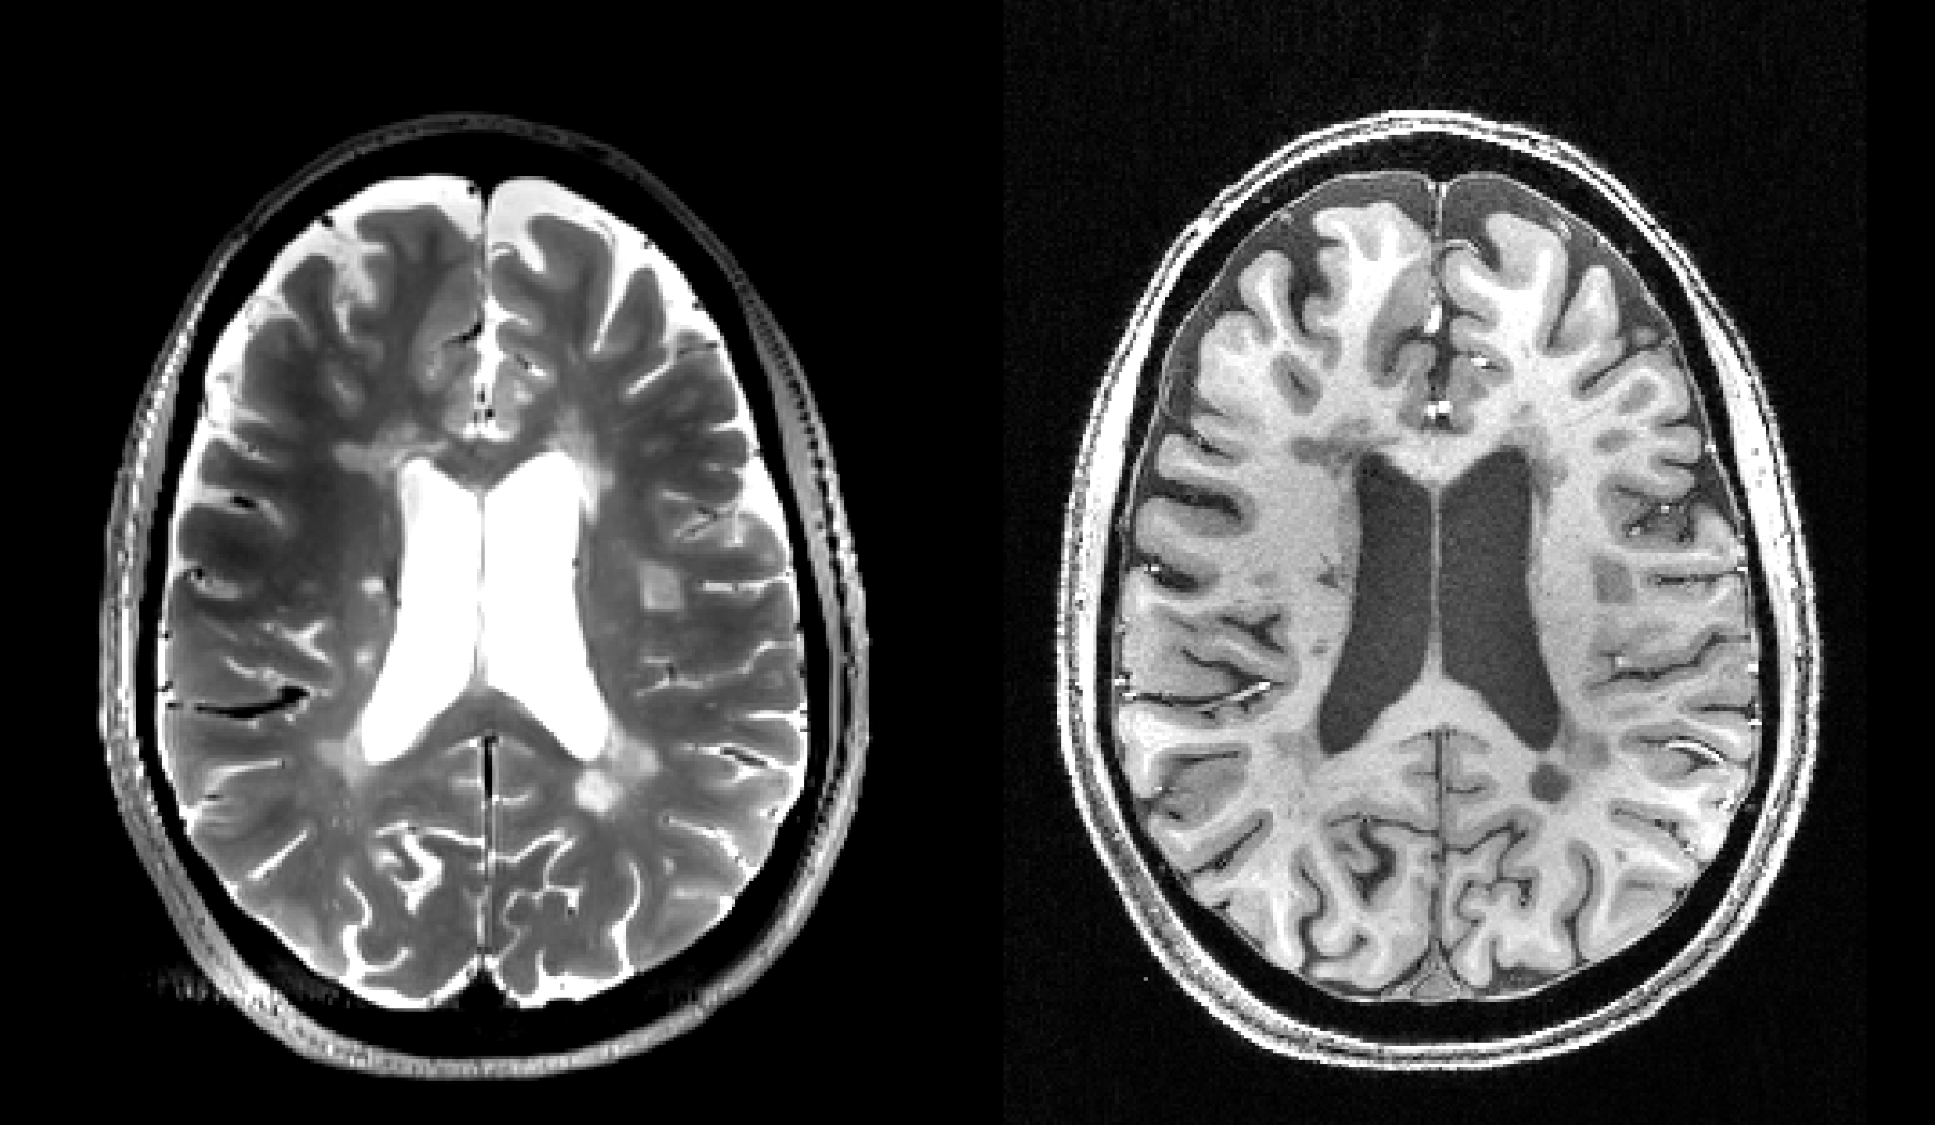
In patients WM lesions were outlined on T2w and T1w images (Figure 2) and classified in: a) T2w hyper-intense/T1w iso-intense (T2noT1); b) T2w hyper-intense/T1w hypo-intense (T2&T1); c) T2w hyper-intense/T1w black holes.
Mean values of the different DBSI metrics were extracted from whole-brain WM lesions as well as lesions and NAWM of corpus callosum (CC). Repeated measures ANOVA was used to compare the different types of lesions. A paired t-test was used to compare T2&T1 lesions and NAWM in CC in terms of DBSI-derived metrics. Between group ANOVA was used to compare the three groups of subjects in terms of DBSI-derived metrics controlling for age and gender.
Results and Discussion
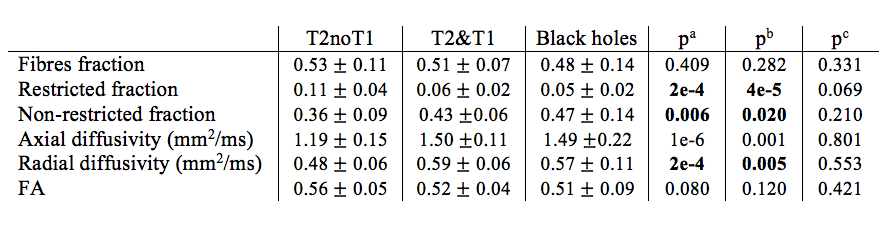
First, we tested the histopathological specificity of DBSI metrics comparing their mean values across lesion types over the entire brain. Results are summarized in Table 2. We found a significant difference between T2noT1 lesions in comparison with T2&T1 lesions and T1w black holes for restricted fraction (indicating higher cellularity in T2noT1 lesions), non-restricted fraction (indicating less tissue loss in T2noT1 lesions), radial diffusivity (indicating less demyelination and/or remyelination in T2noT1 lesions). In contrast with what previously reported in the animal model [3], axial diffusivity showed higher values in T2&T1 lesions than T2noT1. This could be explained by the fact that in T2&T1 and black holes we are in presence not only of axons injury, but also axons loss and, in this case, axial diffusivity itself could not be sufficient to characterize the underlying pathological mechanism. These results confirm the specificity of DBSI metrics, that seem to adequately characterize both tissue loss in more destructive lesions (black holes) and myelin content/cellularity in less destructive lesions (T2noT1 lesions).
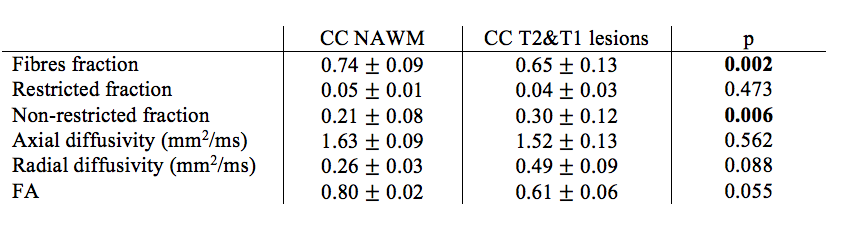
We then measured DBSI metrics in CC without lesions (NAWM) and compared the mean values with those of T2&T1 lesions in all patients presenting at least one T2&T1 lesion within the CC (n=16). As reported in Table 1, significant differences were observed for fibres fraction and non-restricted fraction. A significance trend was also identified for radial diffusivity and FA. Such result demonstrates the sensitivity of DBSI metrics to different degrees of tissue damage.
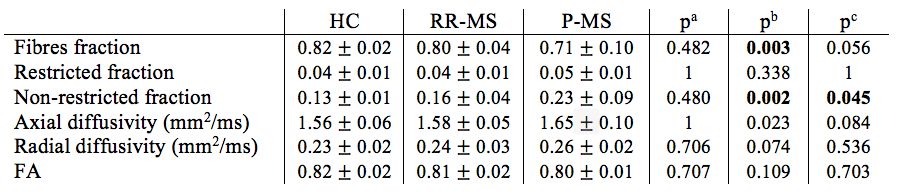
Finally, we tested the difference in DBSI metrics within CC NAWM between patients and HC. In Table 3 we report the relative results, with significant differences identified for fibres and non-restricted fractions among RR-MS, P-MS patients and HC. Additionally, non-restricted fraction was significantly different between RR-MS and P-MS, suggesting more tissue loss in P-MS patients. Again the axial diffusivity was significantly different, but not in the expected direction. In this case, the increment in axial diffusivity could be related to the high presence of crossing fibres in CC. These results demonstrate the applicability of DBSI metrics as biomarkers of tissue microstructural damage in-vivo, suggesting their application in research settings to explore the presence and evolution of tissue damage in different clinical phenotypes.
Conclusion
For the first time we proved the feasibility of DBSI at 7T, confirming the specificity of the different metrics to diverse pathological correlates. Additionally, we employed DBSI metrics to characterize focal and diffuse tissue damage in different MS phenotypes, confirming their utility as biomarkers of tissue-specific microstructural damage. The ability to quantify the cellular component of lesions and NAWM may help understand the interplay between innate and adaptive immune cells and myelin and axonal changes in driving tissue repair or damage. As such, DBSI parameters represent a promising tool to investigate MS pathophysiology.Acknowledgements
References
[1] Wang Y, Sun P, Wang Q, et al. Differentiation and quantification of inflammation, demyelination and axon injury or loss in multiple sclerosis. Brain. 2015;138(5):1223-1238. doi:10.1093/brain/awv046.
[2] Wang Y, Wang Q, Haldar JP, et al. Quantification of increased cellularity during inflammatory demyelination. Brain. 2011;134(12):3587-3598. doi:10.1093/brain/awr307.
[3] Wang X, Cusick MF, Wang Y, et al. Diffusion basis spectrum imaging detects and distinguishes coexisting subclinical inflammation, demyelination, and axonal injury in experimental autoimmune encephalomyelitis mice. NMR in biomedicine. 2014;27(7):843-852. doi:10.1002/nbm.3129.
Figures