5374
Heterochronous regional white matter development in pre-adolescent children: diffusion kurtosis imaging study1Institute of Neuroscience and Medicine 4, Forschungszentrum Jülich, Jülich, Germany, 2Department of Neurology, Faculty of Medicine, RWTH Aachen University, Aachen, Germany, 3Child Neuropsychology Section, Department of Child and Adolescent Psychiatry and Psychotherapy, RWTH Aachen University, Aachen, Germany, 4Institute of Neuroscience and Medicine 3, Forschungszentrum Jülich, Jülich, Germany, 5Department of Psychiatry, Psychotherapy and Psychosomatics, RWTH Aachen University, Aachen, Germany
Synopsis
Diffusion tensor imaging, and, more recently, diffusion kurtosis imaging enables the examination of white matter connectivity and of in vivo microstructural changes across the lifespan. However, only very few diffusion kurtosis imaging studies have addressed white matter maturation. Here we explore which specific brain regions continue to develop throughout late childhood into the adulthood as revealed by kurtosis tensor metrics. We show the potential of these metrics as maturation-sensitive
Introduction
Diffusion MRI techniques, such as diffusion tensor imaging (DTI) and, more recently, diffusion kurtosis imaging (DKI), made possible obtaining valuable information regarding in vivo microstructural tissue changes and neuronal circuitry during development and ageing. Patterns of cerebral maturation and decline render non-monotonic lifespan age trajectories of DTI/DKI metrics. However, only very few DKI studies have been reported in relation to development1,2. Recently, we have shown1 that kurtosis tensor (KT) metrics are more sensitive to developmental changes during adolescence than diffusion tensor (DT) metrics and can better reflect heterochronicity in maturation of various fibre groups (association (AF), projection (PF), and commissural (CF) fibres). Driven by the interest in this phenomenon, we extended our preliminary work to a large number of WM tracts aiming to explore a) which specific brain regions continue to develop throughout late childhood into the adulthood as revealed by KT metrics, b) a potential of KT metrics to “rank” maturation of WM tracts. Additionally, we provided a comparison with ages of peak/minima reported in literature3 for DT metrics.Materials and Methods
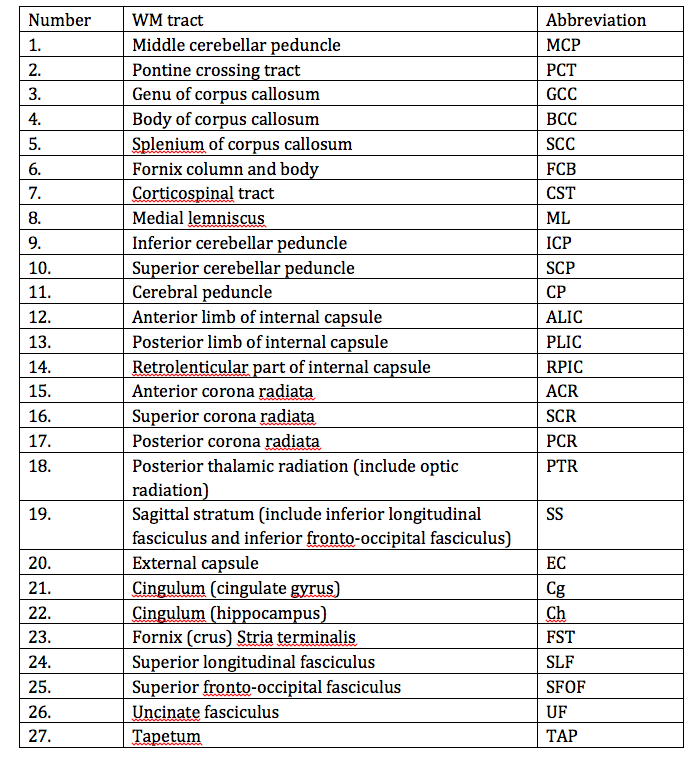
Two groups of healthy volunteers, 20 children (range, 9-12 years) and 21 middle-age adults (range, 38–64 years) underwent DKI at a 3T Siemens MAGNETOM scanner. Typical DT/KT metrics (mean/axial/radial diffusivity (MD/AD/RD), mean/axial/radial kurtosis (MK/AK/RK), fractional and kurtosis anisotropy (FA/KA) were determined on a voxel-by-voxel basis and averaged over 27 WM tracts, see Table 1, provided by John-Hopkins-University WM Atlas “ICBM-DTI-81”. For each tract we evaluated: a) relative changes (Δ) in percentage and effect size based on Cohen’s d between the group mean parameter values, b) p-values of the two-sided Student’s t-test analysis. We produced correlation plots between Cohen’s d values for MK (dMK) and age of extrema in life trajectories of FA/MD using the age of peak/minima reported in the literature3.Results
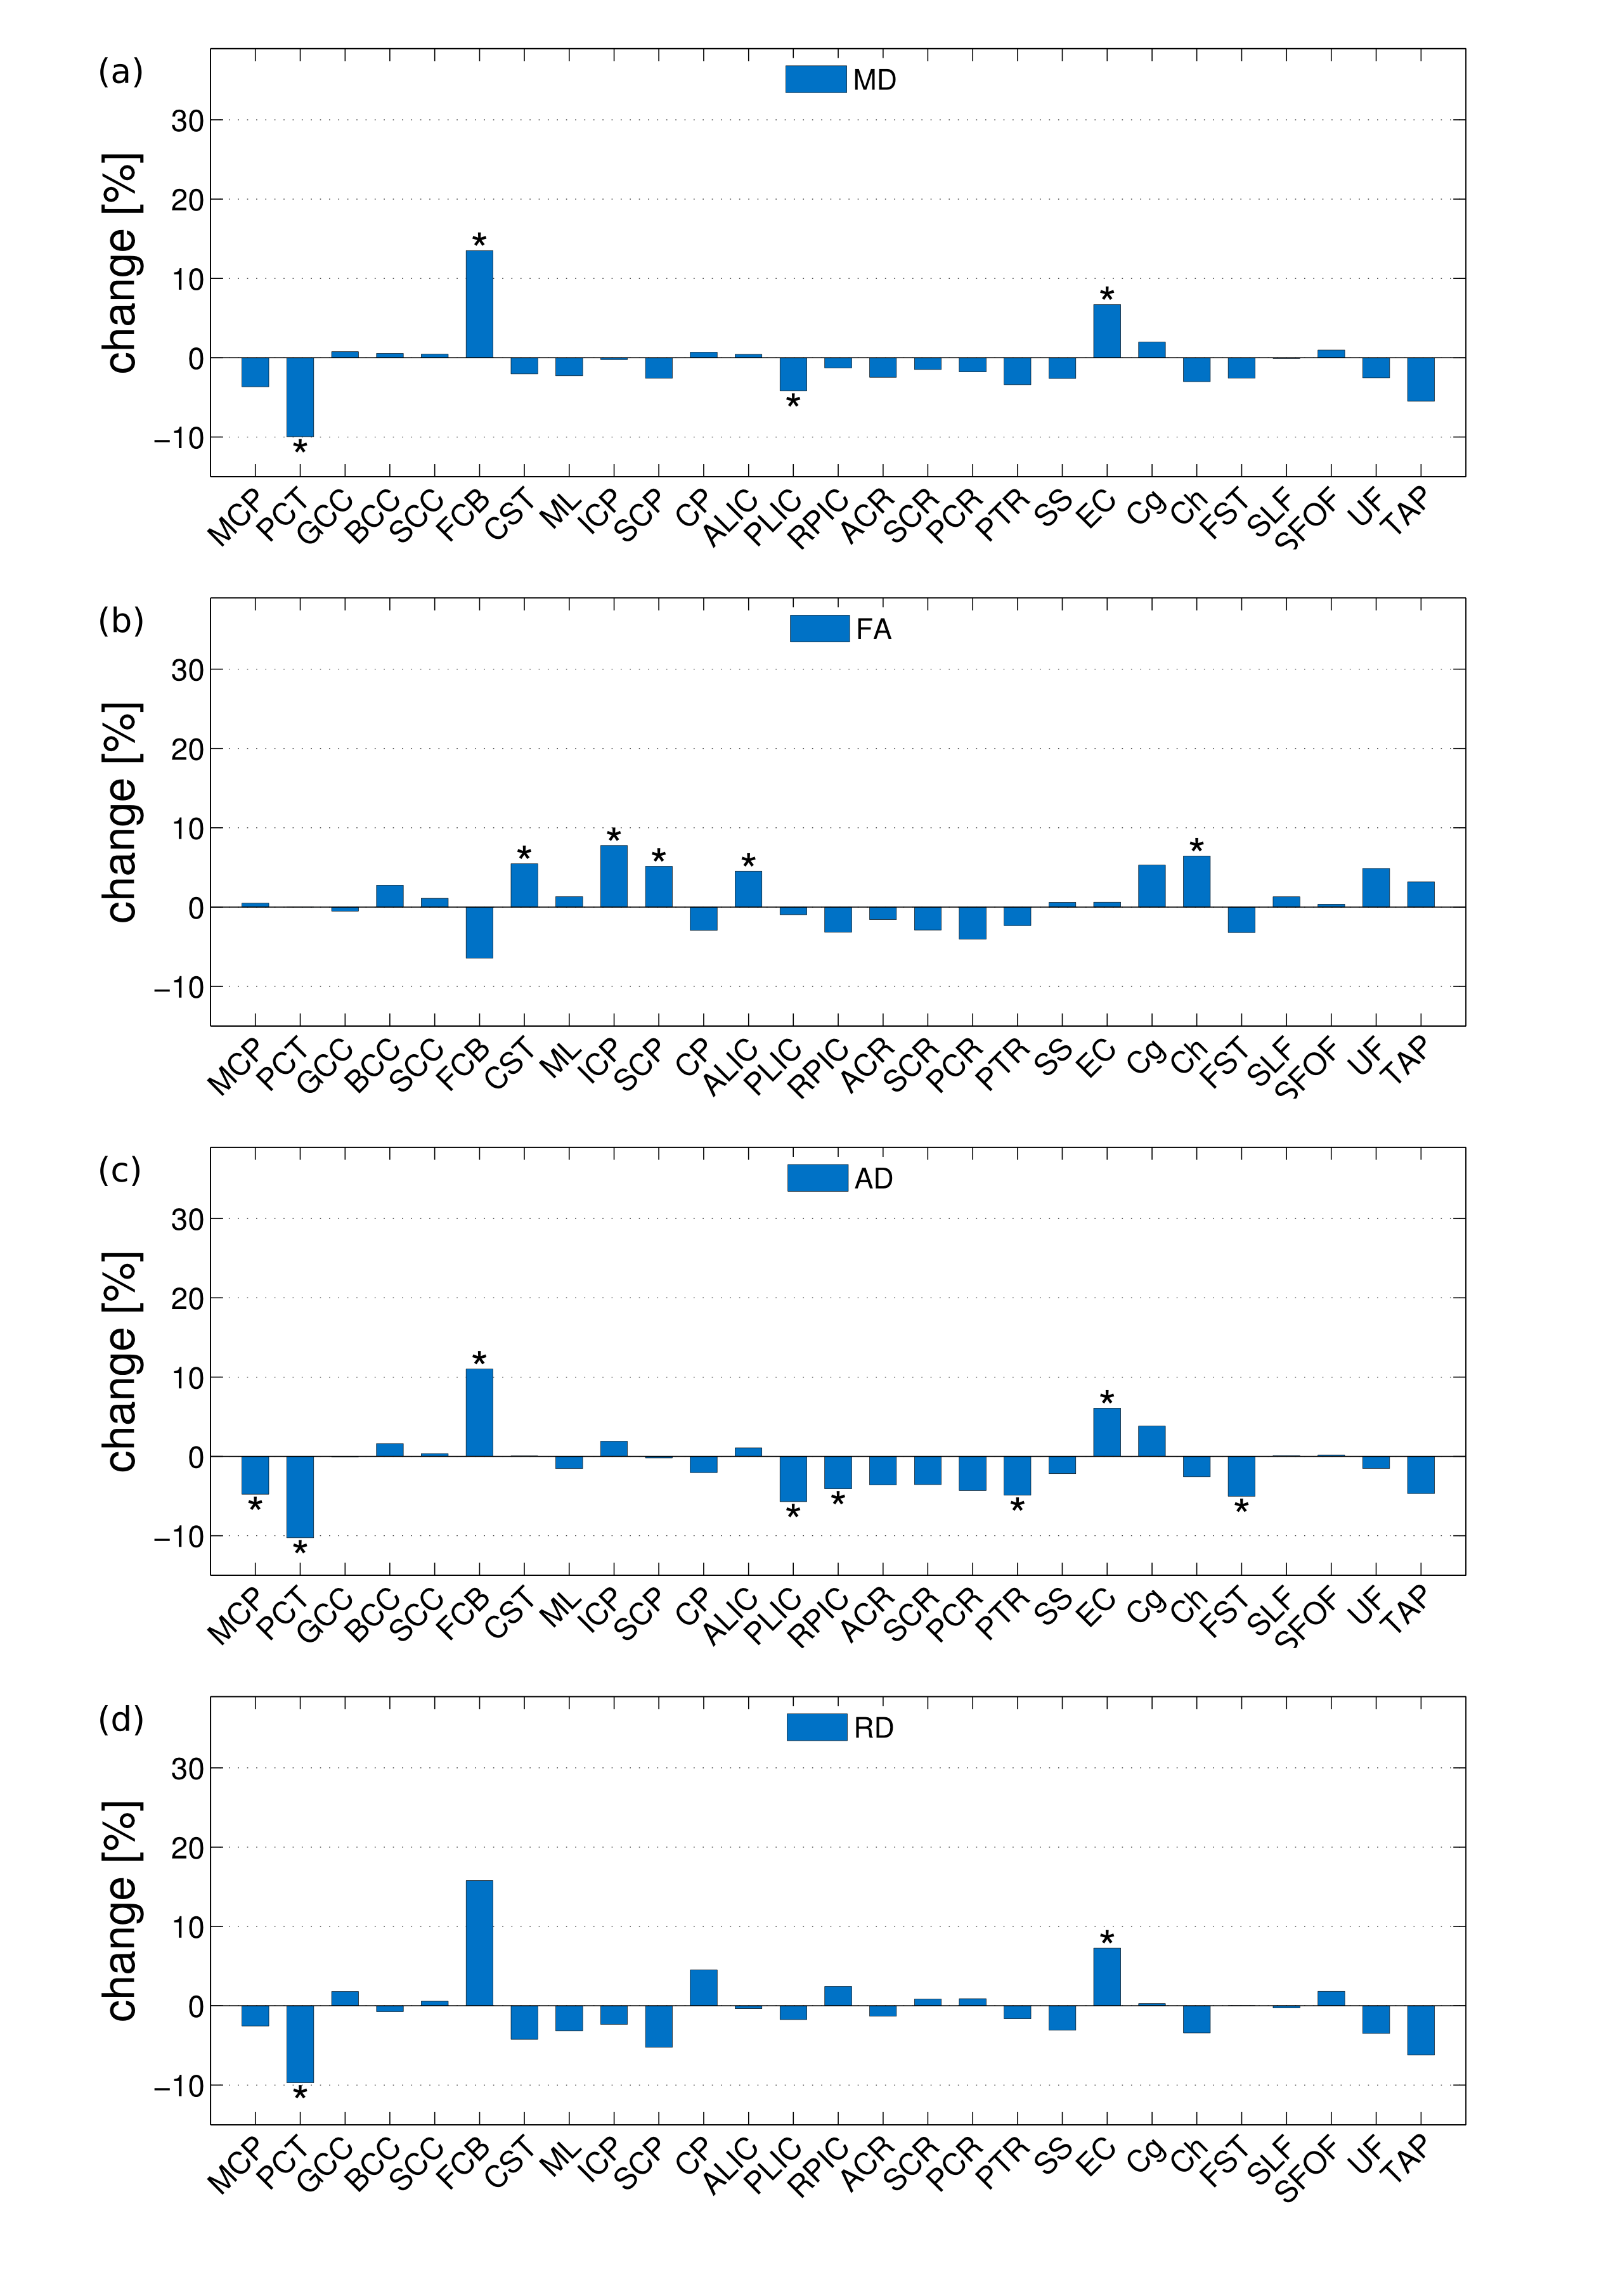
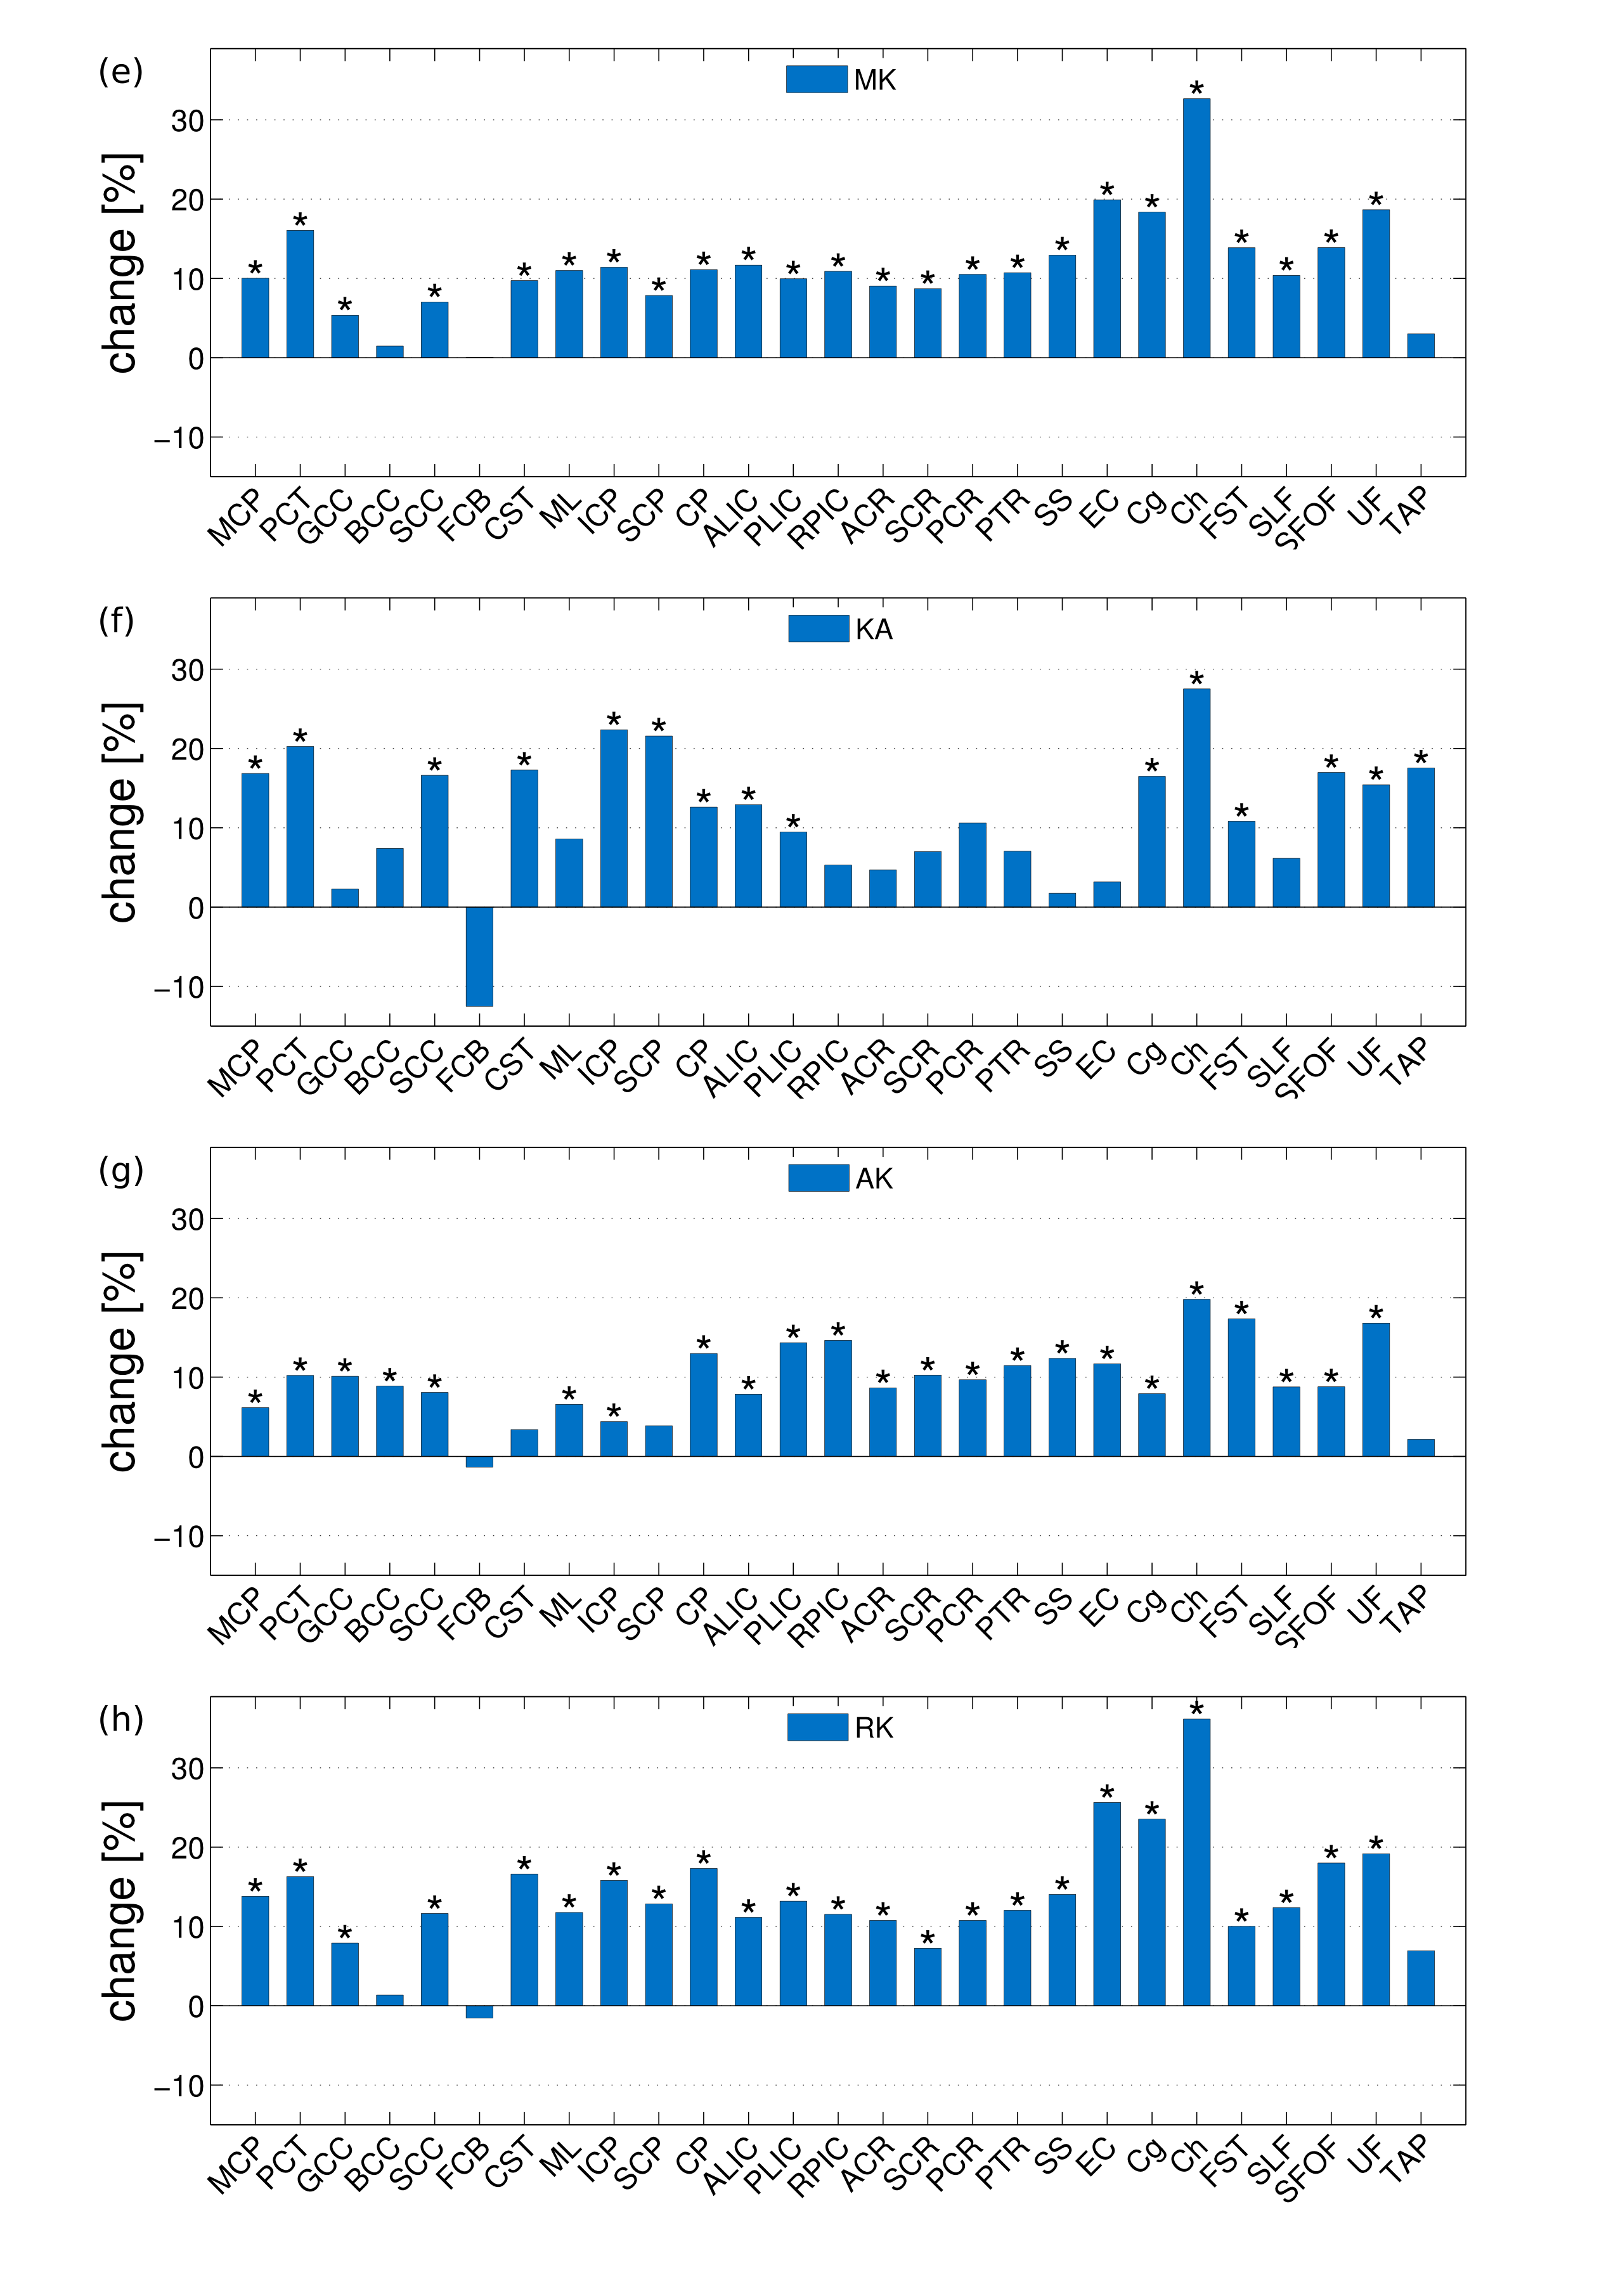
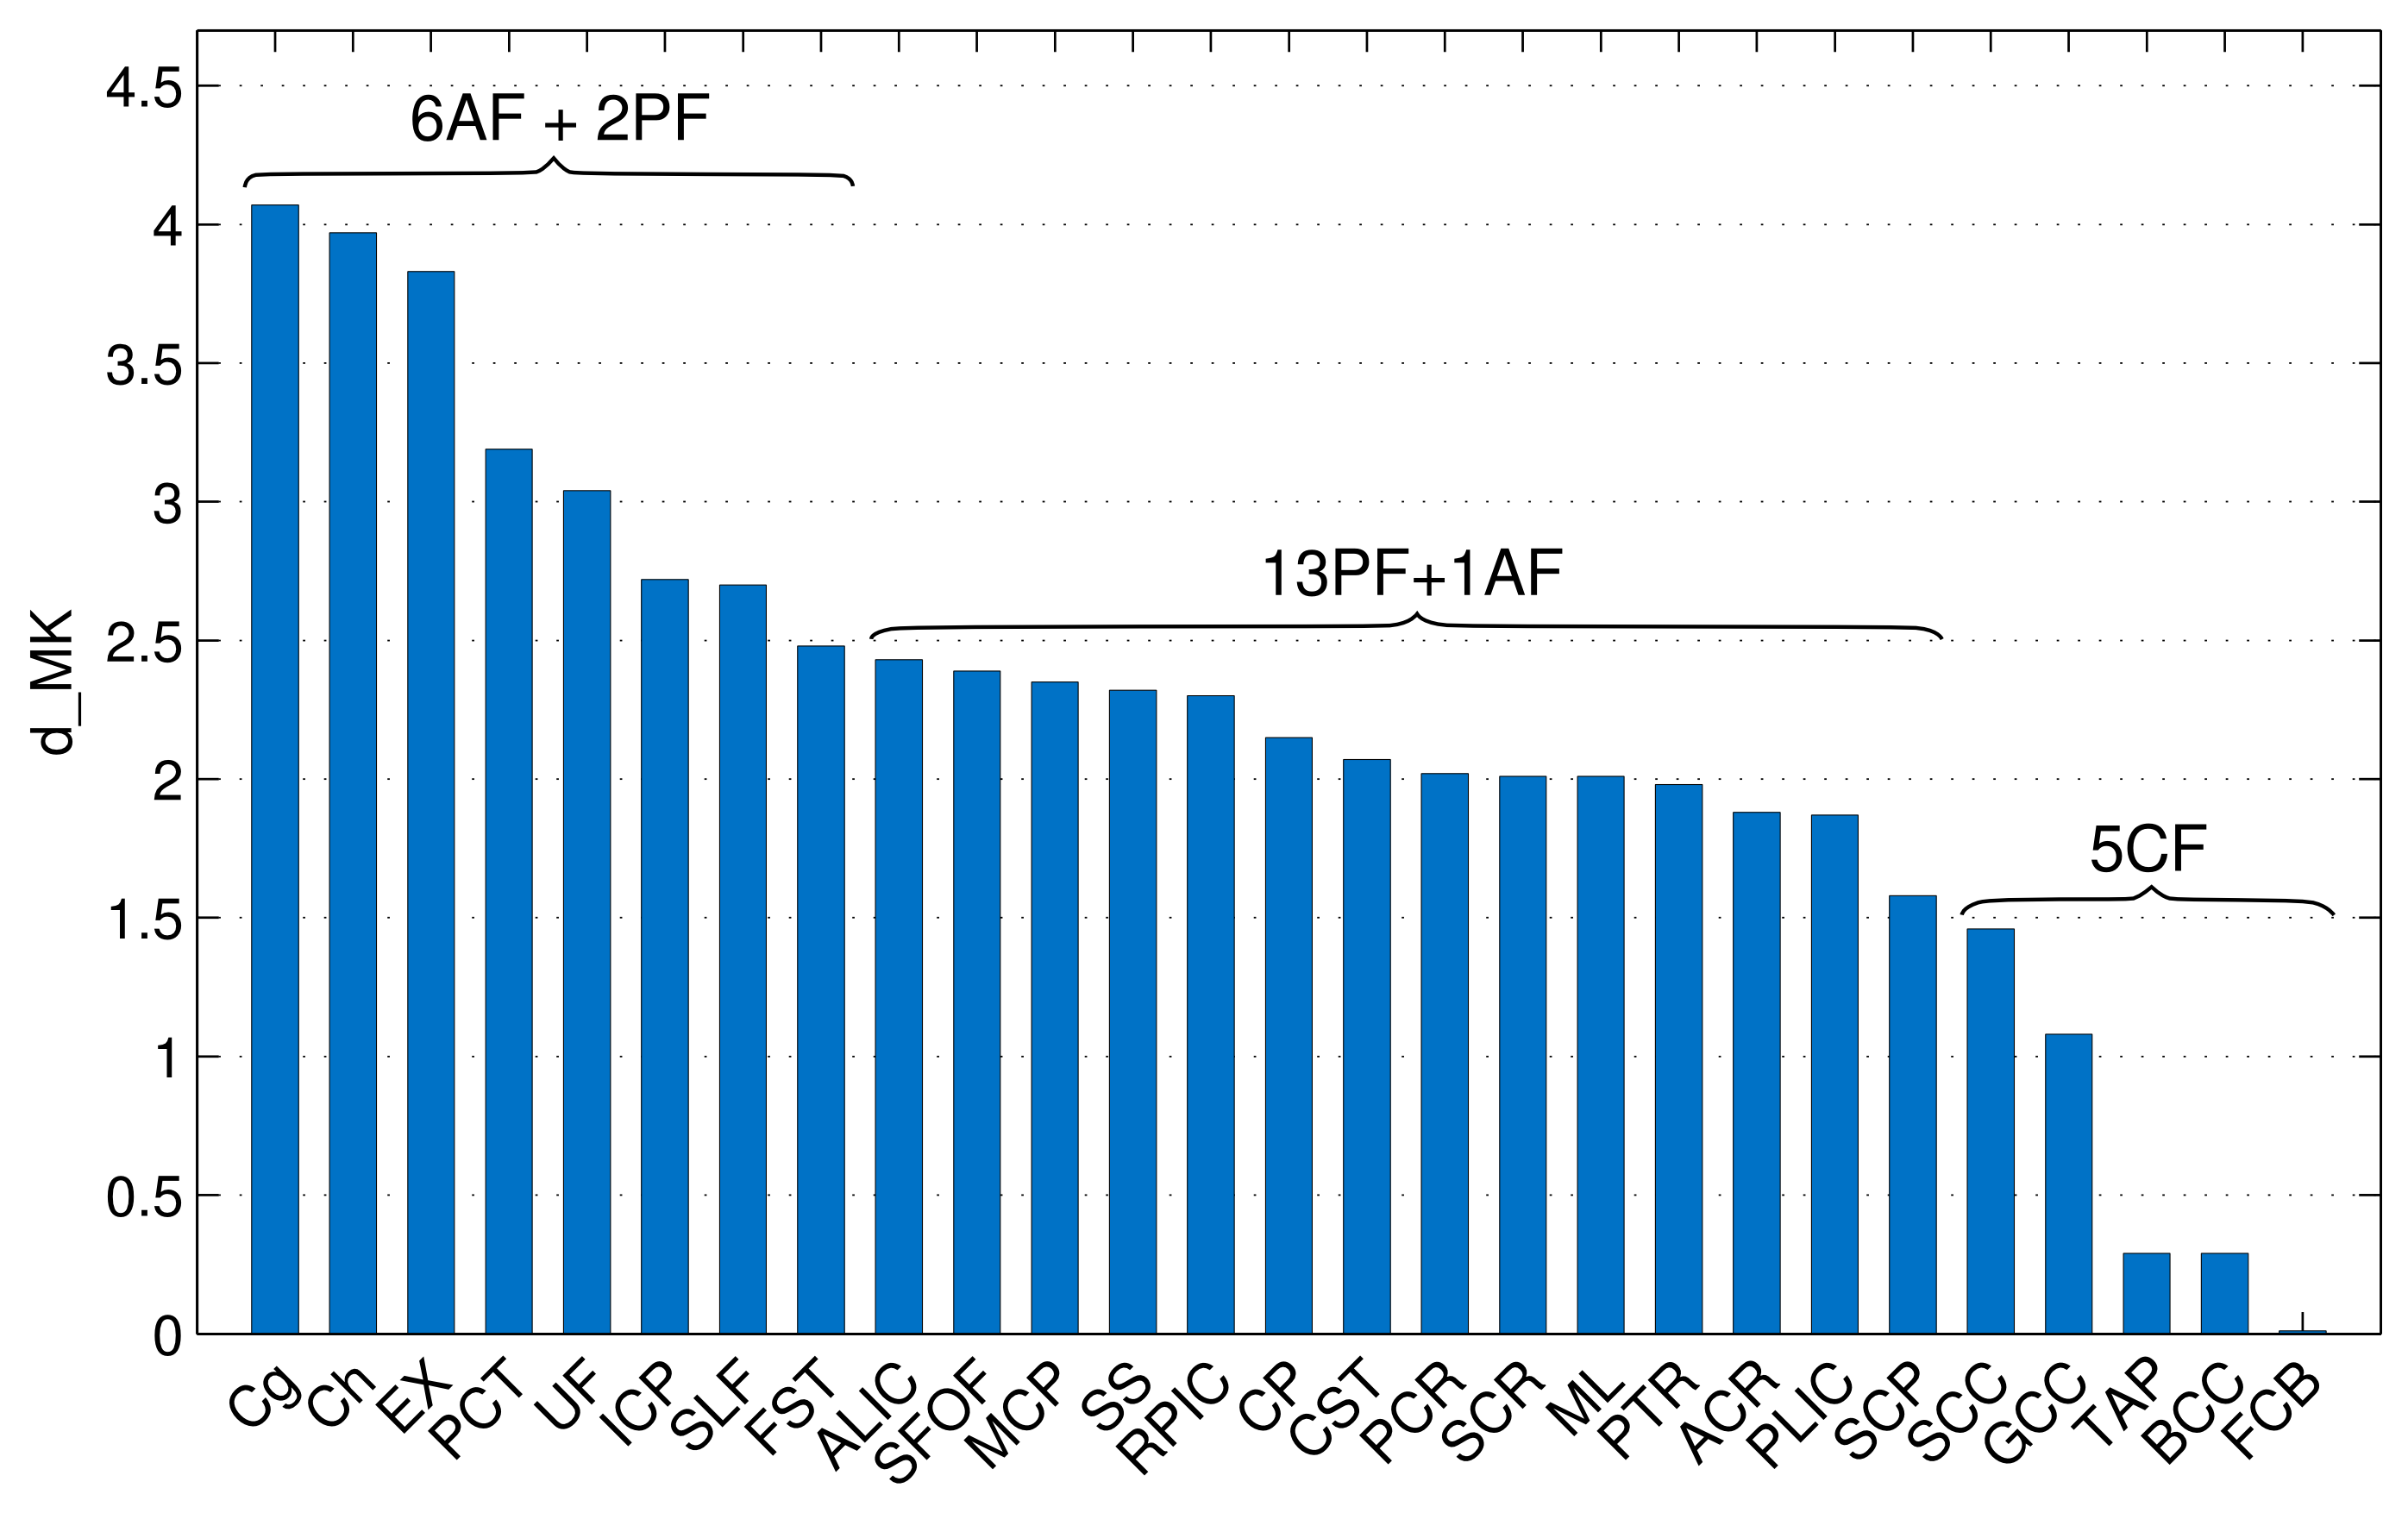
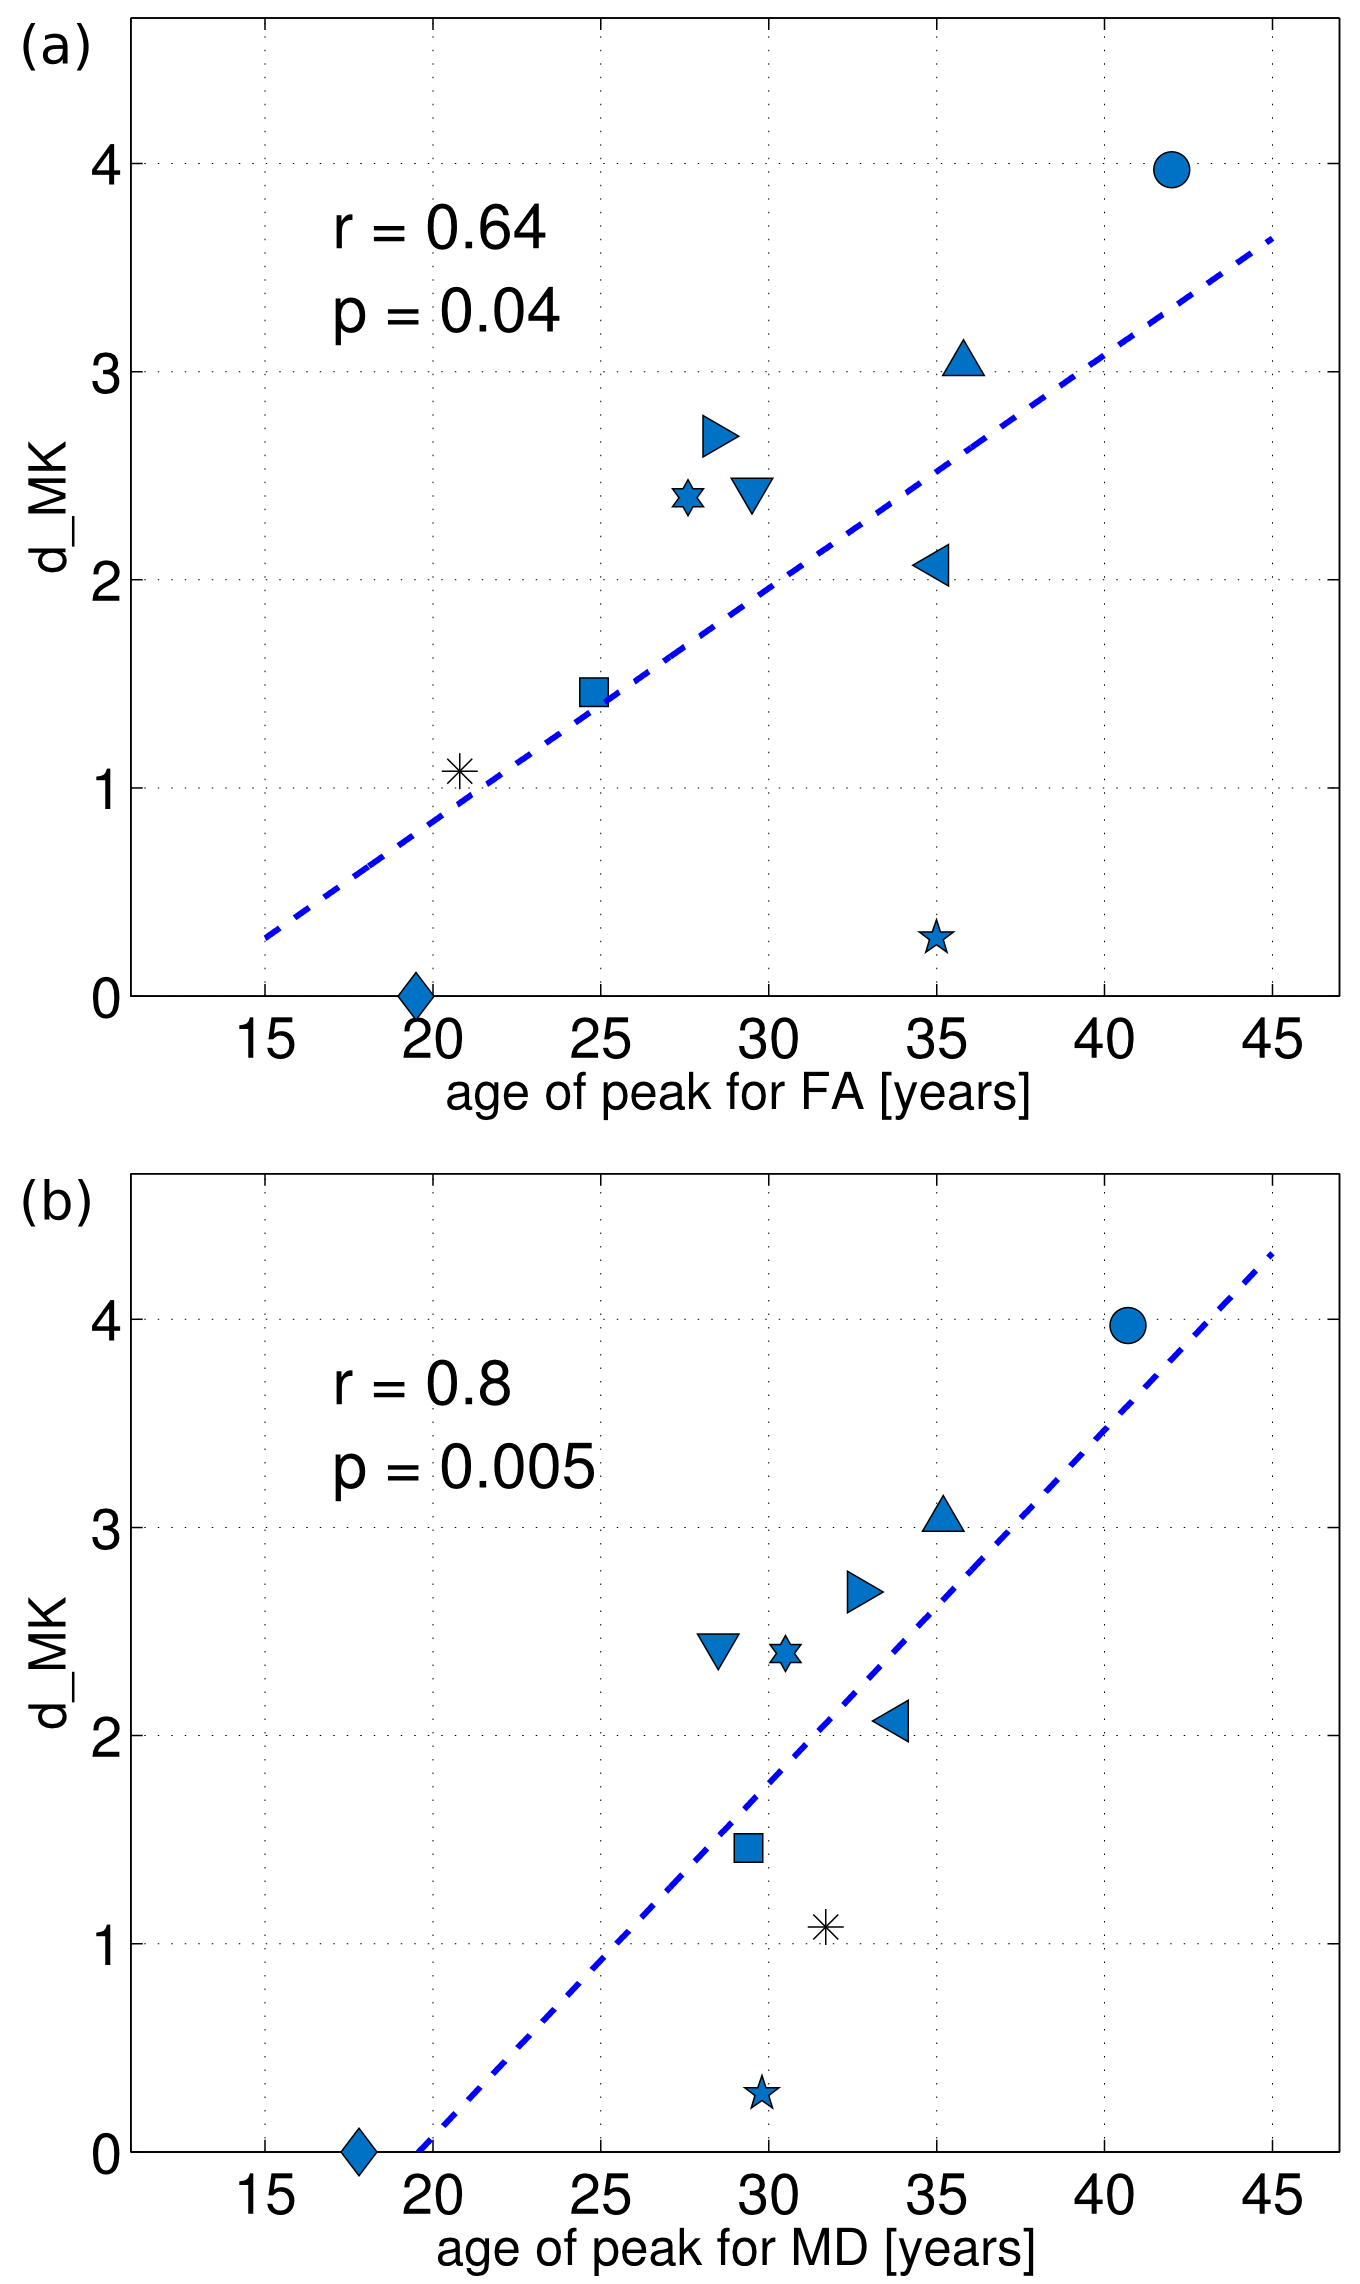
The between-group differences were considerably larger for DK than for DT metrics in any individual fibre, Figures 1 and 2. The observed absolute differences between the group means, on average across the fibres, were smaller in any DT metrics compared to KT metrics (compare Δ values of 2.9 % for FA/MD and 3.2% for AD/RD with 11.3/9.6/13.7/12.3% for MK/AK/RK/KA, or Cohen’s d values of 0.55/0.75/0.43/0.58 for MD/AD/RD/FA with 2.17/2.02/1.90/1.28, i.e., “huge” effect size, for MK/AK/RK/KA). Figure 3 shows the bar plot of dMK in descending order from left to right for all investigated fibres. The range of the observed values varies from nearly zero for FCB to ~ 4 for Cg and Ch. That is, all 5 fibres with the smallest dMK were CFs, whereas all 5 fibres (except PCT) with the largest dMK were AFs. The quartile analysis showed that the 1-st quartile (dMK = 1.87) includes all of the studied CFs plus two PFs, the range between the 1-st quartile and the median (dMK = 2.15) includes 9 PFs, the range between the median and the 3-d quartile (dMK = 2.58) includes 3 more PFs and 3 AFs, and the range between the 3-d and 4-th quartiles includes 6 AFs + 2 PFs. We thus see that the AFs, PFs, and CFs can be to a large extent “sorted” by their dMK values with a clear tendency for AFs to exhibit the largest values (the most protracted maturation) and for CFs the smallest values (the most complete maturation). Figure 4 shows the scatter plots of dMK versus age of peak/minima3 for FA/MD for 10 investigated fibres. Respective Pearson correlation coefficients r equal to 0.6/0.8 provide an evidence for strong correlation of dMK with the age at which FA and MD reach their extremal values.Discussion
Conclusion
Diffusion kurtosis metrics, in particular, dMK of differently aged groups, provides a promising biomarker for elucidation of heterochronous maturation and will substantially enrich the palette of maturation-sensitive MRI tools.Acknowledgements
No acknowledgement found.References
[1] Grinberg, F., Maximov, II, Farrher, E., et al. Diffusion kurtosis metrics as biomarkers of microstructural development: A comparative study of a group of children and a group of adults. Neuroimage, 2017, 144:12-22 (see also references therein).
[2] Paydar, A., Fieremans, E., Nwankwo, et al. Diffusional kurtosis imaging of the developing brain. AJNR Am J Neuroradiol, 2014, 35: 808-814.
[3] Lebel, C., Gee, M., Camicioli, R., et al. Diffusion tensor imaging of white matter tract evolution over the lifespan. Neuroimage, 2012, 60:340-352.
[4] Kochunov, P., Williamson, D.E., Lancaster, J., et al. Fractional anisotropy of water diffusion in cerebral white matter across the lifespan. Neurobiol Aging, 2012, 33: 9-20.
[5] Hasan, K.M., Kamali, A., Abid, H., et al. Quantification of the spatiotemporal microstructural organization of the human brain association, projection and commissural pathways across the lifespan using diffusion tensor tractography. Brain Struct Funct, 2010, 214:361-373.
Figures