5371
Abnormal cerebellar wiring in a mouse model of Down syndrome revealed by HARDI-based tractography1Department of Radiology, Johns Hopkins University School of Medicine, BALTIMORE, MD, United States, 2Department of Physiology and Institute for Genetic Medicine, Johns Hopkins University School of Medicine, BALTIMORE, MD, United States
Synopsis
We investigated the cerebellar microstructure and wiring diagram in a mouse model of Down syndrome (DS), using HARDI-based tractography analysis. Our results showed an absence of cerebellar climbing fibers (CF) and/or mossy fibers (MF) in the intra-granule layer of the DS mice at neonatal stage, when those fiber tracts started to form in the control neonatal brains. In the adult mice, two groups of crossing fibers—the CF/MF fibers versus the parallel fibers (PF) were identified, but the number of crossing fibers and apparent fiber density was significantly reduced in the granule layer of the DS mice, especially for the CF/MF group.
Introduction
Recent advances in high-angular resolution diffusion MRI (HARDI)1, 2 allow us to visualize and quantify complex microstructures, e.g., crossing fibers in the brain. Here, we employed HARDI-based tractography analysis in a well-established mouse model of Down syndrome (DS) —the Ts65Dn trisomic mice3, 4, in comparison with wild-type (Euploid) mice. Previous studies have identified reduced cerebellar volume, and reduced number of both granule cells and Purkinje neurons as hallmarks of DS4, 5. However, axonal microstructures, such as the organization of climbing fiber (CF), mossy fiber (MF), and parallel fiber (PF) is not well characterized in the DS brain. In this study, we investigated the cerebellar fiber profiles in the DS mice from neonatal to adult stages.Methods
Data acquisition: Ex vivo MRI of TsDn65 and Euploid mouse brains at postnatal day 6 (P6) and P31 (n=4 per group per time-point) was performed on an 11.7 T Bruker spectrometer with a 15 mm volume transceiver coil. HARDI data were acquired using a 3D diffusion-weighted gradient spin echo (DW-GRASE) sequence6. Imaging parameters are: resolution= 80 µm isotropic for P6 mice and 100 µm isotropic for P31 mice, TE/TR = 36/700 ms, 2 signal averages, δ/Δ=4/12 ms, 30 diffusion directions, and b-value=2000 s/mm2 for P6 mice and 2800 s/mm2 for P31 mice.
Data analysis: Reconstruction of the HARDI data were performed using constraint spherical deconvolution7 using MRtrix3 to obtain the fiber orientation density (FOD), based on which the number of crossing fibers and apparent fiber density (AFD)8 were derived. Fixel-based analysis9 was performed to evaluate the AFD of individual fiber groups. Probabilistic streamlines were generated with a fiber length between 0.2-0.7mm to obtain super-resolution track-density images (TDI)10. Cerebellar ROIs on the granular layer (GL), molecular layer (ML) and white matter (WM) of P31 mice, and intra- and extra-granule layers (IGL and EGL) and WM of the P6 mice, were manually delineated on 10 sagittal slides across the midline.
Results
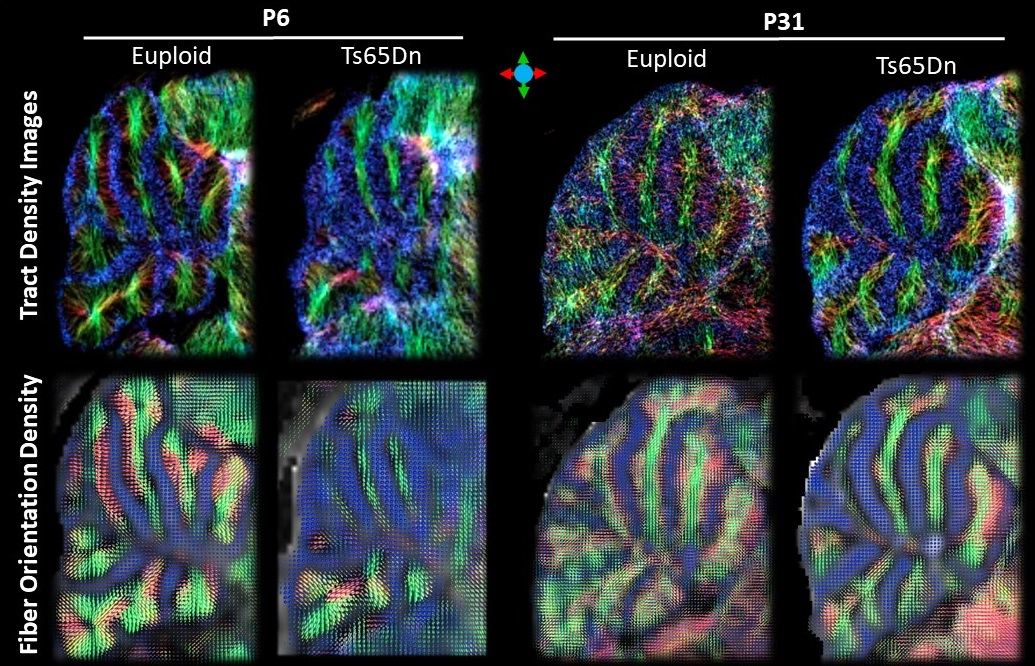
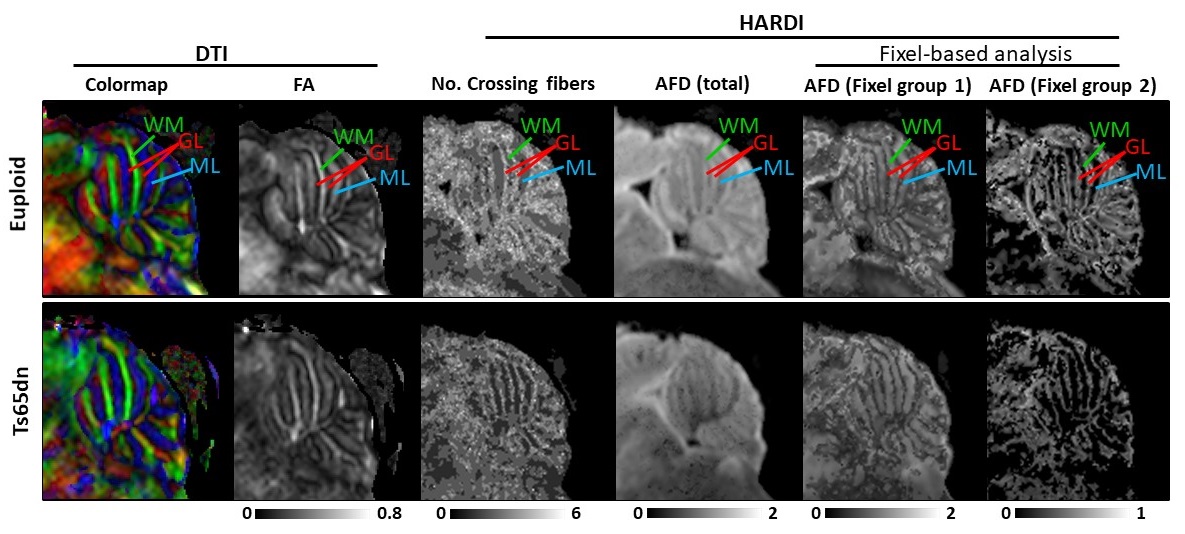
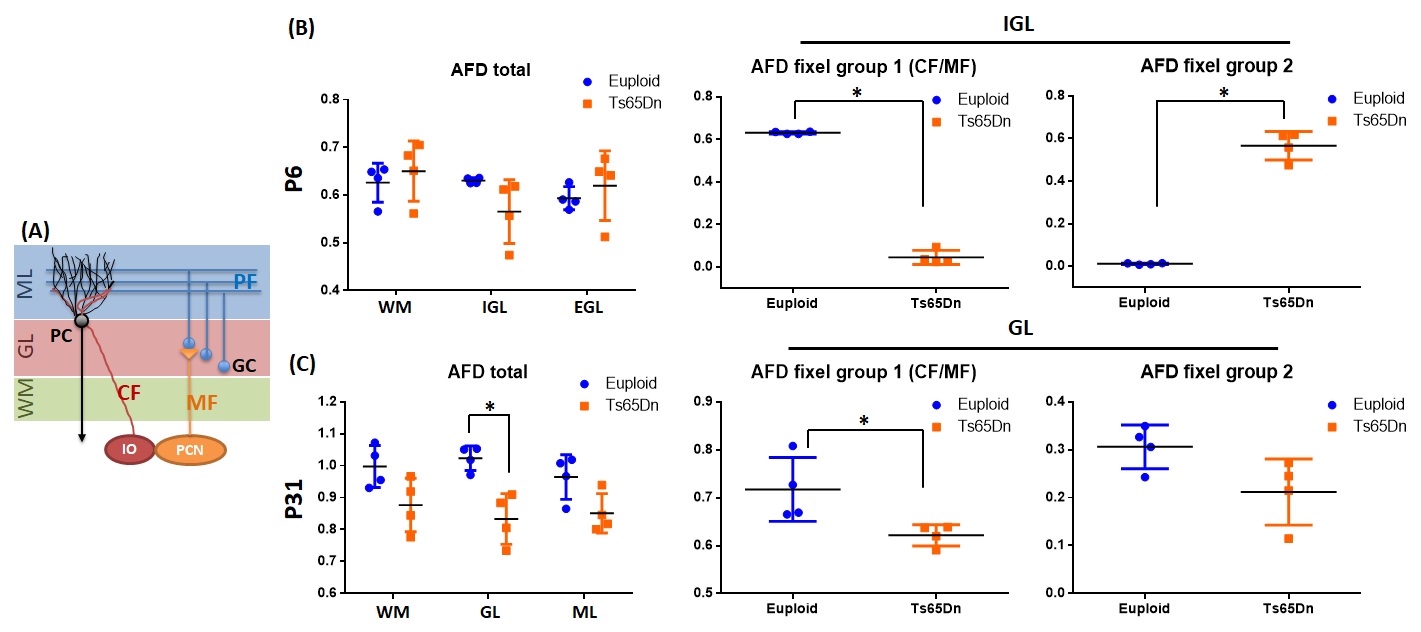
Sagittal TDI maps and FOD maps demonstrated distinct differences in the cerebellum of the Euploid and Ts65Dn mice at P6 and P31 (Fig. 1). At P6, a group of fiber tracts running perpendicularly to the cerebellar WM tracts can be identified in IGL of Euploid mice, which may correspond to the ascending climbing fibers (CF) and/or mossing fibers (MF). However, this fiber group was absent in IGL of the Ts65Dn mice. At P31, two groups of crossing fibers were identified in GL and ML of the cerebellum, including the CF/MF (perpendicular to WM tracts) and parallel fiber (PF, along left-right hemisphere), in both the Euploid and Ts65Dn mice, but the fiber group proportions appeared different. Interesting contrasts were observed in the parametric maps of P31 cerebellum (Fig. 2), e.g., GL had lower FA values, but higher number of crossing fibers and higher total AFD compared to ML or WM tracts, and these measurements were lower in GL of the Ts65Dn mice compared to the Euploid (Fig. 3). Furthermore, using fixel analysis, we were able to separate the crossing fibers in GL to a dominant fiber component (CF/MF) and a secondary component (PF). AFD of the CF/MF component in GL was lower in the Ts65Dn mice compared to Euploid, whereas no statistical difference was found in AFD of the PF component (Fig.3). Volumetric analysis showed a 23% reduction in the cerebellar volume fraction in Ts65Dn mice at P6, but no significant volume difference was found at P31.Discussion and Conclusion
DS is the most common genetic cause of intellectual disability11. While volumetric and cellular aspects of DS have been extensively studied, abnormality in the cerebellar fibers is not yet well understood. The cerebellar circuitry primarily involves the ascending CF, MF, PF, and the descending fibers (schematics in Fig. 3A). HARDI-based tractography analysis is ideal to dissect this complex wiring diagram. Our results pointed the absence of CF/MF in the DS mice at neonatal stage, and a lower proportion of CF/MF in cerebellar GL at adulthood. These findings indicated a delayed generation of the ascending fiber groups, which had a long term impact later on, although volumetric analysis no longer told the difference at adulthood. Immunohistological investigation is undergoing to determine whether the ascending fiber deficit lies in CF or MF or both. There are several limitations with the current study. We are not able to separate CF and MF groups as they both join the inferior cerebral peduncle before entering the cerebellum. Besides the fiber groups, geometric packing of the cerebellar cells may also affect the FOD results.Acknowledgements
This work is supported by NIH grant R21NS098018, R01HD036384 and the Lumind-RDS Foundation.References
1. Tuch DS, Reese TG, Wiegell MR and Wedeen VJ. Diffusion MRI of complex neural architecture. Neuron. 2003; 40: 885-95.
2. Aggarwal M, Gobius I, Richards LJ and Mori S. Diffusion MR Microscopy of Cortical Development in the Mouse Embryo. Cereb Cortex. 2015; 25: 1970-80.
3. Reeves RH, Irving NG, Moran TH, et al. A mouse model for Down syndrome exhibits learning and behaviour deficits. Nature genetics. 1995; 11: 177-84.
4. Baxter LL, Moran TH, Richtsmeier JT, Troncoso J and Reeves RH. Discovery and genetic localization of Down syndrome cerebellar phenotypes using the Ts65Dn mouse. Human molecular genetics. 2000; 9: 195-202.
5. Olson LE, Roper RJ, Baxter LL, Carlson EJ, Epstein CJ and Reeves RH. Down syndrome mouse models Ts65Dn, Ts1Cje, and Ms1Cje/Ts65Dn exhibit variable severity of cerebellar phenotypes. Developmental dynamics : an official publication of the American Association of Anatomists. 2004; 230: 581-9.
6. Wu D, Xu J, McMahon MT, et al. In vivo high-resolution diffusion tensor imaging of the mouse brain. Neuroimage. 2013; 83: 18-26.
7. Tournier JD, Calamante F and Connelly A. Robust determination of the fibre orientation distribution in diffusion MRI: non-negativity constrained super-resolved spherical deconvolution. Neuroimage. 2007; 35: 1459-72.
8. Raffelt D, Tournier JD, Rose S, et al. Apparent Fibre Density: A novel measure for the analysis of diffusion-weighted magnetic resonance images. NeuroImage. 2012; 59: 3976-94.
9. Raffelt DA, Smith RE, Ridgway GR, et al. Connectivity-based fixel enhancement: Whole-brain statistical analysis of diffusion MRI measures in the presence of crossing fibres. NeuroImage. 2015; 117: 40-55.
10. Calamante F, Tournier JD, Kurniawan ND, et al. Super-resolution track-density imaging studies of mouse brain: Comparison to histology. NeuroImage. 2012; 59: 286-96.
11. Epstein CJ. The Consequences of Chromosome Imbalance: Principles, Mechanisms, and Models. Cambridge, UK: Cambridge University Press, 1986.
Figures