5370
Investigating the spatial pattern of structural changes of the Optic Radiation in early blind individuals.1CIMeC - Center for Mind/Brain Sciences, University of Trento, Rovereto (TN), Italy, 2Institute of Psychology (IPSY) and of Neurosciences (IoNS), University of Louvain-la-Neuve, Louvain-la-Neuve, Belgium
Synopsis
The study of sensory deprived individuals shows the capability of the brain to massively reorganize. Previous studies show that the optic tract of early blind individuals undergoes structural changes, but little is known about their spatial distribution. We investigated the spatial profile of the structural changes occurring along tractography reconstruction from diffusion MRI data of the optic radiations in early blind individuals compared to age- and gender-matched healthy sighted controls.
Introduction
Early blindness (EB) affects the optic radiation (OR), the component of the visual pathway conveying signals from the lateral geniculate nucleus (LGN) of the thalamus to the occipital cortex. Previous diffusion MRI studies1,2 showed that the OR of EB individuals presents lower fractional anisotropy (FA) values compared to matched sighted controls. However, these studies either (i) averaged FA along the OR tract, or (ii) considered voxel-based analyses. As a result, the spatial distribution of FA changes along the OR in EB remains not well characterized. Here we investigate whether the FA profile along the OR is affected by blindness relative to sighted controls. The possible detection of localised patterns of changes might provide new insights into the mechanisms of plasticity in sensory-deprived individuals.Methods
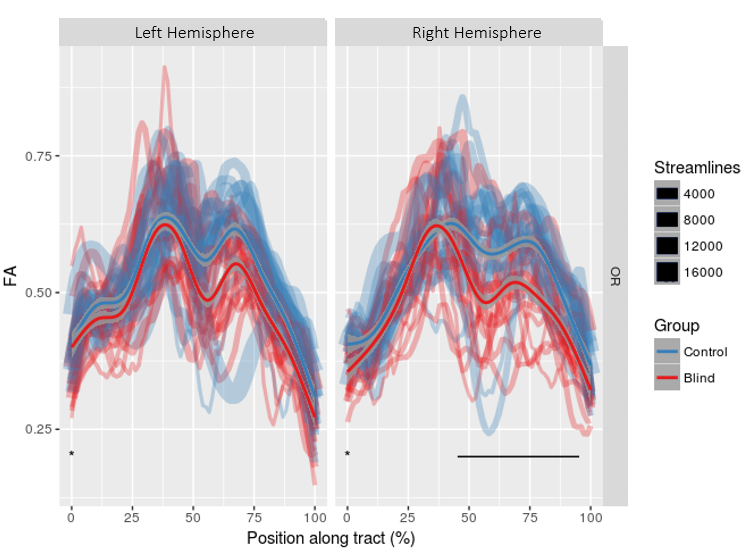
A group of 16 early-blind subjects (8 males, mean age 33.9, onset ≤ 3 years old) was investigated in comparison with a gender- and age-matched group of healthy sighted controls. A 4T Bruker Medspec MRI scanner was used to acquire diffusion (2.3mm isotropic voxel, 60 DW and 10 b0 volumes, b = 1500s/mm2 , TE = 99ms) and T1 anatomical (MPRAGE, 1 mm isotropic) data. Diffusion data were corrected for eddy currents and head motion (FSL) followed by bias field correction and global intensity normalization in MrTrix33. Diffusion profiles (FODs) were estimated on upsampled DWI data from the group-specific average response function. Anatomically-constrained probabilistic tractography (ACT)4 was performed at following parameters: 0.5 mm step size, 45° maximum angle threshold, 1000 seeds/voxel. Tracking was randomly initiated from each voxel in the LGN and the primary visual cortex (V1) was used as target. The LGN was extracted from the Juelich atlas (threshold=25%), inflated (2mm) to account for inter-subject variability, and non-linearly registered to the subject’s diffusion space in FSL(FNIRT). V1 was automatically parcellated in Freesurfer(v5.3.0). Parcellations were visually inspected and, manually edited by an expert operator (author H.T.). Resulting tractograms were then filtered and transformed into TrackVis file format using nipype. The Along-Tract-Statistic Toolkit5 was used to estimate FA at multiple locations along the tract length: each tract streamlines were reoriented to a common origin and re-parameterized with cubic B-splines, resampled to new vertices in such a way that each streamline’s point closest to the midpoint vertex of the calculated mean tract streamline was identified, and each half of each streamline’s restant vertices fell respectively on their side of the midpoint vertex. The number of new vertices was calculated by dividing the length of each tract mean streamline by the voxel resolution, and then averaging it across subjects. Each subject’s FA map was then sampled at these new vertices and FA values were collapsed across streamlines at each group of correspondent vertices in order to get mean (M) and standard deviation (SD) FA estimates along the length of the tract. FA was also extracted by collapsing each individual’s along-tract FA values to compare Hedges’s g in this condition with Hedges’s g for each vertex showing significant FA differences between groups.Results
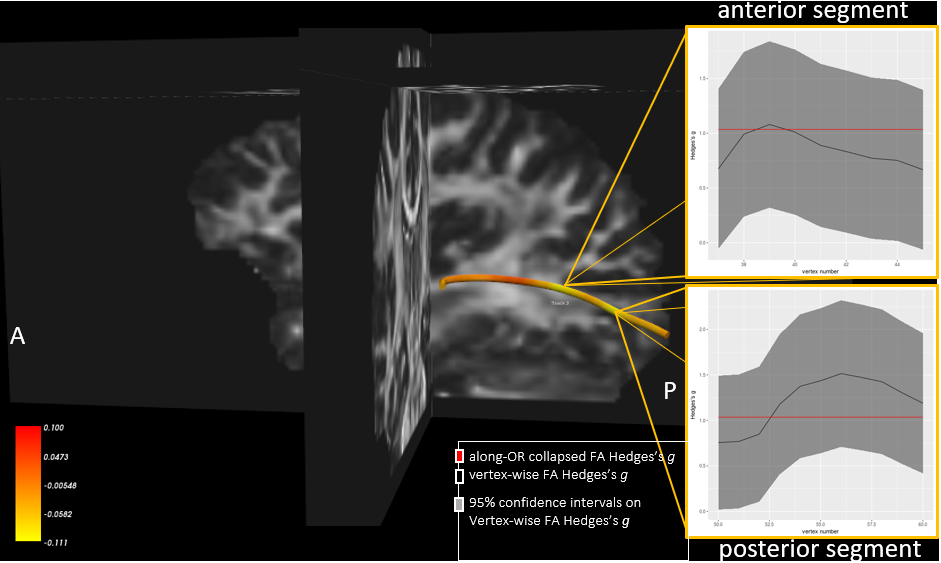
For both hemispheres, significant effects of group (left: p=0.004, right: p=0.005) and vertex (left: p<0.001, right: p<0.001) were observed across all the tract length. Significant interactions of vertex and group were found for the right hemisphere (p<0.001, figure 1). Post-hoc t-tests show that verteces presenting significant group interactions (p<0.05, corr.) are segregated in two distinct segments along the tract course, and that they are localized respectively in the postero-central and posterior regions of the OR (figure 2, 3).Discussion and Conclusion
These results confirm previous findings for decreased FA values within the OR of early-blind people, and shed new light on the spatial pattern characterizing such changes. Interestingly, FA changes appear to mainly affect two distinct segments of the tract course, and this might point to the occurrence of focal patterns of white matter reorganization occurring in specific tract positions. The localization of such phenomenon might provide new understandings of mechanisms of plasticity in sensory-deprived individuals, and might represent new valuable opportunities in the assessment of suitability of sight restoration.Acknowledgements
We acknowledge Maxime Descoteaux and the SCIL for sharing the code.References
1. Shimony JS, Burton H, Epstein AA, et al. Diffusion Tensor Imaging Reveals White Matter Reorganization in Early Blind Humans. Cerebral Cortex. 2006 Nov;16(11):1653-61
2. Wang D, Qin W, Liu Y, et al. Altered resting-state network connectivity in congenital blind. Hum. Brain Mapp. 2005;35:2573–2581
3. Tournier JD, Calamante F, and Connelly A. MRtrix: Diffusion tractography in crossing fiber regions. Int. J. Imaging Syst. Technol. 2012;22(1),53-66
4. Smith RE, Tournier JD, Calamante F, and Connelly A. Anatomically-constrained tractography: Improved diffusion MRI streamlines tractography through effective use of anatomical information. Neuroimage. 2012;62(3),1924-1938
5. Colby JB, Soderberg L, Lebel C, et al. Along-tract statistics allow for enhanced tractography analysis. Neuroimage. 2012;59(4):3227-42.
Figures