5366
Bayesian estimation applied to stretched exponential modelling of diffusion-weighted imaging data1Department of Radiology and Nuclear Medicine, St. Olav's University Hospital, Trondheim, Norway
Synopsis
The stretched exponential model provides a means of assessing non-monoexponential signal attenuation in diffusion-weighted imaging data. However, standard least squares approaches to parameter estimation remain susceptible to noise. In this work, we apply two distinct Bayesian approaches to stretched exponential modelling, and assess their performance at low-medium b-values using simulations. The use of a spatial homogeneity prior is found to yield parameter maps with higher precision and accuracy than those obtained with the use of a Gaussian shrinkage prior or nonlinear least squares.
Purpose
A major goal in diffusion-weighted imaging (DWI) is to provide pixelwise parameter maps that characterize the deviation from monoexponential signal attenuation. The stretched exponential model [1] has been proposed for this purpose, while also representing a robust alternative to the intravoxel incoherent motion (IVIM) model [2] at lower b-values. Bayesian modelling has been shown to improve the accuracy of IVIM parameter estimation [3]. In this work, we adapt two distinct Bayesian approaches [4,5] for use in stretched exponential modelling, and we use simulations to assess their performance at low-medium b-values in comparison to nonlinear least squares.Methods
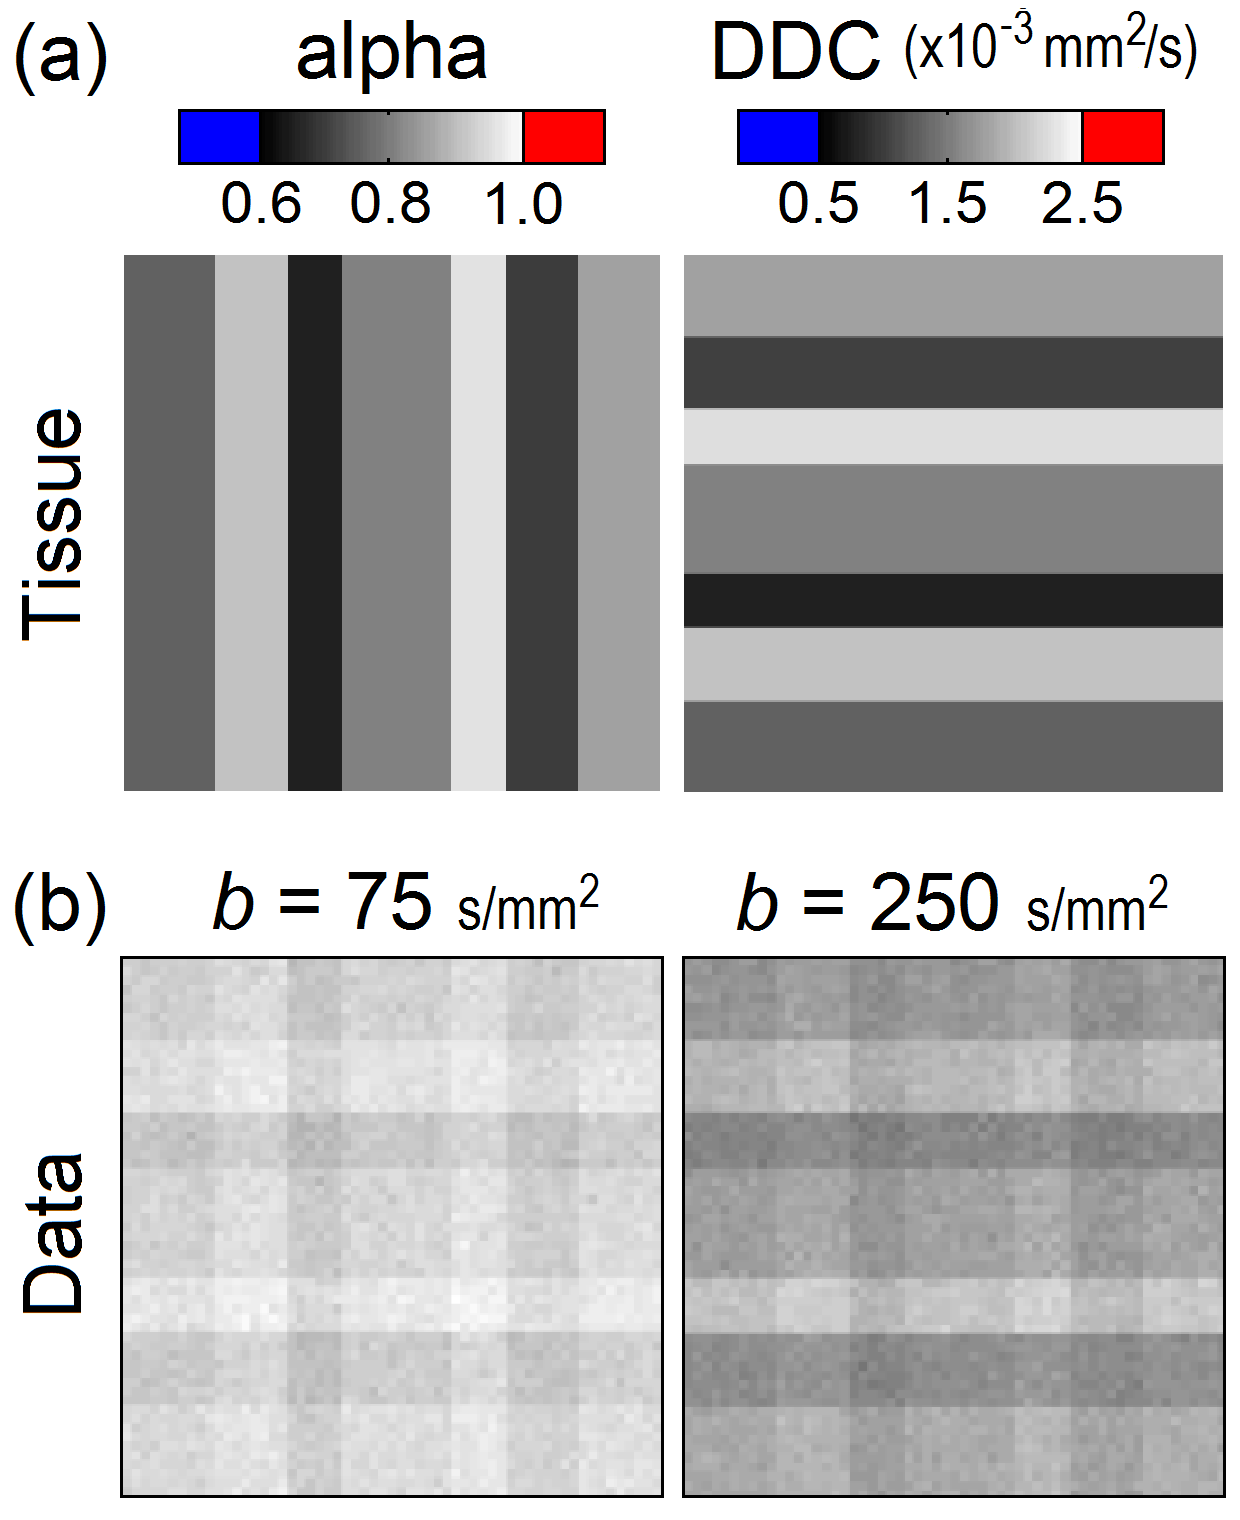
The stretched exponential model describes the normalized signal attenuation in DWI as $$$S_b/S_0=e^{-(b\tt{DDC})^\alpha}$$$, where Sb is the signal at the given b-value, DDC is the distributed diffusion coefficient, and α (alpha) represents the degree to which the signal attenuation is non-monoexponential (0 < α < 1). Tissue was simulated in the context of this model by specifying a map (60x60) for each parameter (see Fig. 1). Each map was comprised of seven subregions, each containing a fixed parameter value. The orientation of the subregions was such that 49 different combinations of parameters were considered. The specified parameter values were guided by experimental studies on breast DWI [6,7]: α = 0.65 - 0.95; DDC = 0.75 - 2.25 (x 10-3 mm2/s). Data were simulated at eight b-values (0 - 900 s/mm2) and corrupted by three levels of noise (SNR = 80, 50, 20 w.r.t. b0 image; Rician).
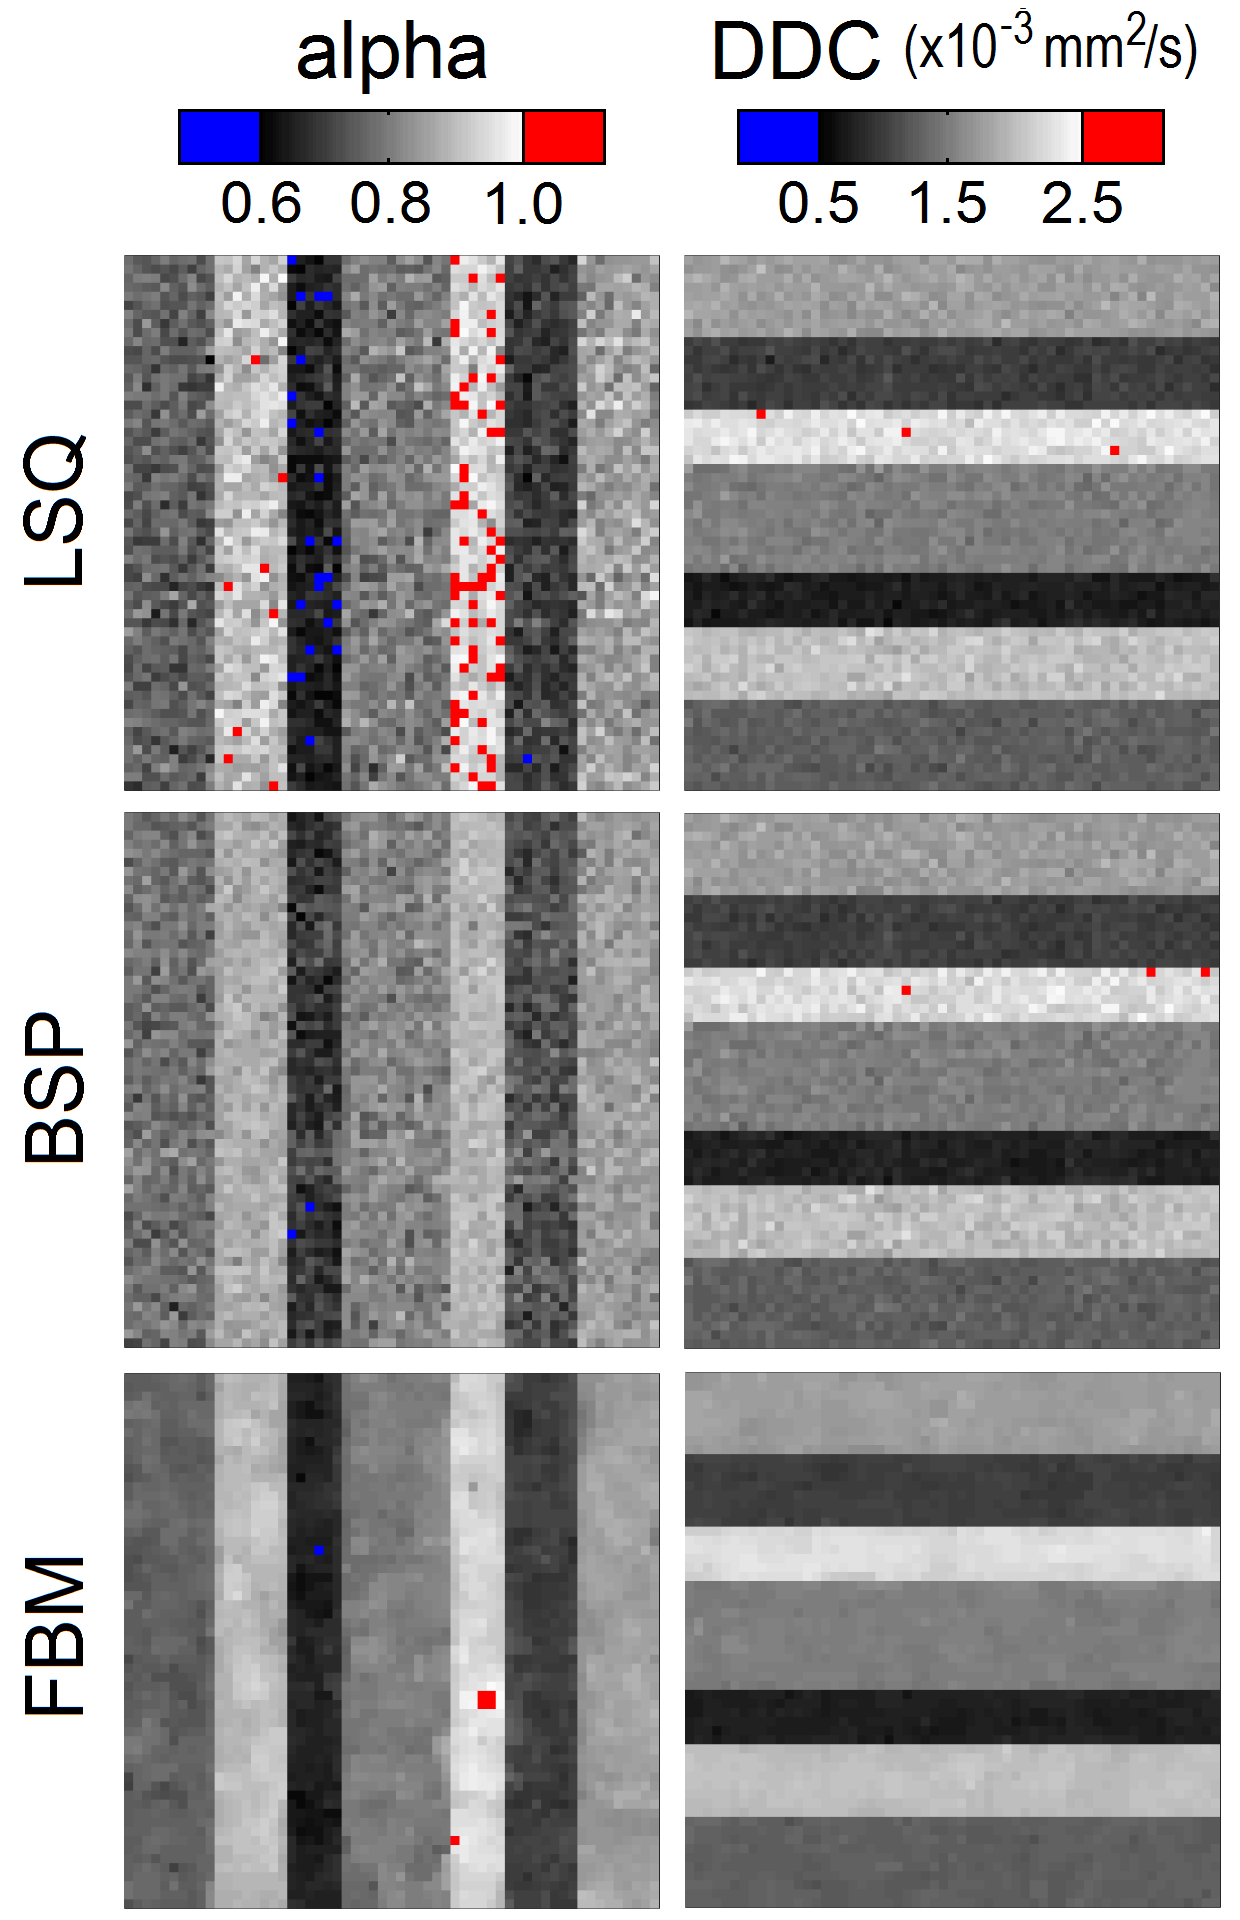
Parameter maps were generated for each data set using three approaches:
- LSQ - Standard nonlinear least squares as a reference (trust-region-reflective algorithm).
- BSP - Bayesian estimation using a Gaussian “shrinkage” prior [4], which assumes that each parameter is approximately Gaussian distributed (Markov chain Monte Carlo implementation).
- FBM - Bayesian estimation using a spatial-homogeneity “smoothing” prior [5], implemented using the fusion bootstrap moves approach based on minimum graph cuts.
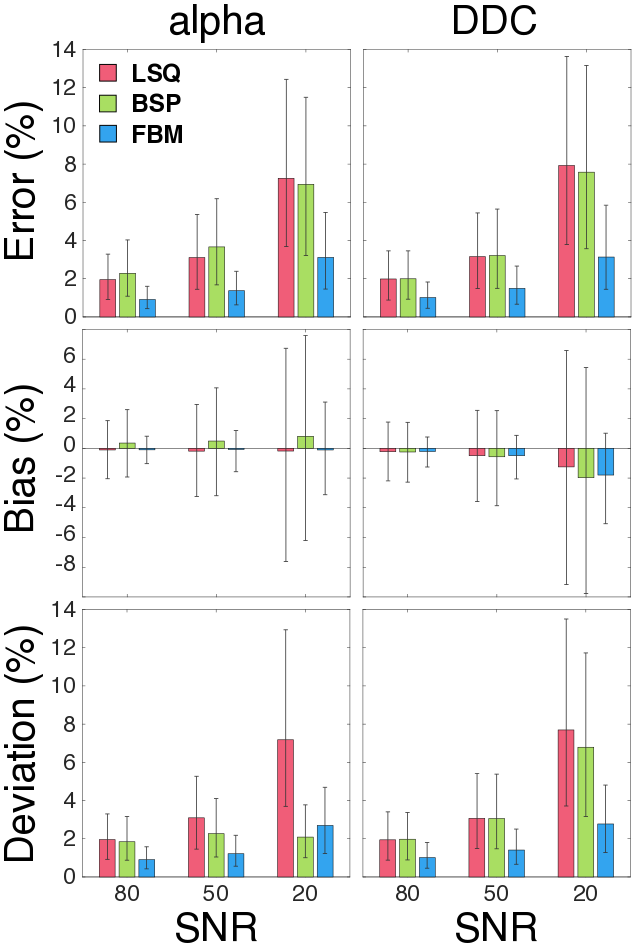
The accuracy, bias and precision of the estimators were assessed using the median absolute percentage error (MdAPE), median percentage bias (MdPB) and median absolute percentage deviation (MdAPD), respectively [3]. All analysis was performed using MATLAB (Mathworks).
Results and Discussion
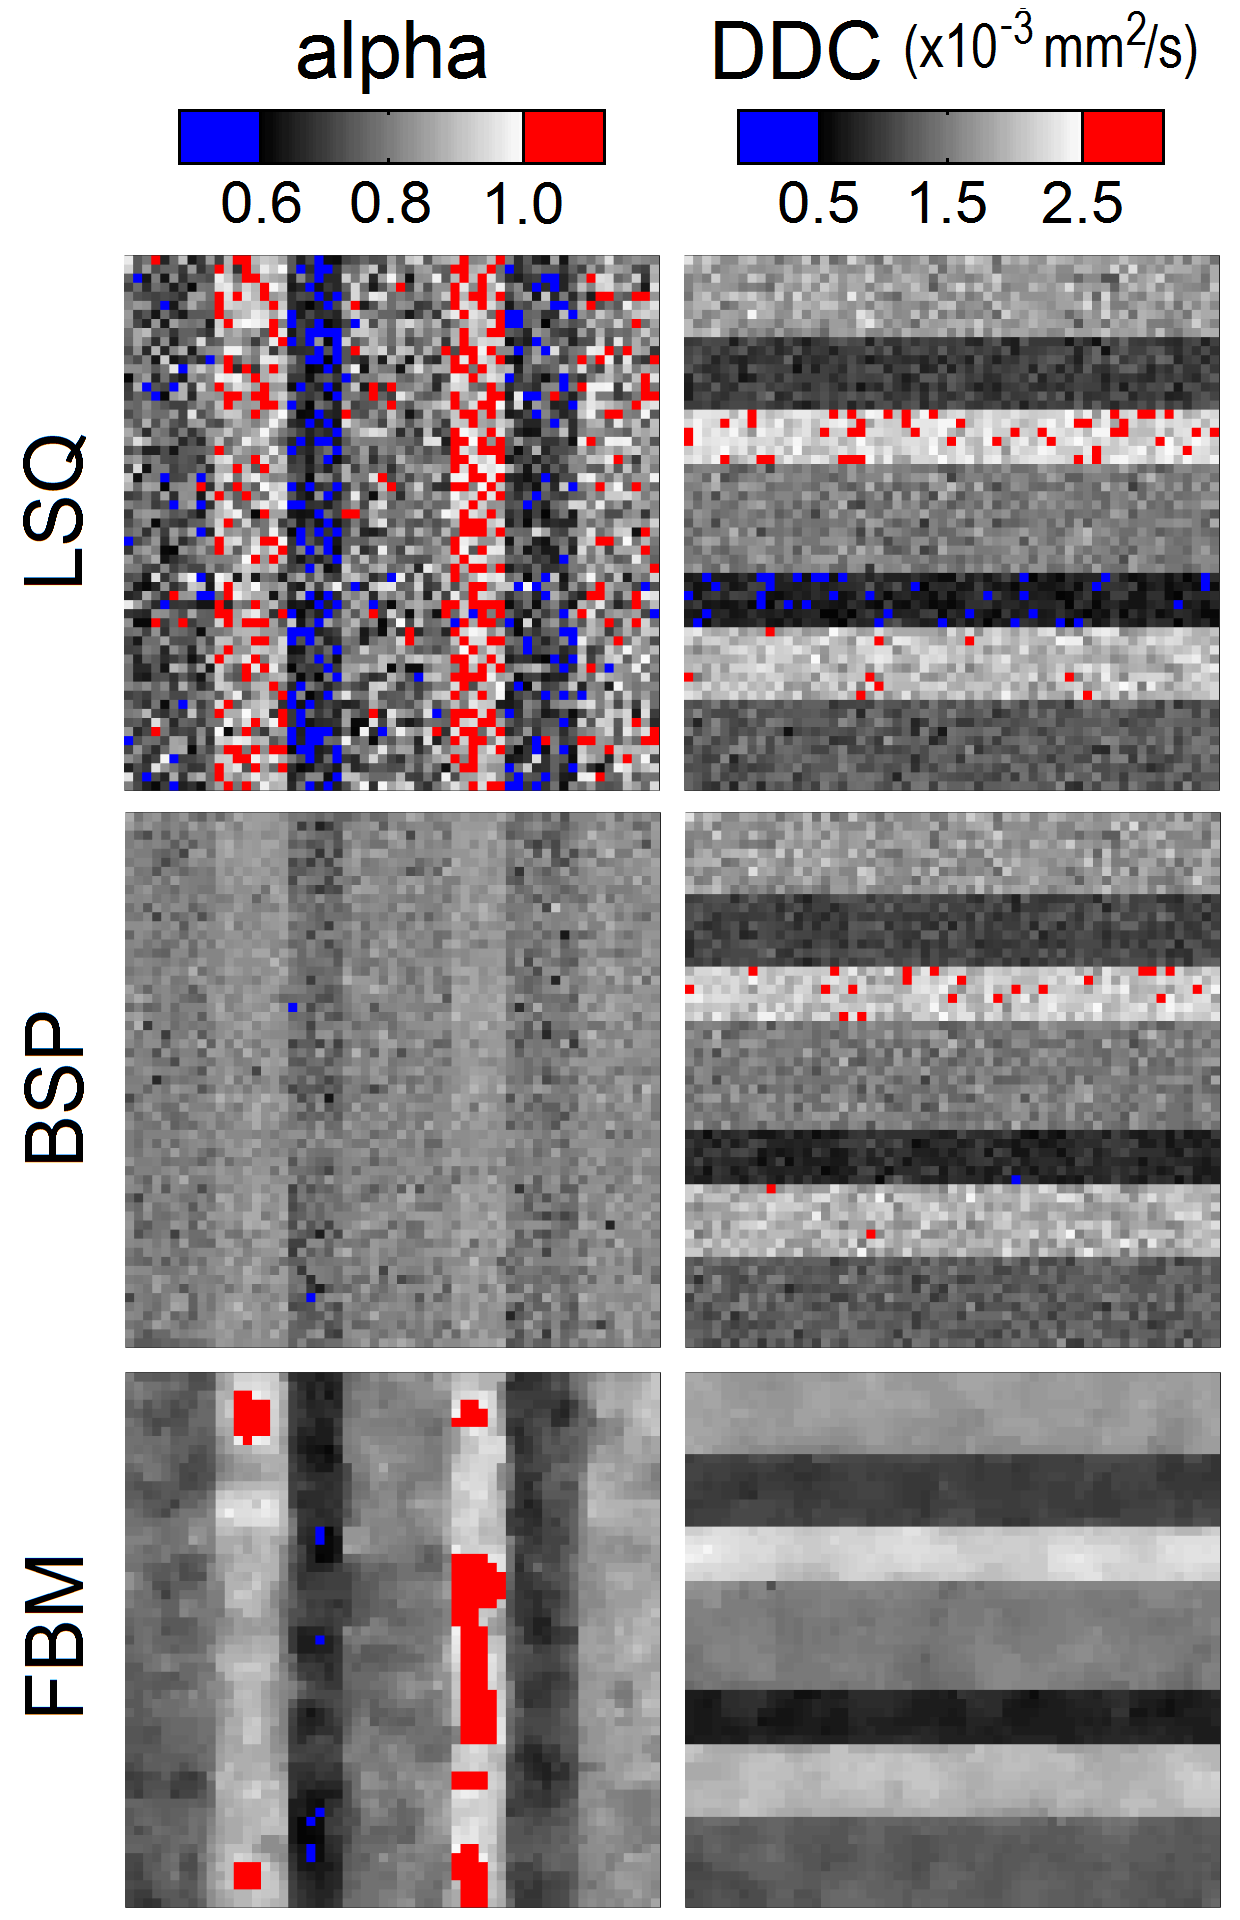
The three estimators produced maps with distinct qualitative differences (see Figs. 2 and 3), especially for parameter alpha at lower SNR. The LSQ map in Fig. 3 displays a speckled appearance, which indicates considerable uncertainty in the estimates. The corresponding BSP map is cleaner, but the estimates have been shrunk substantially towards the mean such that the individual subregions have become somewhat obscured. Previous work on IVIM modelling has already exposed this possible weakness of the BSP approach in masking tissue features [3]. In contrast, the clustered variability associated with the FBM approach results in clean maps with relatively clear delineation between subregions. The statistical metrics displayed in Fig. 4 provide further support for FBM, which exhibits significantly lower error, bias and deviation in nearly all of the cases considered (Mann-Whitney U test; Holm-Bonferroni correction). Note that BSP actually provides an inferior match to the specified parameters than LSQ in certain cases, in the pursuit of lower deviation. The degree of smoothing in FBM can be controlled using a single weighting parameter, and should be tailored according to the SNR. Fig. 4 also confirms that stretched exponential modelling is far less susceptible to noise than IVIM modelling (cf. [3]).Conclusion
Bayesian estimation using a spatial homogeneity prior produces stretched exponential parameter maps with considerably higher precision and accuracy than those produced using a Gaussian shrinkage prior or nonlinear least squares fitting. This approach has strong potential for providing reliable pixelwise parameter maps for the assessment of non-monoexponential signal attenuation in DWI.Acknowledgements
No acknowledgement found.References
- Bennett KM, Schmainda KM, Bennett (Tong) R, Rowe DB, Lu H, Hyde JS (2003) Characterization of continuously distributed cortical water diffusion rates with a stretched-exponential model. Magn Reson Med 50:727-734
- Le Bihan D, Breton E, Lallemand D, Aubin ML, Vignaud J, Laval-Jeantet M (1988) Separation of diffusion and perfusion in intravoxel incoherent motion MR imaging. Radiology 168:497-505
- While PT (2017) A comparative simulation study of Bayesian fitting approaches to intravoxel incoherent motion modeling in diffusion-weighted MRI. Magn Reson Med (Early View). doi: 10.1002/mrm.26598
- Orton MR, Collins DJ, Koh DM, Leach MO (2014) Improved intravoxel incoherent motion analysis of diffusion weighted imaging by data driven Bayesian modeling. Magn Reson Med 71:411-420
- Freiman M, Perez-Rossello JM, Callahan MJ, Voss SD, Ecklund K, Mulkern RV, Warfield SK (2013) Reliable estimation of incoherent motion parametric maps from diffusion-weighted MRI using fusion bootstrap moves. Med Image Anal 17(3):325-336
- Ertas G, Onaygil C, Akin Y, Kaya H, Aribal E (2016) Quantitative differentiation of breast lesions at 3T diffusion-weighted imaging (DWI) using the ratio of distributed diffusion coefficient (DDC). J Magn Reson Imaging 44(6):1633-1641
- Bedair R, Priest AN, Patterson AJ, McLean MA, Graves MJ, Manavaki R, Gill AB, Abeyakoon O, Griffiths JR, Gilbert FJ (2017) Assessment of early treatment response to neoadjuvant chemotherapy in breast cancer using non-mono-exponential diffusion models: A feasibility study comparing the baseline and mid-treatment MRI examinations. Eur Radiol 27(7):2726-2736
Figures