5365
Can Apparent Diffusion Coefficient from Ultra-high b-Values be Used to Assess Renal Function with Murine Model of Unilateral Ureteral Obstruction?1Tongji Hospital, Tongji Medical College, Huazhong University of Science and Technology, Wuhan, China
Synopsis
To evaluate the utility of apparent diffusion coefficient (ADC) data obtained from ultra-high b-values in renal function using with rat model of unilateral ureteral obstruction (UUO). We compared the differences of ADCuh among time points and between the sides, and determined the correlation of ADCuh with positron emission tomography (PET) renal function and expression of aquaporin 2 (AQP-2). ADCuh of the UUO sides on day 0 was significantly lower than that of on day 1, 3, 5 and 7. ADCuh was negatively correlated with SUV both on the UUO side and contralateral side. Therefore, ADCuh may have a certain value to help evaluate renal function.
Purpose
To evaluate renal function using a rat model of unilateral ureteral obstruction (UUO) based on apparent diffusion coefficient (ADC) data obtained from ultra-high b-values.Materials and Methods
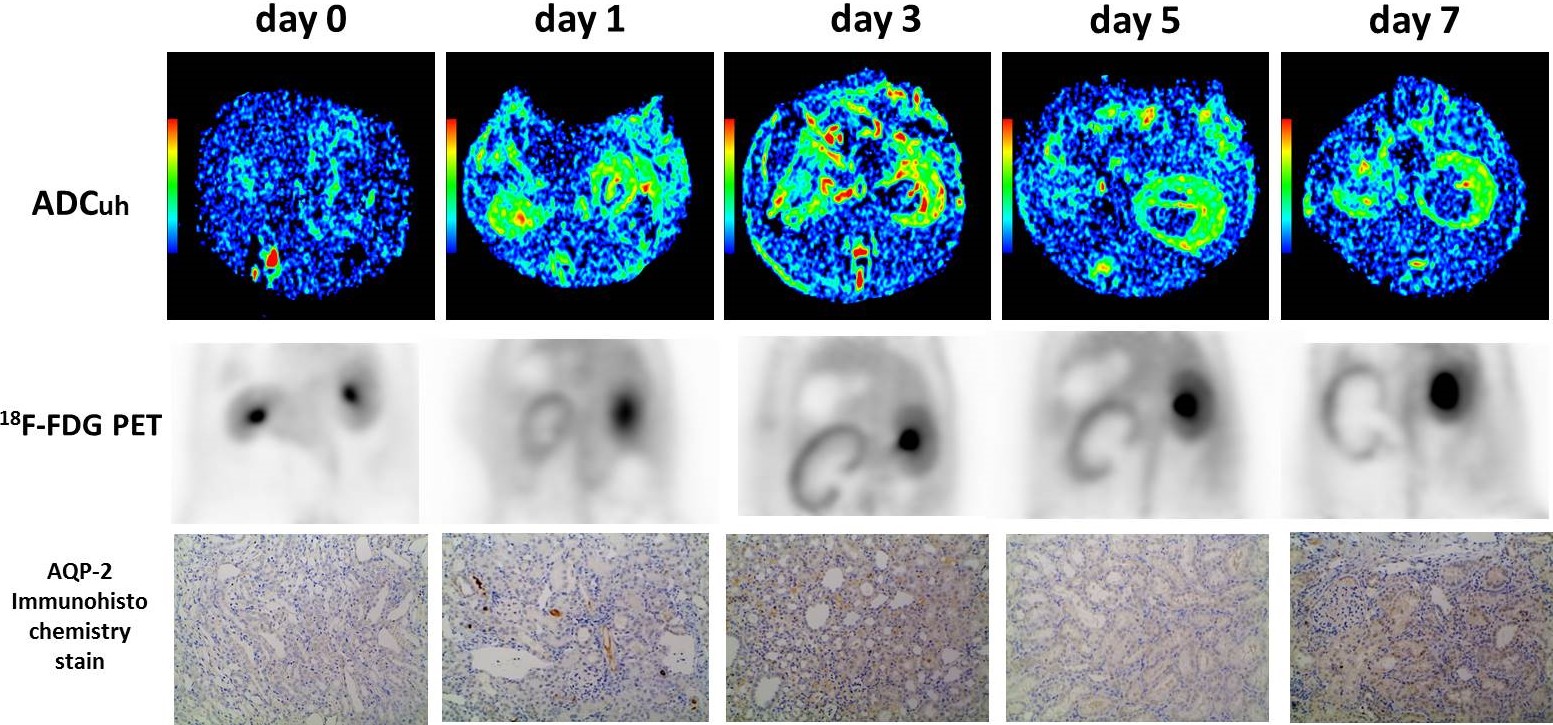
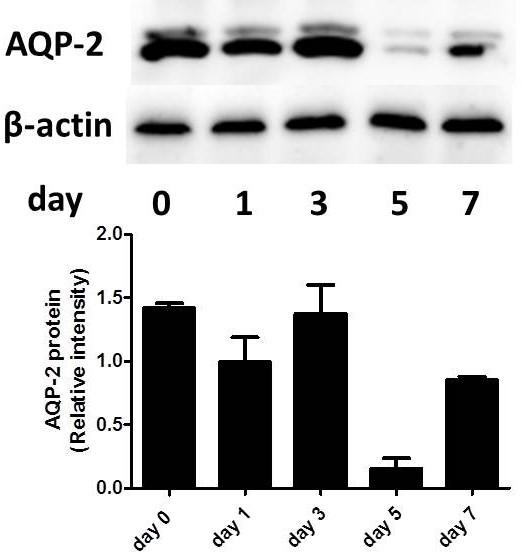
This study included 44 rats (Sprague-Dawley), 8 of them did not do any treatment as a normal control group (day 0) and other 36 UUO rats were created by complete ligation of the left ureter. Diffusion-weighted imaging (DWI) with 18 b values (0-4,500 sec/mm2) was conducted on a 3.0T MRI scanner (Discovery 750, GE Medical System, Milwaukee, WI) without UUO, at day 1, 3, 5 and 7 after UUO. Ultra-high ADC (ADCuh) was quantified by fitting the signals at ultra-high b-values (1,700–4,500 s/mm2) to the mono-exponential equation. Then followed by 18F-fluorodeoxyglucose (FDG) positron emission tomography (PET) using the Trans-PET BioCaliburn 700 system (Raycan Technology Co., Ltd, Suzhou, China) to estimate renal function and histological analysis to examine aquaporin 2 (AQP-2) expression. We compared the differences of ADCuh among the rats at different time points, and the correlations with standardized uptake value (SUV) and expression of AQP-2.Results
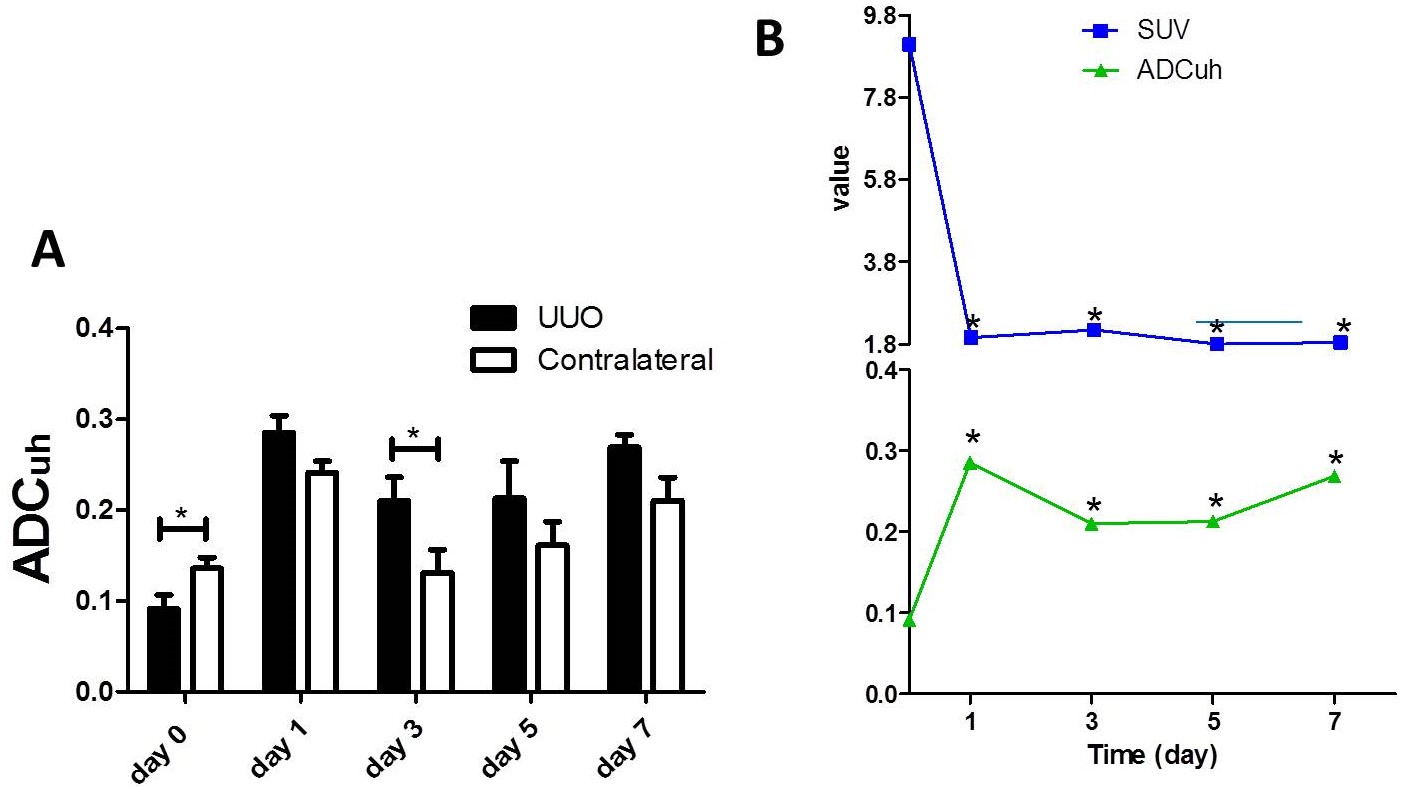
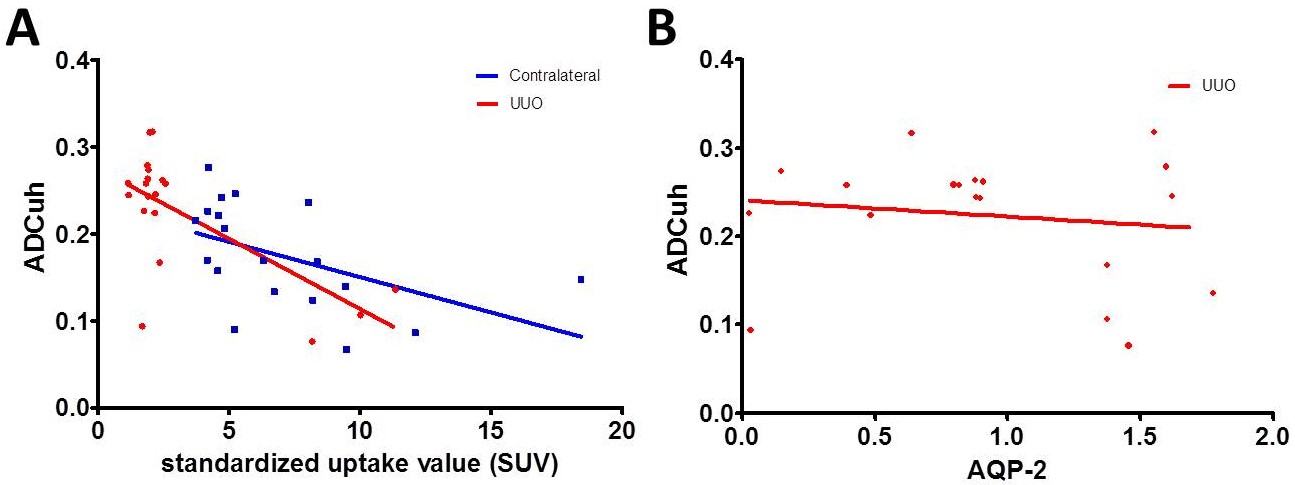
ADCuh on day 0 were significantly different between the UUO side and contralateral side. ADCuh of the UUO side was significantly higher than contralateral side on day 3. ADCuh of the UUO sides on day 0 was significantly lower than that of on day 1, 3, 5 and 7 (P = 0.001, P = 0.017, P = 0.018, P = 0.001, respectively). ADCuh of the contralateral sides on day 0 was significantly lower than that of on day 1 (P = 0.025). ADCuh was negatively correlated with SUV both on the UUO side and contralateral side (UUO: r = −0.677, P = 0.001; contralateral: r = −0.491, P = 0.033), and positively correlated with AQP-2 expression (r = −0.142, P = 0.561).Conclusions
Apparent diffusion coefficient from ultra-high b-values shows moderate correlations with SUV, which imply that ADCuh has the potential to serve as a sensitive noninvasive biomarker of renal function. Whereas our data suggest that in vivo ADCuh is unlikely to be a direct measure of renal AQP-2 expression.Acknowledgements
No acknowledgement found.References
1. Togao O, Doi S, Kuro-o M, Masaki T, Yorioka N, Takahashi M. Assessment of renal fibrosis with diffusion-weighted MR imaging: study with murine model of unilateral ureteral obstruction. Radiology 2010;255:772-80.
2. Cai XR, Yu J, Zhou QC, Du B, Feng YZ, Liu XL. Use of intravoxel incoherent motion MRI to assess renal fibrosis in a rat model of unilateral ureteral obstruction. J Magn Reson Imaging 2016;44:698-706.
3. Hennedige T, Koh TS, Hartono S, et al. Intravoxel incoherent imaging of renal fibrosis induced in a murine model of unilateral ureteral obstruction. Magn Reson Imaging 2015;33:1324-8.
Figures