5363
Non-Gaussian DWI of breast lesions at high b-values1Department of Physics, NTNU – Norwegian University of Science and Technology, Trondheim, Norway, 2Clinic of Radiology and Nuclear Medicine, St. Olavs University Hospital, Trondheim, Norway, 3Department of Circulation and Medical Imaging, NTNU – Norwegian University of Science and Technology, Trondheim, Norway, 4Department of Cancer Research and Molecular Medicine, NTNU – Norwegian University of Science and Technology, Trondheim, Norway, 5Department of Surgery, St. Olavs University Hospital, Trondheim, Norway, 6Department of Radiation Medicine and Applied Sciences, University of California, San Diego, La Jolla, CA, United States, 7Department of Radiology, University of California, San Diego, La Jolla, CA, United States, 8Center for Multimodal Imaging and Genetics, University of California, San Diego, La Jolla, CA, United States, 9Department of Neurosciences, University of California, San Diego, La Jolla, CA, United States
Synopsis
In this work, we fit multiple non-Gaussian models to high b-value DW-MRI (b= 200-3000 s/mm2) in benign and malignant breast lesions. Models included bi-exponential, stretched exponential, diffusion kurtosis, Padé exponent and ADC (for comparison). We evaluated the quality of fit for each model and investigated the lesion differentiation accuracy for all extracted model parameters. The bi-exponential model provided statistically significant better quality of fit than all the other models, and without systematic bias. This suggests the existence of two effective diffusion compartments in breast lesions. Several of the extracted model parameters performed equally well in terms of lesion differentiation (AUC>0.97).
Introduction
Diffusion-weighted imaging (DWI) at low-medium b-values (b<1000 s/mm2) and the corresponding apparent diffusion coefficient (ADC) has proved useful for differential diagnosis of breast lesions.1, 2 When higher b-values are included (>1000 s/mm2), the signal decay deviates from the monoexponential decay of Gaussian diffusion, which is a consequence of complex tissue microstructure and may give insight to tumor characteristics.3 Common non-Gaussian mathematical diffusion descriptions include the biexponential3, 4, stretched exponential5, and diffusion kurtosis models6. In addition, the Padé exponent model overcomes the convergence problem of cumulant expansion for higher b-values.7 The purpose of the current study was to investigate how well the different models fit the b-dependent signal decay in breast lesions, and the differentiation accuracy of benign and malignant for the parameters extracted from each model.Methods
Informed, consented patients with known breast pathology (N=18 benign, N=27 malignant) were included in this prospective study. DW-MRI (Siemens Skyra 3T, 16-channel breast coil) with a Stejskal-Tanner SE-EPI sequence was acquired with: TR/TE = 11800/88ms (N=23 patients) and TR/TE = 10600/88ms (N=20 patients), matrix 90x90, in-plane res: 2x2 mm; slice-thickness 2.5mm, 7 b-values: 0, 200, 600, 1200, 1800, 2400, 3000 s/mm2 in six different directions. Total DWI scan time was 13 minutes. One additional b0 volume was acquired with identical parameters but reversed phase encoding to enable distortion correction [8]. Finally, a geometry-matched clinical DCE-MRI sequence was acquired.
All DWI images were corrected for eddy current artefacts, motion, geometric distortion and noise. Only the largest lesion from each patient was included for analysis. The lesions were segmented by 3D ROIs outlined in the b600 trace image, visually guided by a post-contrast DCE image. Mean ROI signal from the trace image at each b-value was calculated and used for further analysis.
DWI models:
To avoid possible influence from perfusion, the b0 ROI signal was excluded from the model fitting. The following models were applied:
ADC: $$$S(b)=S(0)\cdot e^{(-b\cdot ADC)}$$$
Bi-exponential (BE)3: $$$S(b)=S(0)\cdot ((1-f_2)\cdot e^{-b\cdot D1}+f_2\cdot e^{-b\cdot D2})$$$
Stretched exponential (SE)7: $$$S(b)=S(0)\cdot e^{-(b\cdot DDC)^\alpha}$$$
Diffusion kurtosis (DKI)6: $$$S(b)=S(0)\cdot e^{-b\cdot D_k + \frac{1}{6}\cdot b^2\cdot D_k^2\cdot K}$$$
Padé exponent (PE)7: $$$S(b)=S(0)\cdot e^{-\frac{b\cdot D_Padé}{1+\delta \cdot b}}$$$
All preprocessing and analysis were performed in Matlab (MathWorks, Natick, USA). To compare fitting of the models, the Akaike information criterion (AIC) was calculated and compared using Kruskal-Wallis test, and Wilcoxon rank sum for pairwise comparison. Receiver operating characteristic (ROC) curves with area under the curve (AUC) were calculated for the differentiation between malignant and benign lesions.
Results
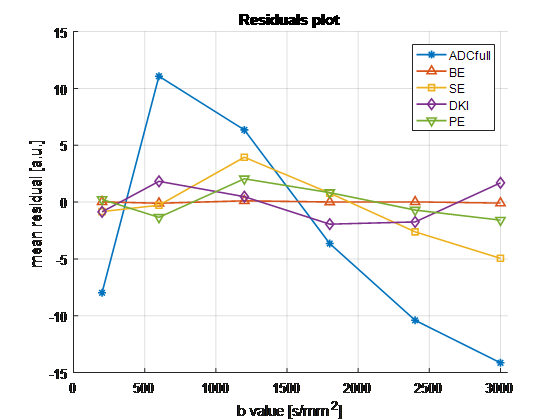
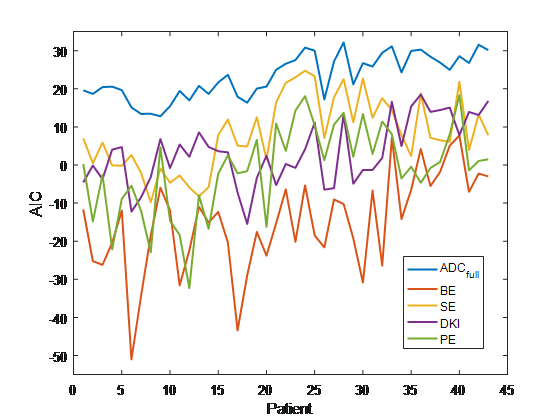
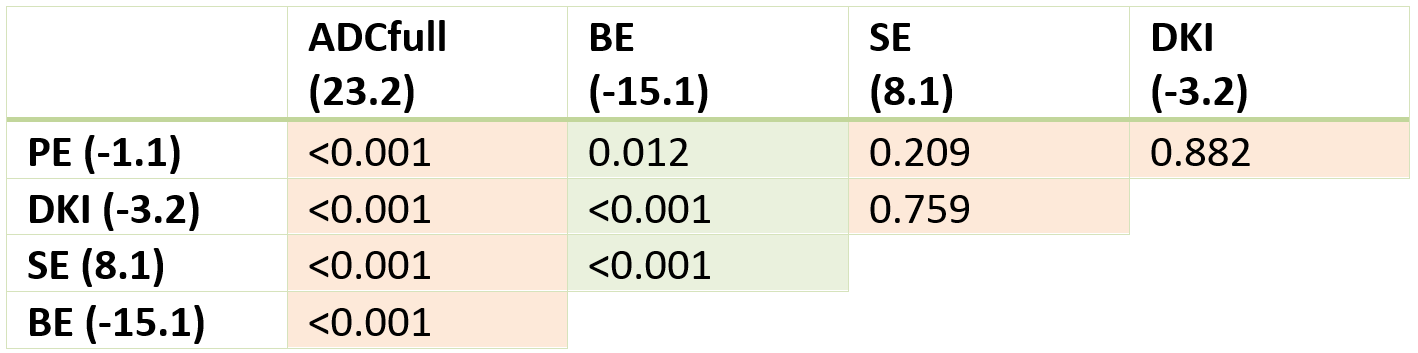
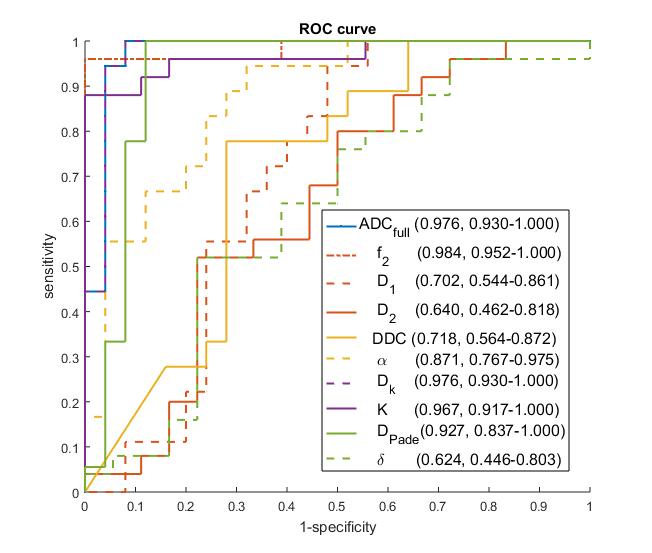
Forty-five patients underwent DWI-MRI; two datasets were excluded due to image/ghosting artefacts, resulting in 43 datasets (18 benign, 25 malignant) for multiple-model DWI fitting. Example signal curve and corresponding model fits are shown in Figure 1, with mean residuals across all patients per b-value shown in Figure 2; AIC for each patient is plotted in Figure 3. Results from the pairwise comparison are listed in Table 1. ROC curve for each of the fitted model parameter for differentiation between malignant and benign lesions is shown in Figure 4 together with the corresponding AUC value.Discussion
The bi-exponential model demonstrates significantly lower AIC-values than all the other models (Figure 3, Table 1), and does not show the systematic bias present for other models (s-shaped curve of mean residuals, Figure 2). This suggests the presence of two effective compartments in the breast lesion, which may represent physical compartments. Some work on that has already found the correlation between (1-f2) and stromal tissue content3, but further histopathological studies are required to examine bi-exponential assumption.
The utility of the kurtosis model is limited by the convergence radius; the Padé exponent model does not have this limitation7 and provided the best model fit in 5 cases, but overall did not provide significantly better fits than DKI. The stretched exponential returned higher AIC than Padé and DKI, though not significantly.
In terms of lesion differentiation, all models provide parameters with clinically useful classification accuracy (AUC>0.85), but not all parameters are good differentiators. ADC, f2, and Dk provide the best results (AUC>0.97). This indicates that the main clinical value of DWI is not dependent on the application of a specific diffusion model, although it may be valuable for further sub-typing of lesions.
Conclusion
The bi-exponential model provided the best overall fit to the data, with minimal and non-biased residuals, possibly revealing important microstructural information. Several diffusion models perform equally well in terms of lesion differentiation including bi-exponential. Further work is required to establish a possible clinical benefit from the non-Gaussian fitting of extended b-value ranges, for example in sub-typing applications.
Acknowledgements
No acknowledgement found.References
1. Partridge, S.C., W.B. DeMartini, B.F. Kurland, P.R. Eby, S.W. White, and C.D. Lehman, Differential diagnosis of mammographically and clinically occult breast lesions on diffusion-weighted MRI. Journal of Magnetic Resonance Imaging, 2010. 31(3): p. 562-570.
2. Guo, Y., Y.-Q. Cai, Z.-L. Cai, et al., Differentiation of clinically benign and malignant breast lesions using diffusion-weighted imaging. Journal of Magnetic Resonance Imaging, 2002. 16(2): p. 172-178.
3. Tamura, T., S. Usui, S. Murakami, et al., Comparisons of multi b-value DWI signal analysis with pathological specimen of breast cancer. Magnetic Resonance in Medicine, 2012. 68(3): p. 890-897.
4. Kärger J, P.H., Heink W, Principles and applications of self-diffusion measurements by nuclear magnetic resonance. Adv Magn Reson, 1988. 12: p. 1-89.
5. Bennett, K.M., K.M. Schmainda, R. Bennett, D.B. Rowe, H. Lu, and J.S. Hyde, Characterization of continuously distributed cortical water diffusion rates with a stretched-exponential model. Magnetic Resonance in Medicine, 2003. 50(4): p. 727-734.
6. Jensen, J.H., J.A. Helpern, A. Ramani, H. Lu, and K. Kaczynski, Diffusional kurtosis imaging: The quantification of non-gaussian water diffusion by means of magnetic resonance imaging. Magnetic Resonance in Medicine, 2005. 53(6): p. 1432-1440.
7. Kristoffersen, A., Optimized quantification of diffusional non-gaussianity in the human brain. Journal of Magnetic Resonance Imaging, 2013. 38(6): p. 1434-1444.
8. Holland, D., J.M. Kuperman, and A.M. Dale, Efficient correction of inhomogeneous static magnetic field-induced distortion in Echo Planar Imaging. NeuroImage, 2010. 50(1): p. 175-183.
9. Kiselev, V.G. and K.A. Il'yasov, Is the "biexponential diffusion" biexponential? Magn Reson Med, 2007. 57(3): p. 464-9.
Figures
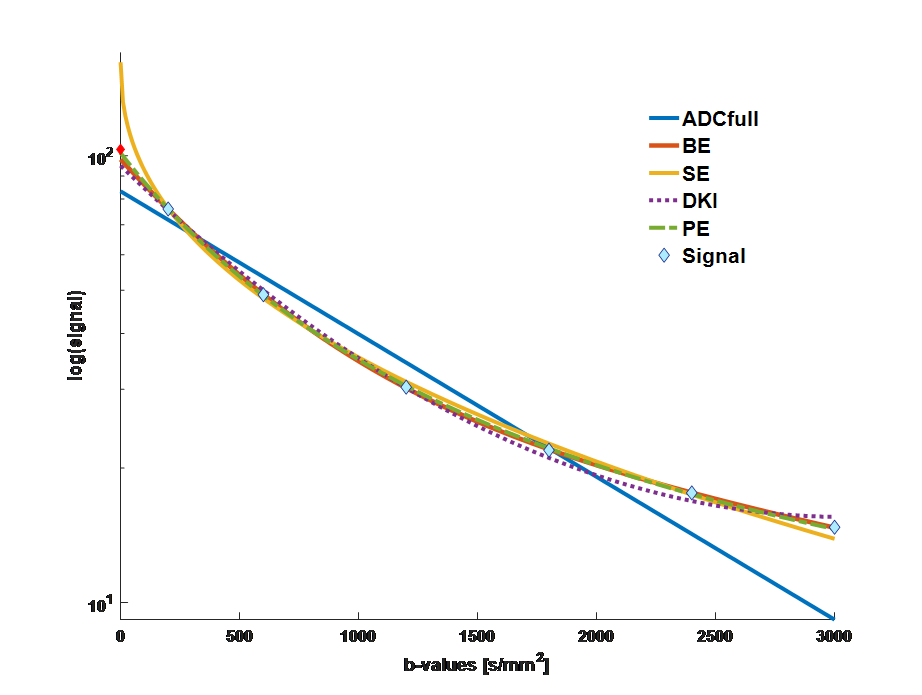
Figure 1. DWI signal decay (invasive ductal carcinoma), with fitted curves for all models (signal at b0 is marked red to indicate that it is excluded from fitting).
ADCfull – ADC using all b-values except b0, BE – bi-exponential, SE – stretched exponential, DKI – diffusion kurtosis model, PE – Padé exponent models