5362
Inadequate modeling of diffusion anisotropy can lead to artefactual IVIM effects: evidence from numerical simulations1NeuroSpin/CEA Saclay, Gif-sur-Yvette, France
Synopsis
The interest in studying perfusion anisotropy using IVIM imaging is growing. However, due to the small amount of perfusion in some tissues, IVIM imaging is highly sensitive to imperfections in the analysis. In this work, we investigate the impact of improperly modeling diffusion anisotropy on the IVIM effect. Performing numerical simulations of a perfusion-free tissue using different sets of diffusion directions and tissue orientations, we show that fitting anisotropic diffusion to the Kurtosis model creates a direction- and orientation-dependent IVIM effect, which can be minimized by taking the geometric mean of the signals with at least 6 properly chosen directions.
Introduction
IntraVoxel Incoherent Motion (IVIM) imaging allows for the simultaneous measurement of diffusion and perfusion parameters in tissues1 and is currently applied in clinics to neurological brain disorders2 and oncology3. Because of the very small perfusion fraction in some tissues (for example <5% in the brain), the IVIM analysis is subject to several biases such as the failure to model non-Gaussian diffusion and the presence of Rician noise at high b-values4. Here, we investigate another potential bias in the IVIM analysis, tissue diffusion anisotropy, using numerical simulations.Methods
Simulations of MRI signals. Non-Gaussian anisotropic diffusion was simulated in a virtual perfusion-free tissue using a bi-exponential (2-compartment) diffusion tensor model5 (MDslow/fast=0.2/1.1 10-3mm²/s, fslow=0.35, FAslow/fast= 0.5/0.28). θ, the angle between the tensors eigenvectors and the laboratory frame was varied in the range [0-180°]. Diffusion-weighted signals were generated for different sets of gradient directions (DTI sets) of 3, 6 and 30 directions6–9 and 30 b-values ([5-5000]s/mm²). For each DTI set of 6 directions, the absolute normalized sum of the b-matrix cross-terms (aNSBC) was calculated:
$$aNSBC=\left|\frac{1}{N_{b}N_{Dir}}\sum_{i=1}^{N_{Dir}}\sum_{j=1}^{N_{b}}\frac{2b_{ijxy}+2b_{ijxz}+2b_{ijyz}}{b_{nomj}}\right|$$
where Nb is the number of b-values, NDir the number of diffusion gradient directions, bij(xy/xz/yz) the b-matrix cross-terms for b-value i and direction j and bnomj the nominal value of b-value j which corresponds to the trace of the b-matrix.
Signal analysis. The simulated signals were analyzed either direction by direction or by taking the geometric mean of the signal over the DTI set using a 2-step process, first fitting for diffusion with the Kurtosis model10 for b=[300-3000]s/mm², then fitting the residual signal for b<300s/mm² to the mono-exponential IVIM model to estimate fIVIM (which should be 0 in this perfusion-free tissue).
Results
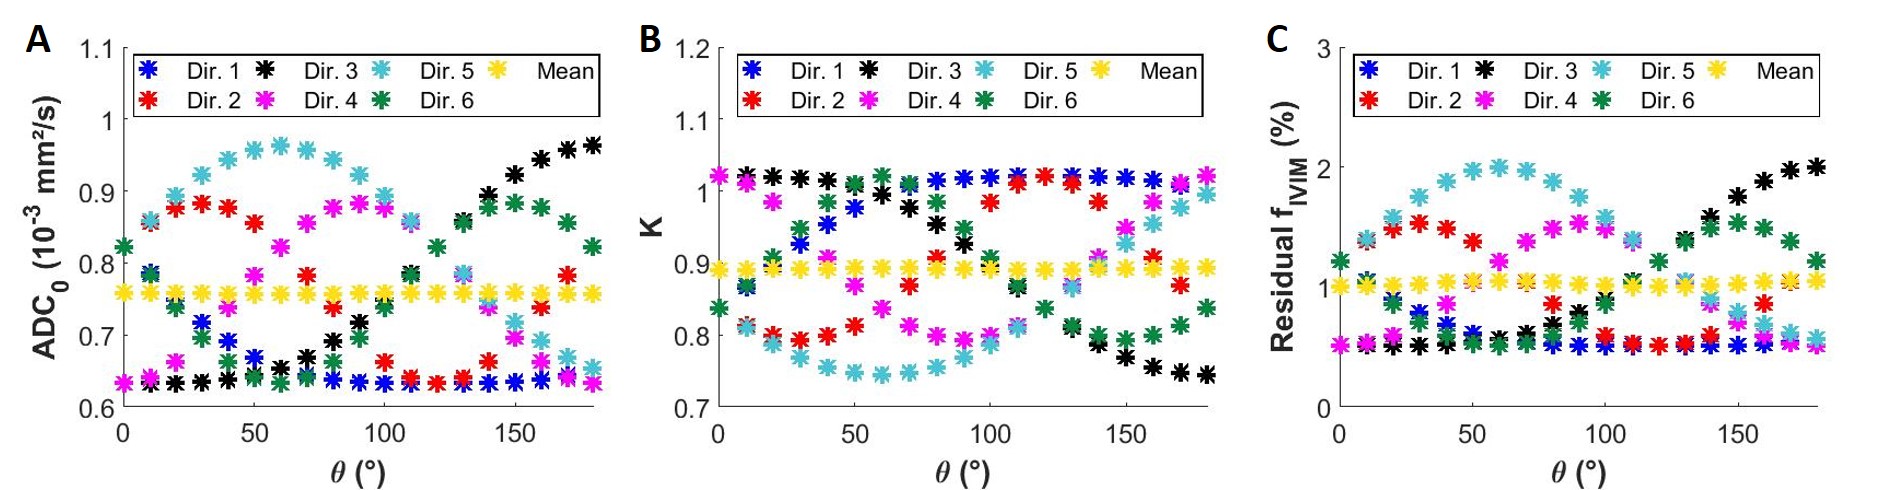
Fitting the simulated signals direction by direction for NDir=6, direction-dependent ADC0 and K are obtained which generate a direction-dependent residual IVIM effect (fIVIM≠0, Fig. 1). θ was varied to mimic a change in the tissue orientation, showing that the residual fIVIM is also orientation-dependent. However, when taking the geometric mean of the signal over the directions, this orientation-dependency nearly disappears but a residual fIVIM still exists (1%).
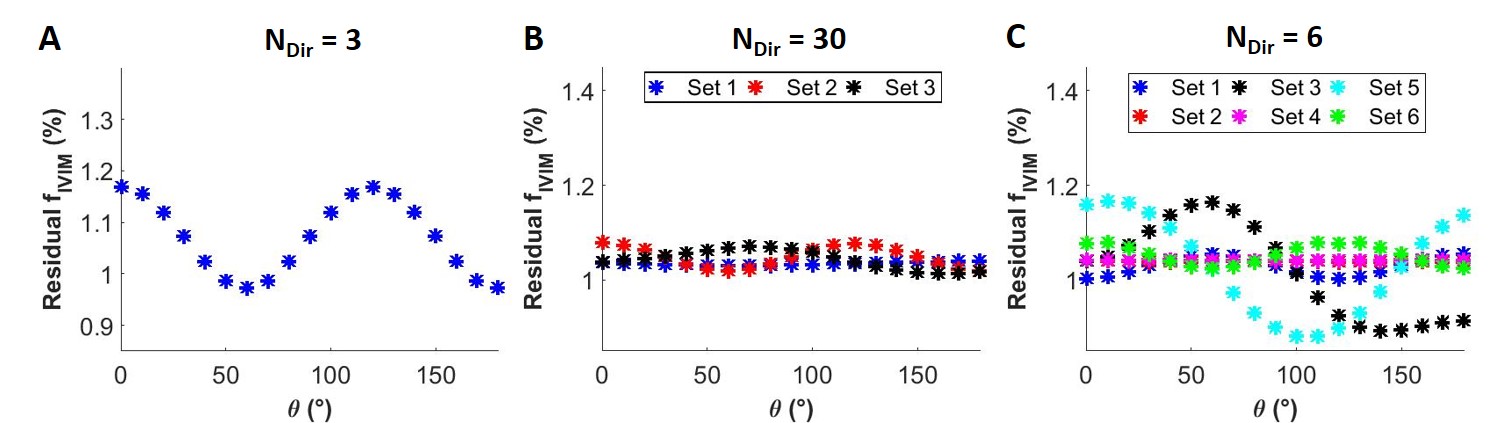
We also evaluated the influence of the number of diffusion directions in the DTI set when geometrically averaging over the directions. For NDir=3 (Fig. 2A), we found the largest fIVIM variation while for NDir=30 (Fig. 2B) it was very much reduced. For an intermediate case, NDir=6 (Fig. 2C), there is a larger variation of the residual fIVIM with θ for sets 3 and 5 compared to the others.
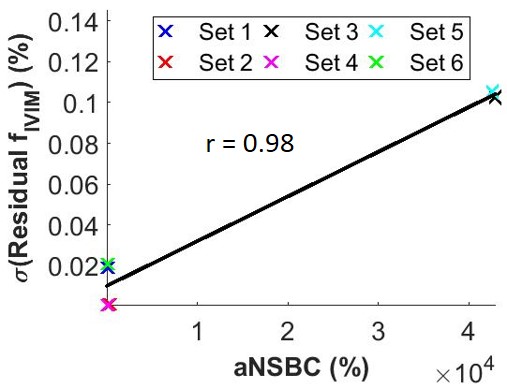
To help choose between the DTI sets, we introduced aNSBC. In Fig. 3, the standard deviation of the residual fIVIM with θ is plotted against aNSBC for each DTI set of NDir=6. This plot shows that aNSBC well predicts the variability of fIVIM with θ (r=0.98).
Discussion
The numerical simulations show that an artefactual direction- and orientation-dependent IVIM effect is created when the tissue diffusion anisotropy is not modeled properly. This IVIM effect varies with the choice of the diffusion direction encoding set. Minimizing aNSBC and taking the geometric mean of the MRI signal over the diffusion directions help in reducing the effect of the tissue orientation but a residual IVIM effect still remains.
The origin of this artefactual IVIM effect lies in the imperfect modeling of diffusion effects. In this study, the non-Gaussian tissue diffusion signal was generated as a combination of two exponential functions while numerical signals were analyzed using the Kurtosis model to avoid circularity. However, imperfect diffusion modeling of real data using the Kurtosis model is also expected, as this mathematical model does not truly reflect the diffusion process in tissues, especially when b-values become large. More sophisticated (higher order) tissue-specific models could improve the analysis with the drawback of losing generality and possibly requiring the lengthening of the acquisition time.
Conclusion
An artefactual anisotropic IVIM effect is created when analyzing perfusion-free data with the Kurtosis model, an important bias to take into account in the studies on IVIM perfusion anisotropy. However, this bias can be reduced by taking the geometric mean of the acquired signals with at least 6 diffusion directions properly chosen by minimizing aNSBC.Acknowledgements
This research was supported by the Louis-Jeantet Award (D. Le Bihan, PI) and the Olea Innovators award (G. Fournet) from Olea Medical.References
1. Le Bihan D, Breton E, Lallemand D, Aubin ML, Vignaud J, Laval-Jeantet M. Separation of diffusion and perfusion in intravoxel incoherent motion MR imaging. Radiology. 1988;168(2):497–505.
2. Suo S, Cao M, Zhu W, et al. Stroke assessment with intravoxel incoherent motion diffusion-weighted MRI. NMR Biomed. 2016;29(3):320-328. doi:10.1002/nbm.3467.
3. Noij DP, Martens RM, Marcus JT, et al. Intravoxel incoherent motion magnetic resonance imaging in head and neck cancer: A systematic review of the diagnostic and prognostic value. Oral Oncol. 2017;68:81-91. doi:10.1016/j.oraloncology.2017.03.016.
4. Iima M, Yano K, Kataoka M, et al. Quantitative non-Gaussian diffusion and intravoxel incoherent motion magnetic resonance imaging: differentiation of malignant and benign breast lesions. Invest Radiol. 2015;50(4):205–211.
5. Maier SE, Vajapeyam S, Mamata H, Westin C-F, Jolesz FA, Mulkern RV. Biexponential diffusion tensor analysis of human brain diffusion data. Magn Reson Med. 2004;51(2):321-330. doi:10.1002/mrm.10685.
6. Skare S, Hedehus M, Moseley ME, Li T-Q. Condition Number as a Measure of Noise Performance of Diffusion Tensor Data Acquisition Schemes with MRI. J Magn Reson. 2000;147(2):340-352. doi:10.1006/jmre.2000.2209.
7. Dubois J, Poupon C, Lethimonnier F, Le Bihan D. Optimized diffusion gradient orientation schemes for corrupted clinical DTI data sets. Magn Reson Mater Phys Biol Med. 2006;19(3):134-143. doi:10.1007/s10334-006-0036-0.
8. Jones DK, Leemans A. Diffusion tensor imaging. Magn Reson Neuroimaging Methods Protoc. 2011:127–144.
9. Hasan KM, Parker DL, Alexander AL. Comparison of gradient encoding schemes for diffusion-tensor MRI. J Magn Reson Imaging. 2001;13(5):769–780.
10. Jensen JH, Helpern JA. MRI quantification of non-Gaussian water diffusion by kurtosis analysis. NMR Biomed. 2010;23(7):698-710. doi:10.1002/nbm.1518.
Figures